Journal of Nutrition & Food Sciences
Open Access
ISSN: 2155-9600
ISSN: 2155-9600
Research Article - (2022)Volume 12, Issue 7
Consumers and food processors alike face a global problem in ensuring that food is safe for consumption and will not hurt when prepared according to its intended purpose. In Malawi, the only cost-effective fish preservation methods are chilling, icing, and refrigeration which are unfortunately hampered by the intermittent power supply. This study explored the preservation of fresh tilapia fish in Lactobacillus paracasei spp. paracasei 3 and Lactococcus lactis spp. lactis 1 culture under temperature conditions used during distribution towards the improvement of freshness quality. Data collection and analysis was conducted between October and December 2020 and the results revealed that Lactococcus lactis spp. lactis 1 strain effectively inhibited the growth of fish pathogens in both storage temperatures compared to Lactobacillus paracasei spp. paracasei. The Total Viable Counts (TVC) of the treated samples were decreasing from 5 log10 CFU/g to 2 log10 CFU/g and increasing untreated samples from 5 log10 CFU/g to 8 log10 CFU/g after 24 hours of storage, respectively. A very stronger inhibition (38.33 mm) and strong inhibition (18.67 mm) was produced by Lactococcus lactis spp. lactis 1 against Staphylococcus aureus and Aeromonas hydrophila pathogens, respectively. Conversely, a very strong inhibition (27 mm) was also achieved by Lactobacillus paracasei spp. paracasei 3 against Streptococcus pyrogen fish pathogen. The lowest concentration (0.35 mg MDA/Kg) of Thiobarbituric Acid Reactive Substance (TBARS) was achieved in treated samples after 24 hours of storage at ambient and refrigeration storage, respectively. However, the untreated samples became rancid after exceeding the acceptable limit of 2.5 mg MDA/Kg in both storage conditions after 24 hours of storage. The effect of Lactic Acid Bacteria (LAB) culture was manifested after 12 and 18 hours of ambient and refrigeration temperatures and extended the shelf life of fresh tilapia from 12–15 hours and 18–27 hours at ambient and refrigeration storage, respectively. In conclusion, the use of lactic acid bacteria culture as a bio preservative method can maintain the freshness quality of the fish during distribution to the outlets when adopted and utilized by fish farmers and fish itinerant traders.
Tilapia; Lactic acid bacteria; Sensory evaluation; Shelf life; Lipid oxidation
Fish is highly perishable with a high level of unsaturated fatty acids and hence more sensitive to quality degradation, which is aggravated by microbial activity, followed by autolysis and chemical oxidation [1-5]. Meanwhile, the colour of the skin, eye, flesh, and gills, as well as the smell of the skin, gills, and flesh, may be used to assess the grade of fish, which is subsequently verified by chemical and microbiological tests. Reported that slime development, discoloration, texture changes, off-odors, and gas production are the most visible spoiling indicators in fish and fish products. Freshness spoilage in fish is inevitable because newly caught fish have a significant quantity of germs, ranging from 2–7 log10 CFU/g on the skin and 3–9 log10 CFU/g on the gills and intestines. During distribution to outlets, ice or refrigerated trucks are utilized to preserve fish after they have been caught. Malawi Development Corporation (MALDECO) is the sole company possessing cold-chain transportation equipment, as well as ice plants and chill storage facilities along the lakeshore. Furthermore, the vast majority of local fish sellers participating in the distribution of fish lack proper storage facilities to prevent fish spoiling. As a result, they only process fish using smoking, sun-drying, para-boiling, or para-roasting before being sold to consumers accounting for about 90% of the fish, while the remaining 10% is consumed while fresh, chilled, or frozen. However, when compared to fresh fish, these procedures cause damage to the fish tissues, lower some important nutrients, and harbor mound infection when the fish is not thoroughly dried. Smoking and roasting processes were found to be responsible for 42.4% of post-harvest fish losses in Malawi. Chilling and freezing procedures are not exempt from this since they do not kill or inhibit the formation of spoilage microorganisms in fish and fish product. This is why it is critical to treat the fish with LAB strains as soon as possible after capture before the bacteria disperse into the flesh and break down the complex mixture (nutrients) that are naturally present in the fish.
The assurance that the food is safe for consumption and that it will not cause any harm to consumers when prepared according to its intended purpose remains a global problem for consumers and food processors alike. To prevent, decrease, and control foodborne disease causing microorganisms to an acceptable level, multidisciplinary approaches have been advocated. One of the approaches which have been extensively explored is bio preservation; a revolutionary technology that uses microorganisms such as Lactic Acid Bacteria (LAB) to prevent the growth of other pathogenic microorganisms. LAB is a varied cluster of microorganisms in food that are gram-positive rod or cocci, acid-tolerant, aero tolerant, non-sporulation, and no respiring bacteria microorganisms and produce lactic acid as their main product. LAB produces bacteriocins that offer antagonistic, inhibitory and antimicrobial defense mechanisms in food. Studies show that LAB is not only antimicrobial but also acts as an antifungal agent in a variety of foods, including meat. Fish and fish product. According to, Lactobacillus spp. is the most often utilized LAB bacterium, with over 125 species including Lactobacillus casei, Lb. acidophilus, Lb. plantarum and Lb. rhamnosus. in food bio preservation. Also reported that additional LAB strains belonging to Lactococcus spp. and Streptococcus spp. are another species implored and these produce two molecules of lactic acid from each glucose metabolism in comparison to Lactobacillus species.
For decades, preserving the freshness quality of fresh fish before it reaches the consumer has been a concern. The perishability of fish is frequently exacerbated by the great distance between fishing grounds, itinerant fish sellers (middlemen), and consumers (outlets). Fresh fish also spend a long time after being caught, on the way to the landing site, and during transportation, providing extra opportunities for microbial growth. Cross contamination occurs as a result of poor hygienicsanitary conditions during fish distribution from fishing sites to outlets, making it more difficult to maintain the hygienic freshness quality of fish. Most fish traders still use ice as their only and most cost-effective means of retaining the freshness quality of their catch. However, power failures make mechanical refrigerators for ice output irregular and in small quantities, resulting in additional running costs for fishermen and ultimately minimal profits. Fish live in a microbe rich environment and are sensitive to pathogenic or opportunistic microbes and according to studies, fish deterioration begins quickly after rigor-mortis. In addition, research has demonstrated that pathogens and spoilage bacteria that cling to fish contact surfaces survive cleaning and disinfection. It has also been noted that fat degradation (oxidation) occurs frequently in frozen fresh fish due to the abundance of unsaturated fatty acids, which are rapidly oxidized and produce rancidity spoilage [6-10]. Preserving fresh fish using natural microorganisms (bacteria) does not only prolong the shelf life but also maintains the quality and nutritional properties [11-15]. The study is the first of its kind to explore the preservation of fresh farmed tilapia fish in lactic acid bacteria culture under temperature conditions used during distribution towards improvement of sensorial quality, microbiological and biochemical safety of the fish. The data generated can be useful to the fish traders to adopt and utilize the technology there by reducing the fish postharvest losses and increases profits, nutrition and food security.
Study areas
The research was approved by the ethics committees of LUANAR. Bunda College fish farm was identified because it rears tilapia fish for research purposes at the university. Whole fresh farmed tilapia fish samples were collected from Bunda College fish farm. The analyses were conducted at the Lilongwe University of Agriculture and Natural Resources (LUANAR) Foods, Microbiology and Chemistry Laboratories and Central Veterinary Laboratory (CVL) in Lilongwe. During stock culture cultivation and all microbiological analyses, the media, apparatus and other utensils were autoclaved at 121°C for 15 minutes and were checked by the autoclave tape and the manifestation of the stacked slant black lines on the tape showed successful sterilization (Figure 1).

Figure 1: The autoclave tape with invisible black lines (left view) and visible black lines (right view) for quality control check of the complete media autoclaving.
Cultivation of stock culture
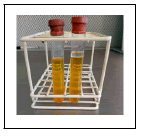
Lactobacillus paracasei spp. paracasei 3 and Lactococcus lactis subsp. lactis 1 stock cultures were obtained from the LUANAR Food Microbiology laboratory. The de Man, Rogosa and Sharpe (MRS 1049608, Biolab, Merck, and Modderfontein, South Africa) broth was prepared according to the manufacturer’s instructions for the resuscitation of the culture. The stock cultures were taken from the freezer and allowed to stand at room temperature. Then a loopful of the culture was transferred into a 9 ml prepared MRS broth media for resuscitation [16-20]. The inoculated culture was then incubated for 24–48 hours at 35℃. To confirm the growth culture revival, from the incubated tubes, 1 ml of the culture was transferred into a 9 ml prepared sterile MRS agar (MRS, Oxoid, Basingstoke, Hampshire, UK) in a petri dish using the pour plate method. The culture was resuscitated by repeated sub culturing by transferring 1 ml from the 48 hours incubated tube into a 9 ml freshly prepared MRS broth followed by incubation for another 48 hours. The sub culturing of LAB was repeated until the maximum required cell density of 5 log10 CFU/ml and 7 log10 CFU/ml was achieved. The enumeration of the cells (cell density) was done as described by. One ml from the 48 hours incubated culture was aseptically transferred into a 9 ml buffered peptone water (BPW, CM0509, Oxoid Ltd, UK) and the mixture was vortex mixed for 20’s then 10 fold serial dilutions were made. Using the pour plate method, 1 ml was aseptically transferred into the prepared MRS agar petri dish and incubated for 48 hours at 37℃. The cells were counted using a colony counter. In the study, the cell densities of 5 log10 CFU/ml and 7 log10 CFU/ml were prioritized for sample treatment [21-23].
Research design and sample treatment
Fish samples were captured from four Bunda fish farmed tilapia ponds using fishing nets. The captured fish were transferred into the fish tank in the hatchery. Five hundred and eighty (580) fishes of average sized between 40 g–160 g were randomly sampled from the tank and treated with LAB strains. A two by two factorial completely randomized block design was used in the experiment where the treatments were storage (ambient and refrigeration) temperatures and blocks were the fish samples (muscle and gills). Five groups of fish samples were sample A (untreated), samples B (5 log10 CFU/ml) and C (7 log10 CFU/ml) both treated with Lactobacillus paracasei spp. paracasei 3 and samples D (5 log10 CFU/ml) and E (7 log10 CFU/ml) both treated with Lactococcus lactis subsp. lactis . The live fish samples were picked and immersed in the prepared inoculum for 10 minutes and then were immediately packed in sterilized pathology spacemen bags. The five fish samples groups were directly packed in a cooler box without ice and represent ambient stored samples and the other five groups were packed in a cooler box containing iced (4℃) and these represent refrigerated stored samples. Immediately, the samples were taken to the laboratory (about 10–15 minutes’ drive). In the laboratory, the five groups of samples were removed from the cooler box and each group was packed in a container and stored in the fridge which was set at 25°C (ambient) and the other five groups of samples from the iced cooler box were packed in a container and stored in the refrigerator which was set at 4oC (refrigerated). The initial microbial, pH and treatable acidity analyses were done upon arrival and the analyses were taken at 12 hours intervals. Sensory evaluation analysis was done upon arrival and the analyses were taken at 3 hour intervals until the fish were rejected by the panelists. Biochemical analysis were conducted at zero hours and 24 hours of ambient and refrigeration storage.
Identification and enumeration of bacteria
The samples from the underlying fish muscle portions and the gills were aseptically removed and thoroughly homogenized using stomacher BAGMIXER 400 model P (Interscience, Interlab, and Paris, France) as shown in (Figure 2). The samples were subculture and morphological characteristics of various bacteria isolates were observed in the agar petri dishes and examined in microscopy.

Figure 2: Aseptically cutting and removing the skin and muscle (top left, middle view and top right), cutting at the base and removing the gills (bottom left and right) of fresh farmed tilapia for microbial isolation.
After performing gram staining reactions, the isolates were subjected to various biochemical tests such as catalase, cytochrome oxidase, Oxidative Fermentative (OF), urease, motility and Triple Sugar Iron (TSI-agar) following the procedure described by. Using the pour plate method, the identified microbial isolates were diluted to 10 fold decimal dilutions and then re-subculture on various selective growth media. After incubation, the number of colonies growing on the petri dishes was counted using colony counter (Schutt count plus Nr. 05014, Germany) and the results were reported in log10 CFU/g.
Determination of antimicrobial activities (LAB sensitivity)
To determine whether Lactobacillus paracasei spp. paracasei 3 and Lactococcus lactis subsp. lactis 1 strain can be used in biopreservation of fresh farmed tilapia fish, the strains were subjected to the identified individual isolates to test for antimicrobial activities. The Agar Disk Diffusion (ADD) method was used as described by. The uniform paper discs (5 mm) diameter was sterilized by Ultraviolet light (SterilGard Model SG404-INT, Baker Company Sanford, Maine). The LAB strains were inoculated in MRS broth and incubated for 24 hours at 37℃. After the incubation, the disks were placed in petri dishes containing sterile MRS agar and swirled. According to, Mueller Hinton Agar (MHA) media was used as a recommended standard medium for antimicrobial inhibition test (sensitivity). The media was prepared according to the manufacturer’s instructions (MHA, 0252-01-4, Difco Laboratories, Detroit, Michigan, USA). The identified individual pathogens were each streaked onto duplicate petri dishes over and across the surface of the MHA using a sterilized disposable plastic loop. Three paper disks from each LAB strain were transferred onto the surface of the petri dish that was swabbed with the designated pathogen by using a sterilized disposable hypodermic needle. After incubation for 24 hours at 37℃, the petri dishes were later observed for a Zone Of Inhibition (ZOI) around the disk and the diameter was measured in mm. The results were reported as ZOI ± SD in mm.
Physiochemical and biochemical analysis
pH measurement (- H+): The procedure for pH determination was done by following the procedure described by where 10 g each from muscle and gills was taken and mixed with 50 ml of distilled water and swirled to mix thoroughly then homogenized in a stomacher BAGMIXER 400 model P (Interscience). 10 ml of the mixture was transferred into the test tube then centrifuged at 3000 rpm for 15 using a digital centrifuge (model DSC-202SD, Digi system Laboratory Instruments Inc, Taiwan). The mixture was filtered using Whatman filter paper No 1. Before using the instrument, the pH meter was first calibrated according to the manufactures instruction (HD2305, LTH Electronics, and United Kingdom. After calibration, the electrode was carefully cleaned and dipped into the diluted homogenized sample and the readings were recorded. After every sample testing, the pH meter electrode was cleaned carefully.
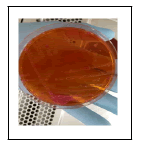
Determination of treatable acidity
Titrable acidity was determined by following the procedure illustrated by where 10 g from each homogenized muscle and gills sample was mixed with 50 ml distilled water and centrifuged at 3000 x g for 2 hours. The supernatant (10 ml) was diluted with 20 ml of distilled water and then boiled for 1 minute then the mixture was allowed to be cooled at ambient temperature. 5 drops of phenolphthalein indicator were added and titrated with 0.1 M NaOH until a slightly pink colour was evident. TA was then calculated and presented as the concentration of lactic acid.
Where:
M=Molarity
V=Volume (mL) Determination of Thiobarbituric acid (TBA)
Thiobarbituric Acid (TBA) determination: Thiobarbituric Acid Reactive Substance (TBARS) quantification as a secondary by-product of lipid oxidation was done by following the procedure outlined by with modification by Wen.
Sensory evaluation
Sensory evaluation was done using ten (10) trained panelists following the Quality Index Method (QIM) scheme earlier applied by which was later modified based on the descriptors observed by the panelists from the samples. The modified QIM scheme (Table 1) was used for the quality assessment and determination shelf life of the fresh farmed tilapia fish samples stored at ambient and refrigeration temperature.
| Quality parameter | Description | Score | |
|---|---|---|---|
| Skin | Appearance | Shiny grey | 0 |
| Grey, not shiny | 1 | ||
| Yellowish near the abdomen | 2 | ||
| Scale | Firm | 0 | |
| Loose | 1 | ||
| Mucus | Clear not clotted | 0 | |
| Milky clotted | 1 | ||
| Yellow and clotted | 2 | ||
| Odour | Fresh, cut grass, aquatic weed | 0 | |
| Neutral | 1 | ||
| Musty | 2 | ||
| Eye | Cornea | Very clear (glass like) | 0 |
| Cloudy | 1 | ||
| Milky | 2 | ||
| Opaque pupil | 3 | ||
| Form | Convex | 0 | |
| Flat | 1 | ||
| Sunken | 2 | ||
| Gills | Colour | Bright red | 0 |
| Pale red | 1 | ||
| Grey-brown, green | 2 | ||
| Smell | Fresh, cut grass, aquatic weed | 0 | |
| Neutral | 1 | ||
| Musty | 2 | ||
| Mucus | Clear | 0 | |
| Cloudy | 1 | ||
| Milky | 2 | ||
| Brown reddish | 3 | ||
| Texture | Backside | Firm and elastic (in-rigour) | 0 |
| Soft and finger disappears quickly | 1 | ||
| Very soft and a finger leaves a mark | 2 | ||
| Belly | Firm | 0 | |
| Soft | 1 | ||
| Quality index | 0-22 | ||
Table 1: Quality index method scheme protocols for evaluating whole fresh tilapia fish.
The parameters studied by the panel were: the skin by observing its colour, mucus, Odour and stability of the scales; the clarity (cornea) and shape (form) of the eyes; the gills which included their colour, smell and mucus and the texture of the backside and belly. The QIM was well defined based on characteristic changes of outer appearance attributes with a scoring system from 0 (good freshness) to 3 (spoiled) demerit points. The QIM with lower scores or close to zero indicated newly caught and fresh fish. The sum of the attributes was called demerit points or QIM index points and 22 was the cutoff point beyond which the sample was considered as deteriorating and spoiled. The average total quality index and storage time was used to plot a linear regression equation which was used to predict remaining shelf life in refrigeration and ambient storage. The maximum storage time in ambient and refrigeration was defined as the day when the fish was unfit for human consumption. Each panelist was presented with samples to visually examine (Figure 3) the changes of the sensory parameters of fresh farmed tilapia fish.

Figure 3: A summary presentation of sensory evaluation of eyes (top left), gills (middle view), the scales and skin (top right), backside (bottom left) and belly (bottom right) of the fresh farmed tilapia fish preserved with LAB culture.
Data analysis
The collected data were analyzed using IBM Statistical Package for Social Sciences (SPSS) stastical software version 25. Univariate analysis revealed that the data were normally distributed and therefore the data were subjected to analysis of variance (ANOVA) at a 5% significance level. Multiple comparisons of means for interactions were separated by the Tukey test. Data visualization was computed using Excel and the evaluation for the importance of each sensory attribute was determined by subjecting it to Principle Component Analysis (PCA) using panel check software 1.4.2.
Microbial determination
The interaction effect between the independent factors was statistically significant (p<0.05) suggesting that the inoculum level, temperature conditions and fish portion influenced the freshness quality of fresh farmed tilapia fish as summarized in Table 12. The type of strain, inoculum level, the temperature conditions (ambient and refrigeration), the tilapia portion (muscle and gills) influenced the shelf life of fresh fish. The results for Salmonella and Shigella were not reported as no growth of the bacteria in the petri dishes was found. The levels (TVC) obtained after 24 hours of study at ambient storage reached 8.88 log10 CFU/g (untreated), indicating that the fish severely deteriorated and this was also observed in samples kept at refrigeration temperature (7.63 log10 CFU/g) as summarized in Table 2.
| Microbial | Time | Type of samples and storage temperatures | |||||||||
|---|---|---|---|---|---|---|---|---|---|---|---|
| Untreated (25 ℃) | Lb. of 5 log10 CFU/ml (25 ℃) | Lb. of 7 log10 CFU/ml (25 ℃) | Lc. of 5 log10 CFU/ml (25 ℃) | Lb. of 7 log10 CFU/ml (25 ℃) | Untreated (25 ℃) | Lb. of 5 log10 CFU/ml (4 ℃) | Lb. of 5 log10 CFU/ml (4 ℃) | Lc. of 5 log10 CFU/ml (4 ℃) | Lc. of 5 log10 CFU/ml (4 ℃) | ||
| Total Coliform | Zero hour | 4.65± 0.13a | 4.41 ± 0.45a | 4.35 ± 0.56a | 4.66 ± 0.12a | 4.42 ± 0.59a | 4.65± 0.13a | 4.41 ± 0.45a | 4.35 ± 0.56a | 4.66 ± 0.12a | 4.42 ± 0.59a |
| 12th hour | 5.59± 0.07b | 3.70 ± 0.15a | 3.63 ± 0.05a | 3.72 ± 0.17a | 3.67 ± 0.10a | 4.75± 0.13b | 3.64 ± 0.08a | 3.69 ± 0.15a | 3.63 ± 0.18a | 3.58 ± 0.05a | |
| 24th hour | 7.83± 0.11b | 2.60 ± 0.06a | TFTC | 2.73 ± 0.08a | TFTC | 5.79 ± 0.21c | 3.40 ± 0.49ab | 2.85 ± 0.43a | 3.75 ± 0.51b | 2.68 ± 0.08a | |
| E. coli | Zero hour | 3.71± 0.8a | 3.68 ± 0.10a | 3.67 ± 0.13a | 3.74 ± 0.08a | 4.40 ± 0.46b | 3.71± 0.8a | 3.68 ± 0.10a | 3.67 ± 0.13a | 3.74 ± 0.08a | 4.40 ± 0.46b |
| 12th hour | 4.64± 0.11b | 3.54 ± 0.03a | 3.59 ± 0.05a | 3.65 ± 0.16a | 3.64 ± 0.09a | 3.60± 0.05a | 3.61 ± 0.14a | 3.61 ± 0.08a | 3.61 ± 0.08a | 3.57 ± 0.11a | |
| 24th hour | 7.79± 0.14c | 2.59 ± 0.10a | TFTC | 2.64 ± 0.08a | TFTC | 5.64± 0.12b | 3.04 ± 0.65a | 1.94 ± 1.30a | 2.70 ± 0.12a | TFTC | |
| Proteus vulgaris | Zero hour | 3.64 ± 0.11a | 3.66 ± 0.09a | 3.63 ± 0.12a | 3.62 ± 0.11a | 3.37 ± 0.11a | 3.64 ± 0.11a | 3.66 ± 0.09a | 3.63 ± 0.12a | 3.62 ± 0.11a | 3.37 ± 0.11a |
| 12th hour | 4.72 ± 0.10c | 3.61 ± 0.07b | 2.68 ± 0.13a | 2.69 ± 0.11a | 2.73 ± 0.14a | 4.65 ± 0.13c | 3.60 ± 0.08b | 2.73 ± 0.06a | 3.14 ± 0.59b | 2.65 ± 0.09a | |
| 24th hour | 5.71 ± 0.03b | 3.59 ± 0.11b | 2.60 ± 0.04a | 2.55 ± 0.05a | TFTC | 5.74 ± 0.10b | 2.60 ± 0.08a | 2.58 ± 0.07a | 1.27 ± 1.47a | TFTC | |
| Aeromonas hydrophila | Zero hour | 3.40± 0.55a | 3.42 ± 0.56a | 3.37 ± 0.53a | 3.45 ± 0.49a | 3.37 ± 0.49a | 3.40± 0.55a | 3.42 ± 0.56a | 3.37 ± 0.53a | 3.45 ± 0.49a | 3.37 ± 0.49a |
| 12th hour | 3.67± 0.09b | 2.88 ± 0.45ab | 2.63 ± 0.10a | 3.18 ± 0.69ab | 2.59 ± 0.08a | 2.93± 0.47a | 3.07 ± 0.53a | 2.62 ± 0.12a | 2.65 ± 0.07a | 2.58 ± 0.07a | |
| 24th hour | 4.67 ± 0.10c | 2.54 ± 0.03a | 2.70 ± 0.05b | 2.54 ± 0.06a | TFTC | 3.16 ± 0.64c | 2.56 ± 0.07b | 2.58 ± 0.07b | 1.27 ± 1.45a | TFTC | |
| S. aureus. | Zero hour | 3.76 ± 0.15a | 3.72 ± 0.09a | 3.63 ± 0.05a | 3.64 ± 0.11a | 3.65 ± 0.10a | 3.76 ± 0.15a | 3.72 ± 0.09a | 3.63 ± 0.05a | 3.64 ± 0.11a | 3.65 ± 0.10a |
| 12th hour | 4.63 ± 0.11b | 3.63 ± 0.09ab | 2.68 ± 0.09a | 3.69 ± 0.06ab | 2.65 ± 0.10a | 4.65 ± 0.15c | 3.57 ± 0.08b | 3.71 ± 0.13b | 3.70 ± 0.11b | 2.67 ± 0.09a | |
| 24th hour | 6.67 ± 0.10b | 2.62 ± 0.07a | 2.61 ± 0.07a | 2.69 ± 0.05a | 2.59 ± 0.04a | 4.65± 0.02b | TFTC | 2.57 ± 0.06a | 2.61 ± 0.10a | TFTC | |
| Str. pyrogene | Zero hour | 4.54± 0.06a | 4.63 ± 0.11ab | 4.61 ± 0.05ab | 4.73 ± 0.10b | 4.61 ± 0.07ab | 4.54± 0.06a | 4.63 ± 0.11ab | 4.61 ± 0.05ab | 4.73 ± 0.10b | 4.61 ± 0.07ab |
| 12th hour | 4.68± 0.08b | 3.58 ± 0.07a | 3.66 ± 0.07a | 3.67 ± 0.12a | 3.64 ± 0.14a | 4.60± 0.05b | 4.14 ± 0.62ab | 3.69 ± 0.03a | 3.70 ± 0.16a | 3.58 ± 0.08a | |
| 24th hour | 5.66± 0.10b | 2.91 ± 0.56a | TFTC | 2.71 ± 0.07a | 2.69 ± 0.11a | 4.69± 0.14b | 2.66 ± 0.10a | TFTC | 1.97 ± 1.32a | 2.63 ± 0.04a | |
| LAB | Zero hour | No growth | 5.71 ± 0.19a | 7.51 ± 0.02b | 5.55 ± 0.06a | 7.55 ± 0.08b | No growth | 5.71 ± 0.19a | 7.51 ± 0.02b | 5.55 ± 0.06a | 7.55 ± 0.08b |
| 12th hour | No growth | 6.25 ± 0.75a | 8.89 ± 0.07c | 7.24 ± 0.57b | 8.64 ± 0.14c | No growth | 5.54 ± 0.68a | 8.80 ± 0.17c | 6.83 ± 0.13b | 8.50 ± 0.44c | |
| 24th hour | TFTC | 8.09 ± 0.60a | 9.03 ± 0.09b | 8.75 ± 0.09a | TMTC | TFTC | 7.43 ± 0.53a | 9.01 ± 0.07b | 7.81 ± 0.17a | 8.69 ± 0.13b | |
| TVC | Zero hour | 5.58±0.11b | 5.59 ± 0.12b | 5.59 ± 0.06b | 5.59 ± 0.06b | 4.70 ± 0.09a | 5.58± 0.11b | 5.59 ± 0.12b | 5.59 ± 0.06b | 5.59 ± 0.06b | 4.70 ± 0.09a |
| 12th hour | 7.58± 0.11b | 4.63 ± 0.09a | 4.72 ± 0.05a | 4.71 ± 0.11a | 4.59 ± 0.10a | 6.68± 0.05b | 4.66 ± 0.10a | 4.57 ± 0.07a | 4.75 ± 0.11a | 4.68 ± 0.15a | |
| 24th hour | 8.88± 0.18d | 4.76 ± 0.05c | 3.61 ± 0.06b | 3.64 ± 0.08b | 2.67 ± 0.08a | 7.63 ± 0.09c | 3.66 ± 0.05a | 3.53 ± 0.08a | 4.63 ± 0.15b | 3.61 ± 0.10a | |
Note: Reported values represent the Mean and SD and the means in the same row with different superscripts were significantly different (p<0.05).
Key: Lb.=Lactobacillus paracasei spp. paracasei 3 and Lc.=Lactococcus lactis subsp. lactis 1.
Table 2: Microbial load (log10 CFU/g) of tilapia muscle after 24 hours of ambient and refrigeration storage temperatures.
Biochemical characterization of pathogens: The results of pathogens isolated from fresh farmed tilapia fish are shown in Table 4. Which included E.coli, Streptococcus pyrogene, Staphylococcus aurous, Proteus vulgaris and Aeromonas hydrophila and the pictures of test results are presented in Tables 3 and 13.
| Microbial | Time | Type of samples and storage temperatures | |||||||||
|---|---|---|---|---|---|---|---|---|---|---|---|
| Untreated (25°C) | Lb. of 5 log10 CFU/ml (25°C) | Lb. of 7 log10 CFU/ml (25°C) | Lc. of 5 log10 CFU/ml (25°C) | Lb. of 7 log10 CFU/ml (25°C) | Untreated (25°C) | Lb. of 5 log10 CFU/ml (4°C) | Lb. of 5 log10 CFU/ml (4°C) | Lc. of 5 log10 CFU/ml (4°C) | Lc. of 5 log10 CFU/ml (4°C) | ||
| Total Coliform | 0 hour | 4.68 ± 0.17a | 4.74 ± 0.53a | 4.53 ± 0.48a | 4.52 ± 0.51a | 4.70 ± 0.14a | 4.68 ± 0.17a | 4.74 ± 0.53a | 4.53 ± 0.48a | 4.52 ± 0.51a | 4.70 ± 0.14a |
| 12th hour | 6.77 ± 0.10c | 4.67 ± 0.12b | 4.64 ± 0.13b | 4.68 ± 0.11b | 4.75 ± 0.13b | 5.82 ± 0.15b | 4.60 ± 0.07b | 3.75 ± 0.17a | 4.58 ± 0.08b | 4.53 ± 0.02b | |
| 24th hour | 7.95 ± 0.58c | 3.67 ± 0.09b | 3.63 ± 0.11b | 3.61 ± 0.10b | 2.86 ± 0.47a | 6.70 ± 0.14c | 3.70 ± 0.09b | 2.62 ± 0.07a | 3.44 ± 0.54b | 2.64 ± 0.04a | |
| E. coli | 0 hour | 4.65 ± 0.05a | 4.67 ± 0.05a | 4.49 ± 0.39a | 4.41 ± 0.59a | 4.49 ± 0.58a | 4.65 ± 0.05a | 4.67 ± 0.05a | 4.49 ± 0.39a | 4.41 ± 0.59a | 4.49 ± 0.58a |
| 12th hour | 6.60 ± 0.08c | 4.25 ± 0.47ab | 4.51 ± 0.42b | 3.64 ± 0.09a | 3.71 ± 0.08a | 5.64 ± 0.08c | 3.75 ± 0.16a | 3.62 ± 0.09a | 3.72 ± 0.10a | 3.71 ± 0.07a | |
| 24th hour | 7.71 ± 0.08c | 3.61 ± 0.10b | 2.65 ± 0.11a | 2.59 ± 0.11a | TFTC | 5.85 ± 0.14b | 2.63 ± 0.08a | TFTC | 2.58 ± 0.05a | TFTC | |
| Proteus vulgaris | 0 hour | 3.86 ± 0.45a | 4.20 ± 0.61a | 4.10 ± 0.52a | 4.22 ± 0.59a | 4.20 ± 0.46a | 3.86 ± 0.45a | 4.20 ± 0.61a | 4.10 ± 0.52a | 4.22 ± 0.59a | 4.20 ± 0.46a |
| 12th hour | 4.66 ± 0.11c | 3.59 ± 0.08b | 2.90 ± 0.49a | 3.62 ± 0.11b | 2.65 ± 0.09a | 4.63 ± 0.04b | 3.63 ± 0.16a | 3.16 ± 0.45a | 3.26 ± 0.60a | 3.01 ± 0.48a | |
| 24th hour | 5.67 ± 0.14c | 3.59 ± 0.11b | 2.89 ± 0.40a | 2.64 ± 0.14a | 2.63 ± 0.09a | 4.68 ± 0.03c | 2.64 ± 0.05b | 2.51 ± 0.02a | 2.51 ± 0.03a | 2.54 ± 0.07ab | |
| Aeromonas hydrophila | 0 hour | 3.71 ± 0.08a | 3.69 ± 0.12a | 3.68 ± 0.10a | 3.64 ± 0.14a | 3.69 ± 0.11a | 3.71 ± 0.08a | 3.69 ± 0.12a | 3.68 ± 0.10a | 3.64 ± 0.14a | 3.69 ± 0.11a |
| 12th hour | 3.70 ± 0.12b | 3.43 ± 0.44ab | 3.06 ± 0.53ab | 3.13 ± 0.47ab | 2.63 ± 0.02a | 3.72 ± 0.05b | 3.36 ± 0.57b | 3.57 ± 0.06b | 3.64 ± 0.14b | 2.70 ± 0.04a | |
| 24th hour | 4.37 ± 0.40b | 2.93 ± 0.40a | 2.88 ± 0.46a | 2.69 ± 0.05a | TFTC | 3.70 ± 0.06b | 2.84 ± 0.46a | 2.86 ± 0.48a | TFTC | TFTC | |
| S. aureus. | 0 hour | 4.65 ± 0.13a | 4.63 ± 0.14a | 4.71 ± 0.14a | 4.70 ± 0.14a | 4.59 ± 0.07a | 4.65 ± 0.13a | 4.63 ± 0.14a | 4.71 ± 0.14a | 4.70 ± 0.14a | 4.59 ± 0.07a |
| 12th hour | 5.69 ± 0.10c | 3.73 ± 0.11a | 3.67 ± 0.09a | 4.67 ± 0.04b | 3.68 ± 0.15a | 4.72 ± 0.07b | 3.66 ± 0.07a | 3.67 ± 0.09a | 3.74 ± 0.07a | 3.63 ± 0.11a | |
| 24th hour | 6.81 ± 0.16c | 2.65 ± 0.11a | TFTC | 3.64 ± 0.15b | 2.65 ± 0.10a | 5.72 ± 0.09b | 2.73 ± 0.08a | TFTC | 2.04 ± 1.37a | TFTC | |
| Str. pyrogene | 0 hour | 4.87 ± 0.53a | 4.59 ± 0.08a | 4.66 ± 0.13a | 4.64 ± 0.08a | 4.61 ± 0.06a | 4.87 ± 0.53a | 4.59 ± 0.08a | 4.66 ± 0.13a | 4.64 ± 0.08a | 4.61 ± 0.06a |
| 12th hour | 5.65 ± 0.15b | 3.73 ± 0.03a | 3.69 ± 0.12a | 3.65 ± 0.12a | 3.61 ± 0.10a | 5.78 ± 0.09b | 3.70 ± 0.15a | 3.32 ± 0.48a | 3.73 ± 0.09a | 3.66 ± 0.10a | |
| 24th hour | 6.71 ± 0.16c | 3.63 ± 0.08b | 2.65 ± 0.11a | 3.68 ± 0.05b | TFTC | 5.75 ± 0.09b | 2.68 ± 0.14a | TFTC | 2.77 ± 0.10a | TFTC | |
| LAB | 0 hour | NG | 5.63 ± 0.13a | 7.80 ± 0.14b | 5.68 ± 0.17a | 7.78 ± 0.13b | NG | 5.63 ± 0.13a | 7.80 ± 0.14b | 5.68 ± 0.17a | 7.78 ± 0.13b |
| 12th hour | TFTC | 6.47 ± 0.56a | 8.26 ± 0.64b | 6.78 ± 0.21a | 8.76 ± 0.15b | TFTC | 6.70 ± 0.11a | 7.65 ± 0.48b | 6.77 ± 0.21a | 8.29 ± 0.44a | |
| 24th hour | TFTC | 7.81 ± 0.11a | TMTC | 7.44 ± 0.51a | TMTC | TFTC | 7.82 ± 0.10a | 9.13 ± 0.19b | 8.45 ± 0.41 | 9.13 ± 0.08b | |
| TVC | 0 hour | 5.61 ± 0.04b | 4.62 ± 0.10a | 5.60 ± 0.10b | 5.64 ± 0.04b | 5.66 ± 0.06b | 5.61 ± 0.04b | 4.62 ± 0.10a | 5.60 ± 0.10b | 5.64 ± 0.04b | 5.66 ± 0.06b |
| 12th hour | 7.71 ± 0.13c | 3.68 ± 0.12a | 4.63 ± 0.12b | 4.67 ± 0.07b | 4.64 ± 0.08b | 6.71 ± 0.08b | 4.68 ± 0.08a | 4.70 ± 0.08a | 4.65 ± 0.09a | 4.63 ± 0.06a | |
| 24th hour | 8.88 ± 0.18d | 4.62 ± 0.13c | 3.62 ± 0.10b | 4.75 ± 0.08c | 3.56 ± 0.11b | 7.66 ± 0.10b | 3.75 ± 0.15a | 4.63 ± 0.13a | 3.71 ± 0.13a | 3.67 ± 0.13a | |
Table 3: Microbial load (log10 CFU/g) of tilapia gills after 24 hours of ambient and refrigeration storage temperatures.
| Type of the test | E. coli | Proteus vulgaris | Aeromonas hydrophila | Streptococcus pyrogene | Staphylococcus aureus |
|---|---|---|---|---|---|
| Gram staining | [-] | [-] | [-] | [+] | [+] |
| Shape | rods | rods | rods | cocci | cocci |
| Hemolysis | [-] | [-] | [+] | [+] | [+] |
| MacConkey | growth | growth | growth | no growth | no growth |
| Catalase | [+] | [+] | [+] | [-] | [+] |
| Oxidase | [-] | [-] | [+] | [-] | [-] |
| Motility | motile | extremely motile | motile | non motile | non motile |
| Mannitol | growth | no growth | growth | no growth | no growth |
| Urease | [-] | [+] | [-] | [-] | [+] |
| H2S | [-] | [+] | [+] | [-] | [-] |
| Gas | [+] | [+] | [+] | [-] | [-] |
| Glucose utilization | [+] | [+] | [+] | [+] | [+] |
| Lactose utilization | [+] | [-] | [+] | [+] | [+] |
| Sucrose utilization | [-/+] | [+] | [+] | [+] | [+] |
| O-F | Oxidative | Fermentative | Oxidative and Fermentative | Fermentative | Fermentative |
| References | (Zembro, et al.; Wogu and Maduakor; Talaiekhozani, et al.; Wanja, et al.) | (Markey, et al.; Chauhan, et al.; Talaiekhozani, et al.; Wanja, et al. ) | (Ruangpan and Tendencia,; Markey, et al.; Wanja, et al.) | ( Zembro, et al.; Markey, et al.; Wanja, et al.) | (Wogu and Maduakor, arkey, et al.) |
Table 4: Summary of the tests carried out for identification of bacterial isolates.
Antimicrobial inhibition of LAB strains: The antimicrobial sensitivity method was used to determine the ability of LAB strains to inhibit the growth of pathogenic bacteria. By growing them together (LAB strain and bacteria pathogen) in a petri dish, a clear zone of inhibition (ZOI) in mm diameter was determined after 24 hours of incubation. Lactococcus lactis subsp. lactis 1 exhibited the highest antimicrobial by 38.33 mm diameter against Staphylococcus aureus while strain O strongly inhibited Streptococcus pyrogene with 27.00 mm in diameter ZOI as shown in Table 5 and the pictures is shown in Table 13.
| Pathogen | Streptococcus pyrogene. | E-coli | Proteus vulgaris | Staphylococcus aureus | Aeromonas hydrophila. |
|---|---|---|---|---|---|
| Lb. paracasei spp. paracasei 3 | 27.00 ± 3.00b | 6.33 ± 5.51bc | 9.67 ± 0.58b | 7.00 ± 6.08ab | 0.73 ± 0.06a |
| Lc. lactis subsp. Lactis 1 | 6.33 ± 5.51a | 0.57 ± 0.49b | 11.33 ± 1.15b | 38.33 ± 2. 89c | 18.67 ± 3.21c |
Table 5: Sensitivity (mm diameter) of lactic acid bacteria against the pathogenic bacteria.
Antimicrobial inhibition of LAB strains: The antimicrobial sensitivity method was used to determine the ability of LAB strains to inhibit the growth of pathogenic bacteria. By growing them together (LAB strain and bacteria pathogen) in a petri dish, a clear zone of inhibition (ZOI) in mm diameter was determined after 24 hours of incubation. Lactococcus lactis subsp. lactis 1 exhibited the highest antimicrobial by 38.33 mm diameter against Staphylococcus aureus while strain O strongly inhibited Streptococcus pyrogene with 27.00 mm in diameter ZOI as shown in Table 5 and the pictures is shown in Table 13.
Physicochemical determination: The initial pH values of fresh farmed tilapia fish muscles ranged from 6.70 to 6.83 at ambient storage temperature (25℃) and after 12 hours of ambient and refrigeration storage, the pH began to rise from 6.47 to 6.63 (-log [H+] in untreated samples whereas, in treated samples, the pH continued to decrease throughout the study as shown in Figure 4. The lowest pH values of 6.10 (-log [H+]) was observed in sample D (5 log10 CFU/ml).

Figure 4: The pH presentation of tilapia muscles stored at ambient (top left) and refrigeration temperatures (top right), and tilapia gills at ambient (bottom left) and refrigeration (bottom right) storage temperatures after 24 hours of storage. A is untreated sample, B (5 log10 CFU/ml) and C (7 log10 CFU/ml) are samples both treated with Lactobacillus paracasei spp. paracasei 3 and D (5 log10 CFU/ml) and E (7 log10 CFU/ml) are samples both treated with Lactococcus lactis subsp. lactis 1.
On the other hand, the initial Titratable Acidity (TA) ranged from 0.51 ml/100 g to 0.63 ml/100 g and continued to increase in the treated samples in both storage temperatures and the results are presented in Figure 5.

Figure 5: The titratable acidity presentation of tilapia muscles stored at ambient (top left) and refrigeration temperatures (top right), and tilapia gills at ambient (bottom left) and refrigeration (bottom right) storage temperatures after 24 hours of storage. A is untreated sample, B (5 log10 CFU/ml) and C (7 log10 CFU/ml) are samples both treated with Lactobacillus paracasei spp. paracasei 3 and D (5 log10 CFU/ml) and E (7 log10 CFU/ml) are samples both treated with Lactococcus lactis subsp. lactis 1.
An inverse relationship was observed between pH and TA and pH fluctuations observed throughout the study at both temperatures explains the state of tilapia fresh fish in terms rigour-mortis phases as shown in (Figure 6).

Figure 6: The summary of the chemical changes taking place in the fresh fish muscle soon after death.
Biochemical determination: During the lipid peroxidation process, the TBARS compounds are formed when the produced pink complex pigment reacts with one mole of MDA and 2 moles of TBA with the elimination of 2 water molecules. The initial TBARS obtained in this study ranged from 0.69 mg–0.86 mg MDA/Kg and these results showed no significant difference (p<0.05) in TBARS among the tilapia muscles and gills in both storage temperatures. After 24 hours of storage sample B (tilapia gills) treated with Lactobacillus paracasei spp. paracasei 3 (5 log10 CFU/ml) increased TBARS from 0.69 mg–1.91 mg MDA/Kg at refrigeration as shown in (Table 6).
| Sample type | Storage time | Muscles (25℃) | Muscles (4℃) | Gills (25℃) | Gills (4℃) |
|---|---|---|---|---|---|
| Untreated | 0 hour | 0.73 ± 0.13a | 0.73 ± 0.13a | 0.86 ± 0.15a | 0.86 ± 0.15a |
| 24 hour | 3.60 ± 1.41b | 2.75 ± 0.85b | 3.72 ± 0.62b | 2.32 ± 0.27b | |
| Lb. 5 log10 CFU/ml | 0 hour | 0.70 ± 0.01a | 0.70 ± 0.01a | 0.69 ± 0.11a | 0.69 ± 0.11a |
| 24 hour | 0.63 ± 0.78a | 0.51 ± 0.24a | 1.91 ± 1.06ab | 1.45 ± 1.49a | |
| Lb. 7 log10 CFU/ml | 0 hour | 0.69 ± 0.34a | 0.69 ± 0.34a | 0.84 ± 0.10a | 0.84 ± 0.10a |
| 24 hour | 0.35 ± 0.19a | 1.00 ± 0.45a | 0.81 ± 0.20a | 0.46 ± 0.22a | |
| Lc. 5 log10 CFU/ml | 0 hour | 0.79 ± 0.21a | 0.79± 0.21a | 0.83 ± 0.13a | 0.83 ± 0.13a |
| 24 hour | 0.49 ± 0.19a | 0.63 ± 0.09a | 0.76 ± 0.20ab | 0.55 ± 0.17a | |
| Lc. 7 log10 CFU/ml | 0 hour | 0.74 ± 0.78a | 0.74 ± 0.78a | 0.85 ± 0.05a | 0.85 ± 0.05a |
| 24 hour | 0.39 ± 0.15a | 0.66 ± 0.12a | 0.85 ± 0.05a | 0.57 ± 0.16a |
Table 6: Thiobarbituric acid reactive substance (mg MDA/Kg) of tilapia muscle and gills stored at ambient and refrigeration temperatures.
Sensory evaluation
Quality Index (QI) analysis at ambient temperature: The calibration curve revealed a strong linear relationship (R2=0.9815) between the QI and the storage time at ambient temperature storage and similarly with tilapia stored at refrigeration temperature (R2=0.9946) as shown in Figure 7.

Figure 7: Calibration curve for QI scores at ambient temperature for 15 hours (left) and refrigeration storage for 27 hours (right).
The results showed that the QI of skin appearance, skin mucus, eye cornea, gills colour and gills smell had already gone beyond the freshness quality of 1.0 after 12 hours of ambient storage and 18 hours of refrigeration storage as shown in Tables 7 and 8, respectively.
| Storage time | 0 | 3 | 6 | 9 | 12 | 15 |
|---|---|---|---|---|---|---|
| Appearance | 0.02 ± 1.14a | 0.44 ± 0.51b | 0.76 ± 0.48c | 0.90 ± 0.3c | 1.16 ± 0.37d | 1.48 ± 0.51e |
| Skin scales | 0.00 ± 0.00a | 0.04 ± 0.2a | 0.36 ± 0.49b | 0.64 ± 0.49c | 0.94 ± 0.24d | 0.98 ± 0.14d |
| Skin mucus | 0.02 ± 0.14a | 0.26 ± 0.44b | 0.62 ± 0.49c | 0.92 ± 027d | 1.04 ± 0.45d | 1.28 ± 0.5e |
| Skin odour | 0.14 ± 0.35a | 0.58 ± 0.5b | 0.62 ± 0.5b | 0.62 ± 0.5b | 0.80 ± 0.57b | 1.28 ± 0.5c |
| Eye cornea | 0.00 ± 0.00a | 0.22 ± 0.41a | 0.78 ± 0.47b | 0.58 ± 0.5b | 1.10 ± 0.3c | 1.60 ± 0.78d |
| Eye form | 0.00 ± 0.00a | 0.42 ± 0.5b | 0.62 ± 0.49bc | 0.76 ± 0.43cd | 0.96 ± 0.28d | 1.08 ± 0.27e |
| Gills colour | 0.00 ± 0.00a | 0.16 ± 0.37ab | 0.38 ± 0.49bc | 0.46 ± 0.54c | 0.98 ± 0.32d | 1.38 ± 0.53e |
| Gills smell | 0.10 ± 0.3a | 0.46 ± 0.5bc | 0.32 ± 0.47ab | 0.62 ± 0.49c | 1.02 ± 0.25d | 1.26 ± 0.49d |
| Gills mucus | 0.06 ± 0.24a | 0.10 ± 0.3a | 0.54 ± 0.54b | 0.52 ± 0.51b | 0.72 ± 0.5b | 1.10 ± 0.58b |
| Texture-backside | 0.00 ± 0.00a | 0.16 ± 0.37a | 0.00 ± 0.00a | 0.46 ± 0.5b | 0.58 ± 0.5b | 0.54 ± 0.5b |
| Texture-belly | 0.00 ± 0.00a | 0.12 ± 0.33a | 0.00 ± 0.00a | 0.46 ± 0.5b | 0.46 ± 0.5b | 0.62 ± 0.49b |
Table 7: Average scores for each attribute of fresh tilapia fish at ambient temperature after 15 hours of storage.
| Storage time | 0 | 3 | 6 | 9 | 12 | 15 | 18 | 21 | 24 | 27 |
|---|---|---|---|---|---|---|---|---|---|---|
| Appearance | 0.00 ± 0.00a | 0.18 ± 0.37a | 0.48 ± 0.51b | 0.52 ± 0.51b | 0.52 ± 0.51b | 0.60 ± 0.5b | 1.12 ± 0.33c | 1.36 ± 0.49c | 1.46 ± 0.5d | 1.56 ± 0.5d |
| Skin scales | 0.00 ± 0.00a | 0.44 ± 0.50cd | 0.58 ± 0.5d | 0.26 ± 0.44b | 0.20 ± 0.4ab | 0.52 ± 0.51d | 0.94 ± 0.24e | 0.98 ± 0.14e | 0.90 ± 0.36e | 0.94 ± 0.24e |
| Skin mucus | 0.02 ± 0.14a | 0.10 ± 0.30a | 0.14 ± 0.35a | 0.58 ± 0.5b | 0.52 ± 0.51b | 0.72 ± 0.45c | 1.04 ± 0.45c | 1.28 ± 0.5cd | 1.36 ± 0.56d | 1.52 ± 0.61d |
| Skin odour | 0.08 ± 0.27a | 0.38 ± 0.49b | 0.64 ± 0.49bc | 0.74 ± 0.44c | 0.80 ± 0.4c | 0.86 ± 0.35dc | 0.92 ± 0.49d | 1.12 ± 0.44de | 1.30 ± 0.61ef | 1.54 ± 0.54f |
| Eye cornea | 0.02 ± 0.14a | 0.10 ± 0.3a | 0.52 ± 0.51b | 0.44 ± 0.5b | 0.52 ± 0.54b | 0.64 ± 0.53b | 1.10 ± 0.3c | 1.30 ± 0.58cd | 1.50 ± 0.61d | 1.92 ± 0.92e |
| Eye form | 0.00 ± 0.00a | 0.00 ± 0.00a | 0.50 ± 0.51b | 0.60 ± 0.57bc | 0.72 ± 0.5bcd | 0.78 ± 0.42c | 1.00 ± 0.20ef | 0.90 ± 0.42def | 1.08 ± 0.27f | 1.38 ± 0.49g |
| Gills colour | 0.02 ± 0.14a | 0.00 ± 0.00a | 0.00 ± 0.00a | 0.44 ± 0.5b | 0.80 ± 0.40c | 0.78 ± 0.42c | 0.98 ± 0.32c | 1.30 ± 0.46d | 1.54 ± 0.54de | 1.58 ± 0.4e |
| Gills smell | 0.14 ± 0.35a | 0.44 ± 0.5b | 0.54 ± 0.50bc | 0.74 ± 0.44cd | 0.94 ± 0.24d | 0.94 ± 0.24de | 1.02 ± 0.25ef | 1.14 ± 0.35efg | 1.24 ± 0.52fg | 1.34 ± 0.48g |
| Gills mucus | 0.00 ± 0.00a | 0.00 ± 0.00a | 0.08 ± 0.27a | 0.54 ± 0.5b | 0.72 ± 0.45b | 0.68 ± 0.47b | 0.80 ± 0.54bc | 1.06 ± 0.42c | 1.08 ± 0.57c | 1.50 ± 0.76d |
| T. backside | 0.00 ± 0.00a | 0.00 ± 0.00a | 0.10 ± 0.30a | 0.12 ± 0.33a | 0.28 ± 0.45ab | 0.48 ± 0.51bc | 0.58 ± 0.5c | 0.56 ± 0.5bc | 0.68 ± 0.62c | 1.08 ± 0.7d |
| Texture-belly | 0.00 ± 0.00a | 0.00 ± 0.00a | 0.00 ± 0.00a | 0.06 ± 0.24a | 0.10 ± 0.3a | 0.08 ± 0.27a | 0.40 ± 0.5b | 0.60 ± 0.5bc | 0.62 ± 0.49c | 0.62 ± 0.49c |
Table 8: Average scores for each attribute assessed with the QIM scheme of fresh tilapia fish stored in refrigeration (4℃).
The findings showed that fish characteristics deteriorate faster at higher temperatures (ambient) as storage duration increases from zero hour. At the 12th hour, the QI of the majority of the sensory attribute had exceeded the freshness limit of 1.0 at ambient and refrigeration storage, respectively as shown in (Tables 7 and 8).
The significant difference results obtained after 12 hours of ambient storage and 18 hours of refrigeration storage suggested that the loss of freshness quality of the sensory attributes revealed that the fresh farmed tilapia fish began to its spoilage at that time as summarized in Tables 7 and 8 respectively.
Nevertheless, the data were subjected to Principle Component Analysis (PCA) to show how storage time affected the sensory quality parameters and how these quality parameters were correlated. The total variance explained among the samples at the beginning of the experiment (zero hour) in PC1 (73.5%) and PC2 (11.9%) was 85.4%. After 15 hours of ambient storage, the total variance explained among the samples in PC1 and PC2 was 92.7%; Thus, PC1 explained 83.9% total variance whereas PC2 contributed with 8.8% whereas at refrigeration storage, the PCA was also performed where PC1 and PC2 were then selected and the total variance explained among the samples was 95.8%; Thus, PC1 explained 92.1% total variance whereas PC2 contributed with 3.7%. As summarized in the Bi-plot of correlation in (Figure 8).

Figure 8: Bi-plot of correlation of fresh farmed tilapia fish at ambient storage from zero hour (top left) to 15 hours (top right) of storage and at refrigeration storage from zero hour (bottom left) to 27 hours (bottom right). Sample 1 is untreated, sample 2 and 3 are both treated with Lactobacillus paracasei spp. paracasei 3 of inoculum 5 log10 CFU/ml and 7 log10 CFU/ml, and sample 4 and 5 are both treated with Lactococcus lactis subsp. lactis 1 of inoculum 5 log10 CFU/ml and 7 log10 CFU/ml.
The initial levels of TVC ranged from 3-6 log10 CFU/g of tilapia muscles was reported by and this were consistent with the study’s findings (Table 2). Reported the lowest values ranged from 2–3 log10 CFU/g in fresh tilapia fish muscle. Similarly, reported a 4 log10 CFU/g from whole fresh tilapia fish from L. Malawi. However, the results corroborated with findings that a freshly captured fish's bacterial load ranges from 3 to 5 log10 CFU/g on the skin surface, 4 to 6 log10 CFU/g in the gills, and 5 to 8 log10 CFU/g in the gut, respectively. The International Commission on Microbiological Specifications for Food (ICMSF) states 6 log10 CFU/g as a maximum microbial limit. This limit also agrees with Food and Drug Administration standards on fresh fish. On the contrary, Malawi Beaure of Standards recommends 5 log10 CFU/g as the limit level of TVC in frozen fish. The untreated samples exceeded the ICMSF's microbial limit after 12 hours at both storage temperatures. After 15 hours of ambient storage reported the TVC load ranges 5–7 log10 CFU/g and this concurred with those found in this study. Contamination and growth of microbial can take place during post-harvest handling, unhygienic storage conditions and temperature abuse. Also added that ambient temperature increases the growth and multiplication of pathogenic bacteria, hence careful handling of the fish immediately after capture is essential. Nevertheless, after 24 hours of storage, treated samples had the lowest microbial load of 2.67 log10 CFU/g and 3.51 log10 CFU/g in tilapia muscle and 3.56 log10 CFU/g in tilapia fish gills (Table 3) at ambient and refrigeration storage, respectively. The results also showed that the gills (untreated samples) attained the highest TVC compared to tilapia muscles after 24 hours of storage in both conditions. Similarly, the microbial load in tilapia gills were higher than in tilapia muscle of the treated samples. Lactobacillus paracasei spp. paracasei 3 (7 log10 CFU/g) managed to suppress the growth (TFTC) of E.coli and Streptococcus pyrogene. On the other hand, Lactococcus lactis subsp. lactis 1 (7 log10 CFU/g) suppressed the growth (TFTC) of coliforms, P. vulgaris and A. hydrophila after 24 hours of storage at ambient and refrigeration temperature, respectively. The freshness quality of the untreated fish was limited at 12 hours at ambient storage temperature and this is further supported by Gram (1990) who reported that bacteria in fish enter exponential growth phase soon after capture because microbial flora is already adapted to the environment (grow with doubling time) and can reach 7–8 log10 CFU/g within 24 hours at ambient storage. Physiologically Lactococcus lactis subsp. lactis 1 is homofermentative and survives at a wide temperature range (- 4°C to 53°C). Supported that the cell viability of Lactococcus lactis subsp. lactis 1 strain can reach from 4.7 log10 CFU/ml to 7.9 log10 CFU/ml, respectively after 3 hours of incubation. Additionally, it produces two moles of lactic acid from one mole of glucose and no wonder in this study it was more effective throughout the study than the counterpart.
The five isolated and identified pathogens in this study (Table 4) were consistent with those of who also isolated Streptococcus spp. (13.5%), aero Monas spp. (10.81%) and Staphylococcus spp. (24.32%), respectively. E. coli spp. (1.6%), Aero monas spp. (2.3%) and Proteus spp. (1.3%) from fresh tilapia gills and muscles. noted that three of the eleven isolates detected from tilapia fish; E. coli, Aero monas hydrophilic and Proteus vulgaris matched the findings of this study. The majority of these pathogens have been identified as the cause of fish death. This is also backed up by who discovered that Aeromonas spp. and Streptococcus spp. cause 15%–90% of tilapia mortality in aquaculture production systems.
The results in (Table 5) using Agar Disk Diffusion method (ADD) opposed those of, who reported 1.5 mm and 1.3 mm for E. coli and Aeromonas hydrophila, respectively using Lactococcus lactic subsp. lactic 1 from the Well Diffusion Method (WDM). Also found 8 mm, 7 mm, 9 mm and 7 mm against E. coli, Proteus, Staphylococcus aureus and Streptococcus spp., respectively. This is in contrast to, who found 13.4 mm on E. coli whereas, Lactococcus lactis subsp. lactis 2 in another study, showed 9.4 mm against E. coli which was greater than the study’s findings. According to, the sensitivity falls under four categories; greater than 20 mm indicates a very strong inhibition, 10–20 mm represents a strong inhibition, 5–10 mm represents a moderate inhibition and less than 5 mm represents a weak inhibition. Both strains were effective against the pathogens even though the weakest inhibition against E. coli (0.57 mm) and A. hydrophilic (0.73 mm) was found. Antimicrobial inhibition techniques and different strains used could account for the variances in ZOI.
The pH study according to, is a parameter that can be used to determine the level of freshness in fishery products. Live fish have a pH of around 7.0, which is similar to those obtained in this study which ranged from 6.64–6.83 (-log [H+]) indicating that the fish used in the experiment were in the early stages of rigour-mortis (Figure 4). This is supported by who reported that the average pH of the pre-rigour mortis phase ranges between 6.8–7.16. After 24 hours of storage, the lowest pH values was 6.00 and 5.93 (-log [H+]) in tilapia muscle and gills, respectively. This showed that there was more production of lactic acid in the tilapia gills than in the muscles. According to, blood cells in the gills contain little amount of glycogen which sustains the anaerobic respiration process for a short time. However, some of the energy comes from the liver which has the glycogen of 200– 300 times the glycogen of the gills and this supports the operation of the fish gills. The post-mortem pH (6.0–7.1) varies depending on the catching season, species, catching method, fish condition (fed or unfed), and stresses imposed on the fish during capturing. The pH drop in fish shortly after death as depicted in (Figure 6) was due to glycolysis an action of LAB caused the actin and myosin (act myosin) interconnectedness response, which contributes to the toughening and stiffening of the fish muscle. On the other hand, calcium ions (Ca+2) is released from the sarcoplasmic reticulum to participate in the stiffening and toughening (contraction) of the fish muscles to form the act myosin complexes. This reduces the autolytic and bacterial reactions in the fish that was the reason the treated samples had an extended shelf life in both storage conditions compared to the untreated samples. Once the reserved glycogen is used up, the pH rises again and this favors bacteria to resurface and start deteriorating the fish. The act myosin bonds in the muscles become less permanent and muscle relaxation reestablishes. This causes fish rotting processes to kick in right away and limit the freshness quality of the fish.
The lower initial TBARS values found in this study (Table 6) agreed with those reported by and, respectively. Additionally, and also reported the initial lower values of 0.08 mg MDA/Kg and 0.030 mg MDA/Kg, respectively from tilapia fresh fish fillet. However, after 24 hours of ambient storage, this study’s results did not agree with those published by. The initial lower values found in this study signify that the samples used were relatively fresh. The Egyptian Organization for Standardization (EOS), states that the maximum permissible amount of TBARS in fresh and frozen fish is 4.5 mg MDA/kg. On the contrary, reported 2 mg–2.5 mg MDA/Kg as the accepted limit and beyond that, a product develops rancidity. The Malawi Bureau of Standards (MBS) on the other hand, has no TBARS set standard on fresh and frozen fish in Malawi. In some treated samples the TBARS values found after 24 hours of storage were lower than those found at the beginning of the study, explained that MDA is an unsaturated aldehyde, a highly reactive compound and do react with TBA and other compounds. Nevertheless, the TBARS values found in this study in gills of untreated samples after 24 hours of storage were greater than 2.5 mg MDA/Kg and this suggested that the samples had developed rancidity. The use of LAB strains has demonstrated the ability to reduce lipid peroxidation in both treated samples. According to Lactococcus and Lactobacillus spp. have the ability to scavenge Hydroxyl radical (OH) during the initiation stage of lipid peroxidation. Additionally, LAB strains produce lactic acid which lowers the pH of the medium and inactivated lipoxygenase enzymes which stops the abstraction of a hydrogen atom from the methylene group of PUFA thereby reducing lipid oxidation.
The QIM scheme used in this study had a total quality index of 35 demerit points with 22 as a cutoff point for freshness quality (Table 2). According to, this suggested that the fish is pronounced spoiled when the total quality index above 22 is obtained after the highest scores for each descriptor is added together. The QIM developed by for L. Malawi fresh tilapia fish stored in the ice had 27 total demerit points and a cutoff quality index of 16. The QIM devised by for unmuted fresh farmed red tilapia fish stored in ice had an overall demerit point of 29 while that of had an overall of 19 demerit points. The variations could be due to the type of tilapia spp., culturing method (farmed or uncultured), storage temperature (ice or refrigeration) and fish portion (whole or filleted). The calibration curve (Figure 7) revealed a strong linear relationship between the QI and the storage time at ambient (R2=0.9815) temperature and refrigeration (R2=0.9946) storage temperatures. This was in agreement with the findings of who also discovered a strong linear relationship (R2=0.943) in a similar study. This result concurred with who found a reasonably strong linear relationship of 0.849 on fresh farmed tilapia fish stored at –1℃. However, a strong linear relationship of 0.944 of tilapia fish from L. Malawi stored in ice (0°C) was reported by. These correlation coefficient results show that the fish at higher temperatures degrade more quickly than those stored at lower temperatures.
The scores of the quality parameters found in this study increased linearly with the storage time (Tables 7 and 8). Stated that individual parameter depreciation plays a crucial role in depicting the sensory rejection of fish. The findings of this study corroborated those of who found the eye cornea, the gill appearance and mucus greatly influenced the shelf life of fish as their average quality index reached the cutoff point of 1 (22) at 12 hours and 18 hours of ambient and refrigeration storage, respectively. The demerit point scores of 2 and 3 attained by most of the sensory attributes after 12 hours and 18 hours of storage (Table 9) manifested the loss of freshness quality of tilapia of fish. This entails that fish samples (untreated) were rejected by the panelists at 12th and 18th hour of ambient (Table 10) and refrigeration storage (Table 11), respectively. The shelf life of samples treated with Lactobacillus paracasei spp. paracasei 3 were limited after 15 and 21 hours of ambient and refrigeration storage, respectively. This was in agreement with a shelf life ranging from 16 to 20 hours at ambient storage reported by. On the other hand, the shelf life of whole fresh farmed tilapia fish treated with Lactococcus lactis subsp. lactis 1 was extended from 12 hours at ambient and 18 hours at refrigeration storage temperatures, respectively and was still fresh at end of the study. This also agreed with who found that LAB application on tilapia fillet stored at 4°C extended the shelf life from the 24th hour of storage. Nevertheless, reported a shelf life of 10.5 days of whole fresh tilapia fish stored in ice. These variations are further backed up by who reported that storage temperature affects the viability of the LAB strain in prolonging the shelf life of the fish (Tables 12 and 13).
| Sensory attribute | 6 (25°C) | 9 (25°C) | 12 (25°C) | 15 (25°C) | 6 (4°C) | 9 (4°C) | 12 (4°C) | 15 (4°C) | 18 (4°C) | 21 (4°C) | 24 (4°C) | 27 (4°C) |
|---|---|---|---|---|---|---|---|---|---|---|---|---|
| Appearance | 1 | 2 | 2 | 2 | 1 | 1 | 1 | 1 | 2 | 2 | 2 | 2 |
| Skin scales | 1 | 1 | 1 | 1 | 1 | 1 | 1 | 1 | 1 | 1 | 1 | 2 |
| Skin mucus | 1 | 1 | 2 | 2 | 1 | 1 | 1 | 1 | 2 | 2 | 3 | 3 |
| Skin odour | 1 | 1 | 2 | 2 | 1 | 1 | 1 | 1 | 2 | 2 | 3 | 3 |
| Eye cornea | 1 | 2 | 2 | 3 | 1 | 1 | 2 | 2 | 2 | 2 | 3 | 3 |
| Eye form | 1 | 1 | 2 | 2 | 1 | 2 | 2 | 2 | 2 | 2 | 2 | 2 |
| Gills colour | 1 | 2 | 2 | 2 | 1 | 1 | 1 | 1 | 2 | 2 | 2 | 2 |
| Gills smell | 1 | 1 | 2 | 2 | 1 | 1 | 1 | 1 | 2 | 2 | 3 | 3 |
| Gills mucus | 1 | 2 | 2 | 3 | 1 | 1 | 1 | 1 | 2 | 2 | 2 | 3 |
| Texture backside | 1 | 1 | 1 | 2 | 1 | 1 | 1 | 1 | 1 | 1 | 2 | 2 |
| Texture belly | 1 | 1 | 1 | 1 | 1 | 1 | 1 | 1 | 1 | 1 | 1 | 1 |
The values in the bracket are the minimum demerit point score.
Table 9: The minimum and maximum demerit point’s scores of each parameter in ambient and refrigeration temperature storage.
| Sample type | 0 | 3 | 6 | 9 | 12 | 15 |
|---|---|---|---|---|---|---|
| Untreated | 0.027 ± 0.01a | 0.355 ± 0.04a | 0.463 ± 0.01a | 0.636 ± 0.03a | 1.082 ± 0.09a | 1.464 ± 0.01c |
| Lb. 5 log10 CFU/ml | 0.036 ± 0.00a | 0.145 ± 0.10a | 0.472 ± 0.05a | 0.645 ± 0.04a | 0.982 ± 0.03ab | 1.364 ± 0.02bc |
| Lb. 7 log10 CFU/ml | 0.045 ± 0.04a | 0.309 ± 0.05a | 0.391 ± 0.12a | 0.636 ± 0.05a | 0.891 ± 0.03ab | 1.264 ± 0.01b |
| Lc. 5 log10 CFU/ml | 0.027 ± 0.01a | 0.209 ± 0.14a | 0.50 ± 0.01a | 0.645 ± 0.02a | 0.80 ± 0.08ab | 0.891 ± 0.03aa |
| Lc. 7 log10 CFU/ml | 0.018 ± 0.03a | 0.327 ± 0.03a | 0.445 ± 0.06a | 0.591 ± 0.09a | 0.682 ± 0.14a | 0.745 ± 0.03a |
Table 10: Average QI score of fresh farmed tilapia fish stored a tambient temperature (25℃).
| Sample type | 3 | 6 | 9 | 12 | 15 | 18 | 21 | 24 | 27 |
|---|---|---|---|---|---|---|---|---|---|
| Untreated | 0.191 ± 0.14a | 0.382 ± 0.03a | 0.445 ± 0.01a | 0.564 ± 0.05a | 0.655 ± 0.08a | 1.09 ± 0.1b | 1.36 ± 0.04c | 1.47 ± 0.00c | 1.75 ± 0.04b |
| Lb. 5 log10 CFU/ml | 0.191 ± 0.14a | 0.409 ± 0.09a | 0.4 ± 0.03a | 0.564 ± 0.1a | 0.636 ± 0.03a | 1.0 ± 0.00b | 1.19 ± 0.01bc | 1.42 ± 0.05bc | 1.74 ± 0.04b |
| Lb. 7 log10 CFU/ml | 0.172 ± 0.17a | 0.373 ± 0.12a | 0.545 ± 0.1a | 0.582 ± 0.08a | 0.655 ± 0.05a | 0.891 ± 0.03ab | 1.12 ± 0.06b | 1.28 ± 0.06b | 1.6 ± 0.1b |
| Lc. 5 log10 CFU/ml | 0.118 ± 0.06a | 0.255 ± 0.05a | 0.455 ± 0.21a | 0.555 ± 0.09a | 0.655 ± 0.05a | 0.818 ± 0.1ab | 0.873 ± 0.03a | 0.891 ± 0.05a | 0.955 ± 0.01a |
| Lc. 7 log10 CFU/ml | 0.727 ± 1.03a | 0.209 ± 0.01a | 0.445 ± 0.04a | 0.5 ± 0.04a | 0.618 ± 0.05a | 0.7 ± 0.06a | 0.736 ± 0.06a | 0.736 ± 0.04a | 0.764 ± 0.00a |
Table 11: Average QI score of fresh farmed tilapia fish stored in refrigeration (4℃).
| Effect | Value | F | Hypothesis df | Error df | Sig. | Partial Eta Square |
|---|---|---|---|---|---|---|
| Inoculum level | 1.422 | 14.896 | 32 | 864 | 0 | 0.356 |
| Temperature | 0.178 | 5.764b | 8 | 213 | 0 | 0.178 |
| Fish portion | 0.459 | 22.622b | 8 | 213 | 0 | 0.459 |
| Temperature*Fish portion | 0.609 | 4.846 | 32 | 864 | 0 | 0.152 |
| Inoculum level*Fish portion | 0.523 | 4.057 | 32 | 864 | 0 | 0.131 |
| Temperature*Fish portion | 0.1 | 2.973b | 8 | 213 | 0.004 | 0.1 |
| Inoculum level*Temperature*fish portion | 0.409 | 3.076 | 32 | 864 | 0 | 0.102 |
*b=The exact statistics, MANOVA statistics test at p<0.05 (n=48)
Table 12: Multivariate analysis (MANOVA) for the interaction effect of independent factors on response variables (microbial load).
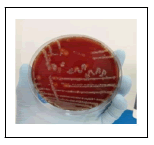
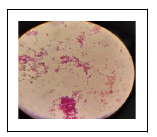
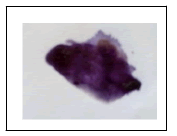
| Type of test | First photo | Second photo | Interpretation |
|---|---|---|---|
| LAB sensitivity | 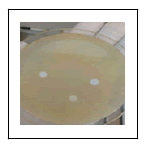 |
 |
Little or no sensitivity (first), high sensitivity (second) |
| Titratable acidity determination |  |
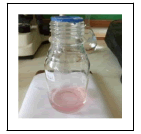 |
Pink colour indicates end point of titration for titration acidity |
| Hemolysis | 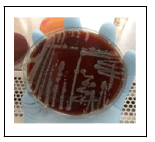 |
 |
Hemolysis (first) and non-hemolysis (second) |
| Gram staining | 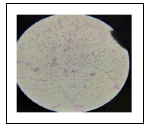 |
 |
Gram -ve (first) and gram +ve (second) categories of bacteria |
| Catalase | 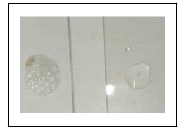 |
Both catalase positive (first) and catalase negative (second) | |
| Oxidase | 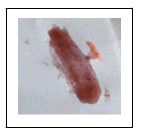 |
 |
Oxidase negative (first) and oxidase positive (second) |
| Sugar fermenter | 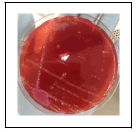 |
 |
Lactose fermenter (first) and mix both lactose and non-lactose fermenter (second) |
| Oxidative fermentative test (O-F) | 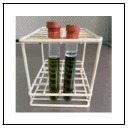 |
 |
O-F before test (first) and O-F positive (second) |
| Motility test TSI-agar |  |
 |
Motile or too motile thus positive to motility (flagellates). Gas production. H2S. |
| TBA analysis |  |
 |
TBA standards preparation (first) and TBA chromogen (pink) formation (second) |
 |
 |
Table 13: Pictorial summary of biochemical tests (microbial) and TBA on fresh farmed tilapia fish.
The Bi-plot in (Figure 8), further explained the variations among the samples stored at both temperatures. The total variance explained was 85.4% among the samples at the beginning of the experiment (zero hours). In PC1 and PC2, the total variance explained was 92.7% and 95.8% after 15 and 27 hours of ambient and refrigeration storage, respectively. This indicated that there was a positive correlation between the storage time and the sensory parameters, according to. The Bi-plot after 15 hours of ambient storage shows the first axis separating between sample groups 1, 2 and 3 on one side versus sample groups 4 and 5 on the other side. The untreated sample 1 was characterized by skin colour, skin appearance, eye cornea and gills smell. Sample 2 and 3 both treated by Lactobacillus paracasei spp. paracasei 3 with inoculum level 5 log10 CFU/ml and 7 log10 CFU/ml, respectively were characterized by the skin mucus, gills colour, gills mucus, texture backside and texture backside. These attributes contributed to the total average cutoff point of greater than 1. On the other hand, the sample treated with Lactococcus lactis subsp. lactis 1 with inoculum level 5 log 10 CFU/ml and 7 log 10 CFU/ml (samples 4 and 5), respectively were also split in the second axis indicating that they were different based on inoculum level. Additionally, they were not characterized by the attributes and their average total quality index were less than 1 indicating that they were still fresh after 15 hours of ambient storage and this was similar to samples treated with the same LAB strain after 27 hours of refrigeration storage. According to, this describes that the panelists was in good agreement during the assessment of fresh farmed tilapia fish and they detected the differences of each sample from the other (Tables 9-11).
The findings in this study revealed that samples treated with Lactococcus lactis spp. lactis 1 extended the shelf life of fresh farmed tilapia fish from 12 hours and 18 hours at ambient and refrigeration storage, respectively. This indicated that temperature and the use of LAB culture cause significant changes in microbial quality and microbial safety of farmed tilapia fish. The study also demonstrated that Lactococcus lactis spp. lactis 1 strain showed the highest antimicrobial activity in fighting against fish pathogens such as against Staphylococcus aurous, Proteus vulgaris and Aero monas hydrophilic pathogens as compared to the counterpart Lactobacillus paracasei spp. piracies 3. The lipid peroxidation study further demonstrated the ability of Lactococcus lactic subsp. lactis 1 in reducing fish deterioration through lipid oxidation in both storage temperatures contrary to Lactobacillus lactic piracies spp. piracies 3 (5 log10 CFU/ml) had higher TBARS (>1) at the end of the study. The study also demonstrated through sensory evaluation that with proper handling and storage of fresh farmed tilapia fish at both temperatures can remain fresh and safe for consumption up to 12 hours and 18 hours, respectively. Nevertheless, the study showed that the use of lactic acid bacteria culture as a bio preservative agent can extend the shelf life of fresh farmed tilapia fish from 12–15 hours at ambient storage and 18–27 hours at refrigeration storage. This study has demonstrated through microbiological, biochemical and sensory evaluation methods that fish farmers and fish itinerant traders can maintain the shelf life of their fish catch during distribution to the outlets for up to 15 hours and 27 hours of ambient and refrigeration, respectively if the use of LAB culture is adopted and utilized.
The antimicrobial property may be due to the production of lactic acid, hydrogen peroxide (H2O2) and carbon dioxide. Further study should be conducted to determine the production of hydrogen peroxide (H2O2) of the sample treated with lactic acid bacteria strains. Further research should focus on combining the quality index method tool with instrumental devices such as texture meters, electronic nose, colour meters, image analyzer and spectroscopic. This recommendation is suggested because of the QIM method which subjective to human error and also dependent on the experience of the panelist. Future studies should be conducted on consumer acceptance of fresh fish preserved in lactic acid bacteria cultures.
TL gathered data collection and writing of the manuscript. TNM and FK structured and supervised the research and TL reviewed the manuscript.
The authors hereby declaring that they have no conflict of interests.
The research was conducted with partial financial support from the Africa Centre of Excellence (ACE).
Citation: Lowore T, Manani TN, Kapute F (2022) Microbial, Sensory and Biochemical Properties of Fresh Farmed Tilapia Fish Preserved in Lactic Acid Bacteria Culture. J Nutr Food Sci. 12:871.
Received: 11-Apr-2022, Manuscript No. JNFS-22-16666; Editor assigned: 13-Apr-2022, Pre QC No. JNFS-22-16666(PQ); Reviewed: 27-Apr-2022, QC No. JNFS-22-16666; Revised: 13-Jun-2022, Manuscript No. JNFS-22-16666(R); Published: 20-Jun-2022 , DOI: DOI: 10.35248/2155-9600.22.12.871
Copyright: © 2022 Lowore T, et al. This is an open-access article distributed under the terms of the Creative Commons Attribution License, which permits unrestricted use, distribution, and reproduction in any medium, provided the original author and source are credited.