Journal of Nutrition & Food Sciences
Open Access
ISSN: 2155-9600
ISSN: 2155-9600
Research Article - (2017) Volume 7, Issue 6
A study was under taken for extraction and optimization of biocolour extracted from Ratanjyot and its acceptance in toffees. The optimization of extracting condition for extracted colour was done by using response surface methodology (RSM). The optimum time and temperature for the extraction of dye was obtained as 112 min and 38.8°C. The average particle size of powdered Ratanjyot was 0.1655 mm. The biocolour was extracted by using hexane as solvent. Then, four samples of toffees (C, S1, S2 and S3) were prepared by incorporating different concentration of Ratanjyot colour. The pH, fat, browning index, reducing sugars and total sugars were increased with increasing concentration of biocolour at fresh level. Hardness and stickness was also increased. The moisture content of all the samples decreased with increasing concentration. L* and b* values of samples were decreased and a* values ware increased with increasing concentration of biocolour at fresh level. The overall acceptability of samples S2 was found maximum at fresh level. Samples, S2 (1.2 ml of Ratanjyot colour in 222 g of toffees) was the best product with all medicinal properties of honey and Ratanjyot colour.
Keywords: Extraction; Natural colours; Ratanjyot; Toffees
Ratanjyot (Arnebia nobillis) plant is imported to India from Afghanistan and sold under trade name Ratanjyot. Some varieties of this plant are available in the Indian market also. The roots of this plant have come into prominence because of their anticancer and anti-tumor property. These are also used as an antiseptic in the veterinary medicine [1]. The roots of this plant are imported from Afghanistan and does not find in India nor is there any record of its introduction. However, an air-dried market sample yielded 2.5% of a very crude viscous red dye, which on analysis gave seven naphthaquinones designated as Arnebins and identified as:
• Arnebin-1 (alkannin β, β-dimethylate; yield, 0.375%),
• Arnebin-2 (β, β-dimethylacrylic ester of hydroxyl alkannin; yield: 0.047%),
• Arnebin-3 (alkannin acetate; yield: 0.075%),
• Arnebin-4 (alkannin),
• Arnebin-5 (C16H18O5, melting point (mp): 111-112°C),
• Arnebin-6 (C18H20O7, mp-88-90°C),
• Arnebin-7 [5, 8-dihydroxy-2 (4’methylpent-3’-enyl)-1-4- naphathaquinone].
The roots also contain a wax (C53H106O2, mp-82°C), hexacosanal, heptacosanic acid and sitosterol. Ratanjyot is popular in Asian countries for imparting a pleasing red colour to foodstuffs, oils, fat and medicinal preparations. Arnebins-all the seven possess antibacterial activity against gram positive bacteria and antifungal activity against candida albicans in varying degrees; Arnebin-2, being the most potent, is also used medicinally for enlarged liver and expulsion of the worms and is applied to wounds, sores and burns [1].
The toffees are a popular and highly acceptable confectionery liked by almost all age groups as a snack for quick energy. The toffee can be better utilized as a vehicle to promote consumption and utilization of fruits that have otherwise less market demand and quite limited shelf life [2]. Colour in one form or another has been added to our foods for centuries. It is known that the Egyptians coloured candy and wine were coloured as long as 400 BC [3]. Colour of a food can play a profound role in flavour perception [4]. Food colors can be grouped divided into four categories: a. natural colors, b. nature-identical colors, c. synthetic colors and d. inorganic colors [5,6]. However, synthetic colours are hardly nutrient and have been blamed for toxic to different extents and some are found to be carcinogenic [7]. Currently pigments of various kinds and forms have been used as additives or supplements in food industries, cosmetics, pharmaceuticals, livestock feed and other applications [8].
The investment in natural food colour market across the globe has touched to US $ 1 billion and is continuously growing as there is demand for natural food colours against synthetic food colours [9]. Because of consumer’s choice for natural food processing industry and have contributed to the increase in natural colour market significantly [10]. They are non-toxic and non-allergic. It has soothing effect and aesthetic value. These also have some medicinal properties. The present study attempts to solve problems of synthetic colours in food. Several studies have been carried out in the area of natural colours. The present study “Extraction and Optimization of Natural Colour from Ratanjyot, Its Application and Acceptance in Toffees” can be considered to be in series with previous studies. The specific objective of the study was optimization of extraction parameter of biocolour from Ratanjyot and to observe the effect of Ratanjyot colour for physiochemical, microbiological, textural and sensory characteristic on the product.
Initially Ratanjyot was dried and finely ground; performed sieve analysis and then colour was extracted from it with the help of soxhlet apparatus. The optimization of the extracted colour was done using software Design Expert®. Chromatographic analysis, anti-bacterial and antifungal property analysis was then evaluated for the extracted biocolour. After that this biocolor was applied in the honey based toffee.
The samples of toffees were made by taking the different concentration of Ratanjyot colorant.
• Without Ratanjyot colour, as control sample (C)
• With 3 ml of 10% standard Ratanjyot colour solution in 1 kg toffees (S1)
• With 6 ml of 10% standard Ratanjyot colour solution in 1 kg toffees (S2)
• With 9 ml of 10% standard Ratanjyot colour solution in 1 kg toffees (S3)
The studies were carried out to measure the changes in the following parameter during storage period (60 days): colour value (L* a* b* parameter) by Hunter Lab, total plate count (TPC), pH, fat content, moisture content, browning index, sugars and textural analysis.
Materials
Ratanjyot, honey, milk powder, hydrogenated vegetable oil (HVO), packaging materials were used during study. During procurement of honey, it must be kept in mind that it should not be stored from long period of time because darkening in colour of honey is one of the major changes that occurs during storage [11]. It is quality wise important parameter as it affects the colour of finished toffees.
Methods
Extraction of colour from Ratanjyot: Ratanjyot was purchased from the local market of Aligarh and then dried in hot air oven at 60°C for at least 2 h. After removal of moisture, it was ground with the help of mechanical mixer and converted it into powdered form. Then, its 15 g was taken in a filter paper and tied up and then put in thimble of soxhlet apparatus. After this apparatus was run for 2-3 h and the colour was extracted with help of hexane (110 ml), as solvent. The amount of extracted colour is affected by the temperature and time of extraction. Then this extracted oil based colour was mixed with oil to make standard colour solution for application when needed. The entire experimental studies were carried out in the department of Post- Harvest Engineering and Technology, Faculty of Agricultural Sciences, AMU, Aligarh, India.
Figure 1 shows the extraction of biocolour from Ratanjyot.

Figure 1: The flow chart for the extraction of biocolour from Ratanjyot.
Product development (Honey toffees): The Ratanjyot colour extracted from the root of Ratanjyot plant was used as colourant in honey based toffees. The methodology for preparation of toffees (on 1 kg basis) is shown in Figure 2.

Figure 2: Flow sheet for the preparation of biocoloured toffees.
Determination of biocolour characteristics and physico-chemical properties of toffees
Determination of particle size: The size was measured by the standard screen analysis [12].
The average particle was determined by using the formula as given below:
| Ds | = |  |
(1) |
Where, xi=Mass fraction retained,
Dpi=Average particle diameter in cm,
Ds=Volume surface mean diameter.
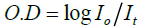
Optical density/Absorbance: Mathematically, O. D. of the medium is given by formula
 (2)
(2)
Where, It =Intensity of the incident light
It =Intensity of light transmitted through the medium
Optimization of time and temperature of biocolour extracted from ratanjyot by using response surface methodology (RSM): The graph is drawn on the basis of mathematical relationship.
 (3)
(3)
Where, Y=dependent variable; X1 and X2 are independent variables.
The optimum values for independent variables are obtained from the equation (3) as
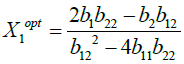 (4)
(4)
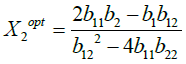 (5)
(5)
The value of the response function under this condition is
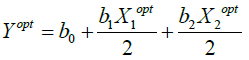 (6)
(6)
Separation of different components of biocolour extracted from Ratanjyot: Different component of colour was separated by thin layer chromatography technique [13].
Moisture content: Moisture content of toffee was determined by hot air oven method as recommended by as Ranganna [14].
 (7)
(7)
Determination of browning index: Browning index of toffee was determined by method recommended by Srivastava and Kumar [15].
Evaluation of sensory characteristics: Sensory attributes including colour, texture, flavour, taste and buying intention of toffee were evaluated by Hedonic Ratting Test as recommended by Ranganna [14].
Optimization of biocolour extraction from Ratanjyot
Effect of particle size on the yield of the Ratanjyot colour: The particle size determined was volume surface mean diameter, which was determined by using equation 1. It is evident from the analysis of data obtained by screen analysis presented in Table 1, that the average particle size of powdered Ratanjyot is 0.1655 mm.
| Mesh (BSS) | Opening (mm) | Dp (mm) | Amount (g) |
|---|---|---|---|
| 16 | 0.991 | - | |
| 18 | 0.937 | 0.964 | 5.8 |
| 36 | 0.42 | 0.6785 | 101.4 |
| 70 | 0.2105 | 0.31525 | 203.3 |
| 72 | 0.1915 | 0.201 | 1.5 |
| 85 | 0.1675 | 0.1795 | 0.6 |
| PAN | 0.08375 | 182.7 | |
| Total | 495.3 |
Table 1: Sieve analysis data for powdered Ratanjyot.
Determination of λmax from absorbance of the Ratanjyot colour: The plot between the absorbance and the wavelength as shown in the Figure 3 shows that the maximum absorption wave length, λmax for the Ratanjyot colour was 490 nm.

Figure 3: Graph between absorbance vs. wavelength.
Effect of particle size of powdered Ratanjyot on the absorbance of the colour: Table 2 shows that the optimum particle size which yielded maximum Ratanjyot colour was less than 0.179 mm.
| Particle size (mm) | Absorbance |
|---|---|
| 0.6785 | 1.28 |
| 0.3152 | 1.42 |
| Less than 0.1795 | 1.58 |
Table 2: Change in absorbance of Ratanjyot colour with particle size.
Optimization of time and temperature for the extraction of colour from Ratanjyot: The extraction of colour from the ground material depends on the particle size, as the time required by the leaching agent would be smaller for the smaller particle sizes. In addition to the particle size, other factors influencing the extraction of dye is time for which Ratanjyot was in contact with the leaching solvent. The temperature plays important role, in the leaching of the colour from Ratanjyot, but care must be taken so as to avoid the burning or otherwise change in the chemical composition of the colour being extracted will occur. The optimization of the extraction factor; time and temperature was determined by using response surface methods.
The data presented in Table 3 showed that the value for the amount of biocolour obtained from extraction varies from 335 mg to 584 mg per 15 g of the powdered Ratanjyot.
| Std | Run | Point type | Temperature (°C) |
Time (sec) |
Amount of extracted dye (mg) |
|---|---|---|---|---|---|
| 1 | 10 | Fact | 20 | 60 | 335 |
| 2 | 9 | Fact | 50 | 60 | 386 |
| 3 | 8 | Fact | 20 | 120 | 418 |
| 4 | 2 | Fact | 50 | 120 | 498 |
| 5 | 7 | Axial | 20 | 90 | 348 |
| 6 | 11 | Axial | 50 | 90 | 517 |
| 7 | 3 | Axial | 35 | 60 | 515 |
| 8 | 12 | Axial | 35 | 120 | 517 |
| 9 | 4 | Center | 35 | 90 | 510 |
| 10 | 6 | Center | 35 | 90 | 535 |
| 11 | 1 | Center | 35 | 90 | 520 |
| 12 | 13 | Center | 35 | 90 | 555 |
| 13 | 5 | Center | 35 | 90 | 584 |
Table 3: Amount of biocolour obtained for combination of different time and temperature.
Table 4 showed that the quadratic model for the extraction of dye was significant at p ≤ 0.05. The linear term of temperature was significant only at p ≤ 0.05. However, quadratic term of temperature showed significance at p ≤ 0.01. But, their interaction term showed no significance at any level. The regression coefficients and the regression equation are as given below.
| Source | Sum of squares | df | Mean square | F-Value |
|---|---|---|---|---|
| Model | 67286.4 | 5 | 13457.28 | 9.331179* |
| A-Temperature | 15000 | 1 | 15000 | 10.40089* |
| B-Time | 6468.167 | 1 | 6468.167 | 4.484979 |
| AB | 210.25 | 1 | 210.25 | 0.145786 |
| A2 | 31947.98 | 1 | 31947.98 | 22.1525** |
| B2 | 1597.722 | 1 | 1597.722 | 1.107848 |
| Residual | 10095.29 | 7 | 1442.184 | |
| Lack of Fit | 6612.49 | 3 | 2204.163 | 2.531484 |
| Pure Error | 3482.8 | 4 | 870.7 | |
| R2 | 0.8695 |
Significance: ** (p ≤ 0.01); * (p ≤ 0.05)
Table 4: ANOVA for the biocolour extracted from Ratanjyot.
Exraction of dye=-425.855+35.344 * Temperature+5.341 * Time+0.016 * Temperature * Time-0.478 * Temperature2-0.026 * Time2
Figure 4 showed the contour and 3D plot for the amount of the extracted dye and the factors influencing i.e. time and temperature. Starting from the centre point (time=90 min; temp=35°C) the amount of the extracted dye is 540.59 mg but as the temperature is increased to 50°C and decreased to 20°C; it decreases to 483.03 mg and 383.03 mg respectively. But for the same temperature the amount of the extracted dye remains almost same for the variation in the time for the extraction.

Figure 4: Contour and response surface plots, showing the dependency of the response variables (amount of the extracted dye) on extraction time and extraction temperature.
However, the optimum time and temperature for the extraction came to be as follows:
| Temperature (°C) | Time (min) | Amont of the exracted dye (mg) | Desirability |
|---|---|---|---|
| 38.85 | 111.60 | 558.846 | 0.899 |
It is evident from the chromatographic analysis that the three clear spots were detected by naked eyes on developing plate when separated the Ratanjyot colour with the help of mixture of chloroform and petroleum ether (ratio: 1:2). For the identification of the colourless spot this plate was put in a chamber containing iodine. The fluorescence produced by iodine make visible the colourless spots also. Finally three clear spots of different component were distinctly visible. Developed plates are shown in (Plate 1). It means that extracted Ratanjyot colour is not a single compound and it is a mixture of three compounds. Number of separated components is dependent on the polarity of developing solvent.

Plate 1: Developed chromatographic plates for the analysis of Ratanjyot colour.
Analysis of antibacterial and antifungal studies of Ratanjyot colour
It is evident from the analysis of the well diffusion method that the extracted dye does not show any activity against E. coli at any concentration but it is effective against Bacillus and Candida. In case of Bacillus the maximum size of zone of inhibition is obtained at the maximum concentration (10%) of colour and vice versa. The same type of result was obtained in case of Candida (Plate 2).

Plate 2: Plates showing antifungal and antibacterial characteristic of Ratanjyot dye.
Effect of biocolour levels on physicochemical characteristics of fresh toffees
Effect of biocolour levels on pH: The average pH of control and biocoloured toffees having codes C, S1, S2 and S3 were found to be 6.46, 6.56, 6.63 and 6.66, respectively. The pH of samples increases because of acidic nature of extracted colour.
Regression analysis of data obtained for pH indicates that the pH increases linearly with the level of biocolour. R2 value for this analysis was 0.9523. Regression of pH is presented in Figure 5.

Figure 5: Effect of colour concentration on pH of biocoloured toffees.
Effect of biocolour levels on moisture content: It is evident from the analysis of data obtained that the average moisture content of samples decreased as the ratio of biocolour was increased in the samples. The average moisture contents of the control and biocoloured toffees having codes C, S1, S2 and S3 were recorded as 5.829%, 5.66%, 5.59% and 5.407%, respectively. Regression analysis of data obtained for moisture content indicated that the moisture content decreased linearly with the level of biocolour. R2 value for this analysis was 0.968 Figure 6

Figure 6: Effect of colour concentration on moisture content of biocoloured toffees.
Effect of biocolour levels on fat content: Effects of biocolour level on fat content of toffees have been presented in Figure 7. The average fat content of control and bio coloured toffees having codes C, S1, S2 and S3 were recorded as 9.23%, 9.34%, 9.46% and 9.55%. Results of the study indicated that the fat content of the samples increased slightly with the increase in biocolour concentration into honey based toffees. The average browning index of biocoloured toffees having codes C, S1, S2 and S3 were found to be 0.209, 0.236, 0.275 and 0.296, respectively. Increase of browning index was because of inherent dark red colour of Ratanjyot. The samples having higher amount of biocolour evidently would have higher browning index. Browning index of toffees was found to have correlation with biocolour concentration best fitted to linear form and it was having R2 value 0.9881 Figure 8.

Figure 7: Effect of colour concentration on fat content of biocoloured toffees.

Figure 8: Effect of colour concentration on browning index of biocoloured toffees.
Effect of biocolour levels on reducing sugars: Reducing sugar of biocoloured toffees were observed to be higher for those prepared with higher proportion of biocolour. The effects of biocolour level on reducing sugar of toffees have been presented in Figure 9.

Figure 9: Effect of colour concentration on reducing sugars of biocoloured toffees.
Effect of biocolour levels on sensory characteristics of fresh toffees: Average scores for all different characteristics like colour, flavour, texture, taste, buying intension and OAA are represented in Figure 10. The maximum score for average colour was observed for sample S2. Scores obtained for flavour and taste were almost same for all samples. In case of texture the maximum points awarded to sample S3. This result showed that the texture of toffees improved with increasing concentration of biocolour.

Figure 10: Sensory scores for different samples of biocoloured toffees.
Effect of biocolour levels on colour value: Colour measurement of control and colour (Ratanjyot) treated toffees were carried out by Hunter Lab. This is 3-dimensional space which helps to calculate the L* a* b* parameters of colour. L* indicates lightness/darkness (100-0), a* indicates the redness with positive value and greenness with negative value and b* describes the shade varying from yellow to blue colour for positive to negative value respectively.
Figure 11 presents the colour values of treated and untreated biocoloured toffees. L* value was found to have decreased by increasing the concentration of colour. The L* value of control and biocoloured toffees having code C, S1, S2 and S3 were recorded as 43.98, 39.09, 32.46 and 30.29, respectively. From these values it can be concluded that biocoloured toffees became darker with increasing concentration of colour.

Figure 11: Effect of colour concentration on L*a*b* values of biocoloured toffees.
Storage studies on control sample and biocoloured toffees
Effect of storage on pH: Results of the study indicated that the pH of all the samples of biocoloured toffees decreased as the storage period increased. The decrease in pH content during storage may be because of formation of acid during storage. Statistical analysis indicated that effect of storage period on pH of biocoloured toffees was significant at 5% and 1% level of confidence (Table 5). From 0 to 60 days of storage, pH differs significantly at 5% and 1% level of confidence.
| Source | df | SS | MSS | F-Value | F Table 5% | F Table 1% |
|---|---|---|---|---|---|---|
| Replication | 2 | 0.0023333 | 0.001166667 | |||
| Storage (P) | 4 | 0.7323333 | 0.183083333 | 48.202079 | 2.626 | 3.868 |
| Treatment (T) | 3 | 0.6113333 | 0.203777778 | 53.6505 | 2.856 | 4.35 |
| PXT | 12 | 0.017 | 0.001416667 | 0.3729792 | 2.018 | 2.696 |
| Error | 38 | 0.1443333 | 0.003798246 | |||
| Total | 59 | 1.5073333 | ||||
| CD 5% | CD 1% | |||||
| P= | 0.0457012 | P= | 0.06134607 | |||
| T= | 0.0510955 | T= | 0.068586991 | |||
Table 5: ANOVA for the pH.
Effect of storage on moisture content: It was evident from the data obtained that the moisture content of all samples increased gradually as the storage period was increased. Table 6 indicated that the effect of storage period on moisture content of biocoloured toffees was significant (at tabulated value of 5% and 1% level of confidence).
| Source | df | SS | MSS | F-Value | F Table 5% | F Table % |
|---|---|---|---|---|---|---|
| Replication | 2 | 0.0273099 | 0.013655 | |||
| Storage (P) | 4 | 80.635608 | 20.158902 | 1706.0306 | 2.626 | 3.868 |
| Treatment(T) | 3 | 1.7671836 | 0.5890612 | 49.851744 | 2.856 | 4.35 |
| PXT | 12 | 0.3298195 | 0.027485 | 2.3260287 | 2.018 | 2.696 |
| Error | 38 | 0.4490179 | 0.0118163 | |||
| Total | 59 | 83.208939 | ||||
| CD 5% | CD 1% | |||||
| P= | 0.0806077 | P= | 0.108202 | |||
| T= | 0.0901222 | T= | 0.1209735 | |||
Table 6: ANOVA for the moisture content.
Effect of storage on fat content: Result of the study indicated that the fat content of the toffees decreased as the storage period was increased. Fat content in the sample were mainly because of milk powder and HVO in biocoloured toffees. Statistical analysis indicates that effect of storage period on fat content of biocoloured toffees was significant at 5% and 1% level of confidence (Table 7).
| Source | df | SS | MSS | F-Value | F Table 5% | F Table 1% |
|---|---|---|---|---|---|---|
| Replication | 2 | 0.0017733 | 0.0008867 | |||
| Storage (P) | 4 | 129.82076 | 32.455189 | 56504.147 | 2.626 | 3.868 |
| Treatment (T) | 3 | 0.7322733 | 0.2440911 | 424.96009 | 2.856 | 4.35 |
| PXT | 12 | 0.0194433 | 0.0016203 | 2.8208868 | 2.018 | 2.696 |
| Error | 38 | 0.0218267 | 0.0005744 | |||
| Total | 59 | 130.59607 | ||||
| CD 5% | 2.0308 | CD 1% | 2.726 | |||
| P= | 0.0177721 | P= | 0.023856 | |||
| T= | 0.0198698 | T= | 0.0266718 | |||
Table 7: ANOVA for the fat content.
Effect of storage on browning index: It was evident from the data obtained that browning index for all the samples increased gradually with increased storage period. Statistical analysis showed that the change in browning index during storage was significant at 5% but insignificant at 1% level of confidence (Table 8).
| Source | df | SS | MSS | F-Value | F Table 5% | F Table 1% |
|---|---|---|---|---|---|---|
| Replication | 2 | 1.433E-06 | 7.167E-07 | |||
| Storage (P) | 4 | 2.0965307 | 0.5241327 | 318333.12 | 2.626 | 3.868 |
| Treatment (T) | 3 | 0.6058126 | 0.2019375 | 122647.19 | 2.856 | 4.35 |
| PXT | 12 | 0.1100957 | 0.0091746 | 5572.2367 | 2.018 | 2.696 |
| Error | 38 | 6.257E-05 | 1.646E-06 | |||
| Total | 59 | 2.812503 | ||||
| CD 5% | 2.0308 | CD 1% | 2.726 | |||
| P= | 0.0009515 | P= | 0.0012772 | |||
| T= | 0.0010638 | T= | 0.001428 | |||
Table 8: ANOVA for the browning index.
Effect of storage on reducing sugars: Results of the study indicated that the reducing sugar of all samples of toffees increased progressively during storage. The reducing sugar of biocoloured toffees increased significantly in all consecutive days of studies. From zero to sixty days of storage, reducing sugar increased significantly also at 5% and 1% level of confidence (Table 9).
| Source | df | SS | MSS | F-Value | F Table 5% | F Table 1% |
|---|---|---|---|---|---|---|
| Replication | 2 | 0.0349456 | 0.0174728 | |||
| Storage (P) | 4 | 98.121864 | 24.530466 | 1155.8454 | 2.626 | 3.868 |
| Treatment (T) | 3 | 2.1015235 | 0.7005078 | 33.007068 | 2.856 | 4.35 |
| PXT | 12 | 0.1440854 | 0.0120071 | 0.5657604 | 2.018 | 2.696 |
| Error | 38 | 0.8064726 | 0.021223 | |||
| Total | 59 | 101.20889 | ||||
| CD 5% | 2.0308 | CD 1% | 2.726 | |||
| P= | 0.1080288 | P= | 0.1450101 | |||
| T= | 0.1207799 | T= | 0.1621262 | |||
Table 9: ANOVA for the reducing sugars.
Effect of storage on sensory characteristics of biocoloured toffees: Sensory score for fresh as well as stored samples of all samples of biocoloured toffees have been reported in Table 10. Results of the study revealed that during storage sensory quality decreased. In general, however, they are rated in the same class of sensory quality i.e. ‘liked very much’ to ‘liked slightly’ except in last 15 days, during two months of storage.
| Storage period (days) | Sensory characteristics | Samples | |||
|---|---|---|---|---|---|
| C | S1 | S2 | S3 | ||
| 0 | Avg. Colour | 7.8 ± 0.836 | 8 ± 0.707 | 8.6 ± 0.547 | 7.8 ± 0.836 |
| Avg. Flavour | 8 ± 0.707 | 8.2 ± 0.447 | 8.2 ± 0.447 | 8.2 ± 0.447 | |
| Avg. Texture | 7.4 ± 0.547 | 7.8 ± 0.477 | 8 ± 0.707 | 8.2 ± 0.447 | |
| Avg. Taste | 8.2 ± 0.836 | 8.2 ± 0.836 | 8.4 ± 0.547 | 8.2 ± 0.836 | |
| Avg. Buyg Int | 7.4 ± 0.547 | 7.8 ± 0.836 | 8.2 ± 0.836 | 7.8 ± 0.447 | |
| OAA | 7.76 ± 0.357 | 8 ± 0.200 | 8.28 ± 0.228 | 8.04 ± 0.219 | |
| 15 | Avg. Colour | 7.8 ± 0.447 | 8.2 ± 0.836 | 8.6 ± 0.547 | 8.2 ± 0.447 |
| Avg. Flavour | 7.8 ± 0.836 | 8 ± 0.707 | 8 ± 0.000 | 7.6 ± 0.547 | |
| Avg. Texture | 7 ± 0.707 | 7.4 ± 0.547 | 7.6 ± 0.547 | 7.8 ± 0.447 | |
| Avg. Taste | 7.8 ± 1.09 | 7.8 ± 0.836 | 7.6 ± 0.547 | 7.6 ± 1.14 | |
| Avg. Buyg Int | 7.2 ± 0.447 | 7 ± 1.000 | 7.6 ± 0.547 | 7 ± 0.707 | |
| OAA | 7.52 ± 0.389 | 7.68 ± 0.481 | 7.88 ± 0.438 | 7.64 ± 0.433 | |
| 30 | Avg. Colour | 7.24 ± 0.000 | 8 ± 0.707 | 7.6 ± 0.547 | 8 ± 0.707 |
| Avg. Flavour | 7.4 ± 0.547 | 7.8 ± 0.447 | 7.8 ± 0.447 | 7.6 ± 0.547 | |
| Avg. Texture | 6.8 ± 0.447 | 7 ± 0.707 | 7 ± 0.707 | 7.2 ± 0.447 | |
| Avg. Taste | 7.4 ± 0.547 | 7.6 ± 0.547 | 7.6 ± 0.547 | 7.6 ± 0.547 | |
| Avg. Buyg Int | 6.6 ± 0.547 | 7 ± 0.707 | 7.2 ± 0.836 | 7.2 ± 0.836 | |
| OAA | 7.088 ± 0.367 | 7.48 ± 0.460 | 7.44 ± 0.328 | 7.52 ± 0.334 | |
| 45 | Avg. Colour | 6.64 ± 0.707 | 7.13 ± 0.836 | 8.6 ± 0.547 | 7.2 ± 0.707 |
| Avg. Flavour | 6.8 ± 0.836 | 7 ± 0.707 | 7 ± 0.707 | 6.8 ± 0.836 | |
| Avg. Texture | 5.8 ± 0.447 | 6.2 ± 0.447 | 6.6 ± 0.547 | 6.8 ± 0.447 | |
| Avg. Taste | 7 ± 0.707 | 7.4 ± 0.894 | 7.6 ± 0.547 | 7.6 ± 0.547 | |
| Avg. Buyg Int | 5.6 ± 0.547 | 6.4 ± 0.547 | 6.6 ± 0.547 | 5.8 ± 0.447 | |
| OAA | 6.368 ± 0.626 | 6.83 ± 0.506 | 7.28 ± 0.843 | 6.84 ± 0.669 | |
| 60 | Avg. Colour | 7.4 ± 0.547 | 6.26 ± 0.447 | 8.2 ± 0.447 | 7.2 ± 0.447 |
| Avg. Flavour | 6.4 ± 0.547 | 6.6 ± 0.547 | 7 ± 0.000 | 6.6 ± 0.547 | |
| Avg. Texture | 4.4 ± 0.547 | 4.4 ± 0.547 | 4.8 ± 0.836 | 5.2 ± 0.836 | |
| Avg. Taste | 6.6 ± 0.547 | 6.6 ± 0.547 | 7 ± 0.000 | 7 ± 0.000 | |
| Avg. Buyg Int | 4 ± 0.707 | 3.8 ± 0.836 | 4.4 ± 1.14 | 4.4 ± 0.547 | |
| OAA | 5.76 ± 1.47 | 5.53 ± 1.32 | 6.28 ± 1.61 | 6.08 ± 1.22 | |
Table 10: Sensory characteristics of biocoloured toffees during storage.
Effect of storage on L* a* b* values of biocoloured toffees: Results showed that during storage L* values of all the samples were decreased. This showed that brightness of toffees was decreased during the storage or it was concluded that toffees became darker because of the browning reaction. Similarly the b* values were also decreased this indicated that the yellowness of all biocoloured toffees was decreased during storage. All these changes which occur during storage are presented in 3-dimensional graph in Figure 12.

Figure 12: Effect of storage period on L*a*b* values of biocoloured toffees.
The experimental study indicated that the extracted biocolour from Ratanjyot was having antibacterial and antifungal properties. The sensory score awarded to toffees showed that Ratanjyot colour was liked very much by panelists. At the end of study period the sample fetched good scores for individual sensory property except for texture which was lost slightly during storage owing to hygroscopic nature of honey. Even then, the sensory score for other sensory properties shows the likeness even at the end of study period.