Advances in dairy Research
Open Access
ISSN: 2329-888X
ISSN: 2329-888X
Research Article - (2018) Volume 6, Issue 4
Raw milk quality and hygienic status of dairy farms study were conducted from October 2013-March 2014 in Jimma town with the objectives to assess hygienic milking and handling practices and quality of raw milk at different critical points throughout the milk value chain, in Jimma zone, south western Ethiopia. The study was performed by questionnaire survey, personal observation and milk sample testing in the laboratory. For the survey a total of 54 purposively selected milk producing households who sell raw milk to the town were interviewed to assess the hygienic milking and handling practices.
A total of 162 bulk raw milk samples were collected aseptically from selected farms, milk cooperative and cafeterias for raw milk quality testing and tested with different test. Clot-on-boiling test positive results for farm, cooperative and cafeterias were 7.78%, 55.56% and 58.7%, respectively. Positive cases recorded for alcohol test were 48.89% in farm milk whereas 77.78% in cooperatives milk and 87.43% in cafeterias milk. In this study average mean pH for three sources was 6.68, 6.646 and 6.614, respectively.
The mean titratable acidity of samples was 0.191, 0.226 and 0.261, respectively. The mean specific gravity of the milk samples were 1.0297, 1.028 and 1.0126 g/ml, respectively. Analysis of variance for pH, titratable acidity and specific gravity shows the mean values to be significant. For MBRT only 3.33% of samples from farms reduced the dye above 4½ an hour and about 41.11%, 33.33% and 26.98% decolorized the dye within 2-4½ hours; about 38.89%, 44.44% and 34.92% reduced within 1-2 hours; about 14.44%, 11.11% and 30.15% reduced in ½-1 hour; and 2.22%, 11.11% and 7.9% of samples reduced the dye below ½ an hour, respectively. Methylene blue reduction test shows bacterial load increased as level increased up to consumer
The test result indicated that milk quality deterioration increased from farms to cafeterias. In addition at all level adulteration with water was observed, however it is highest at cafeterias. However, as compared to other sources farm milk had better quality. Reduced quality is related to public health risks and these calls for improvement of quality by awareness creation on hygienic milking and handling of milk and educating milk sellers to avoid adulteration of milk. It is also important to apply appropriate quality control system before receiving the milk to assure quality.
Keywords: Raw milk; Quality; Hygiene; Jimma town; Ethiopia
Milk is the most perishable of all farm produce. It is a highly nutritious food, ideal for microbial growth and the fresh milk easily deteriorates to become unsuitable for processing and human consumption. Unless properly handled, milk can be contaminated by microorganisms at any point from production to consumption and can harbor a variety of microorganisms and can be important sources of food borne pathogens [1].
In Ethiopia, the current trend of rapidly increasing human population together with growing urbanization creates even greater markets and increased the demand for milk and its products [2]. In this country milk is produced in urban and rural areas mostly in nonorganized way and usually supplied to the consumers in raw form. However, the quality of milk remained poor. On the other hand there is little information about the hygienic practices done at different points in milk value chain; and milk quality either at farm level (milk already infected with pathogenic agents or contaminated because of unhygienic handling), milk distributing centers or at market level.
As milk can under certain conditions, pose a potential health hazard, particularly when consumed raw, it is not only the quantity of milk but also its quality and safety that needs to be investigated in order to both improve the nutritional base of an increasing population in urban and peri-urban areas and the marketing of milk and derived products. Understanding these gaps that affect the milk quality and assessing quality of milk is critical to success of development and implementation of policies and programs in dairy industry in the study area. Therefore, this study was aimed to fulfil this gap with the following objectives;
To know the status of hygienic milking practices and sees the entire milk-chain from milking through transporting and marketing of milk and its impact on quality. To assess the quality of raw whole milk from different sources in milk value chain using milk quality tests such as organoleptic test, COBT, pH test, alcohol test, lactometer test, titratable acidity and methylene blue reduction test and,
Raw milk quality has several aspects, the most important being gross composition and hygienic quality. Compositional quality refers to the levels of total solids, milk fat and solids-non-fat or SNF (which include protein, lactose and minerals) in the milk. Milk hygienic quality, on the other hand, refers to the levels of various contaminants in milk, whether bacterial, chemical or any other adulterants those are detected [3].
Good milk hygiene produces dairy products that are safe for human consumption, and that have good keeping quality. On the other hand, poor milk hygiene leads to spoiled products, product recalls (hence adverse publicity), food-borne diseases and unsatisfactory or declining product image. This all leads to reduced consumer confidence in the integrity of the dairy value chain [4].
A quality control system will test milk and milk products for quality, and ensure that milk collectors, processors and marketing agencies follow the correct methods. Having such a system will cost a lot of money. But it is important to have a good system, because it will provide benefits to everyone involved in the dairy industry such as milk producers, milk processors, consumers, government agencies [5]. In Ethiopia, around 97% of the annual milk production is accounted by the traditional milk production system, which is likewise dominated by indigenous breeds. Cows contribute to about 95% of the total annual milk produced by cows and camels at national level [6].
Dairy production, among the sector of livestock production systems, is a critical issue in Ethiopia where livestock and its products are important sources of food and income, and dairying has not been fully exploited and promoted in the country. Milk and milk products are economically important farm commodities and dairy farming is an investment option for many peoples.
Currently the trend of rapidly increasing human population together with growing urbanization creates even greater markets and increased of demand for milk and its products. Ethiopia’s raw milk quality is poor for several reasons. The milking and cleaning is often done in unhygienic conditions. Also, as a consequence of lack of resources, the milk is often transported in plastic containers and without the necessary cooling facilities. Hence, there exists the possibility of consuming milk, which has been contaminated with disease causing organisms [7].
Product temperature is a major factor influencing shelf life. Product temperature must be between 4°C-5°C for maximum shelf life. As a general rule, for every 2.8°C rise in temperature, shelf life is reduced by about 50%. In Ethiopia, smallholder milk processing is based on sour milk mainly due to high ambient temperatures, consumer’s preferences and increasing keeping quality of sour milk [8].
Description of the study area and study period
The study was conducted in Jimma town, Southwestern part of Ethiopia in Jimma zone from October to March 2013/2014. Jimma town, the capital of Jimma zone is located in Oromia Regional Administration, 346 km Southwest of Addis Ababa at latitude of about 7013'-8056' N and longitude of about 35052'-37037' E and at an elevation ranging from 880 m to 3360 m above sea level.
The study area receives a mean annual rainfall of about 1530 millimeters which comes from the long and short rainy seasons. The annual means of minimum and maximum temperature during the study period were 14.4 and 26.7 degree Celsius, respectively. Jimma zone has a total cattle population of 2,214,385 out of which 1163915 are female cattle’s [9].
Data collection
Questionnaire survey: For the questionnaire survey, dairy farmers who sell raw milk to the town were purposively selected for the interview. The survey was performed in order to determine the following aspects which might affect the hygienic quality of milk including; milking technique, cow hygiene and health management, feed and housing, hygienic milking practices (before, during and after milking), milk equipment’s used, milk handling hygiene and storage were assessed.
Personal observation: Personal observation was performed during questionnaire survey, the type of construction and cleanliness of cow’s house, type of feed and way of storage, cleanliness of cow, hygienic milking practices during and after milking, cleanliness and type of equipment’s used at farm level was observed. Way of milk transport to cooperative, hygienic practices and quality control tests done at milk cooperatives
Collection of raw milk sample for quality testing: Raw milk samples were collected from three critical control points in milk value chain (dairy farms, milk cooperatives and cafeterias). Dairy farms were purposively selected those having two or more lactating cows and who sells milk to milk cooperative. Milk cooperative who receive milk from these dairy farms was also included. Seven cafeterias in the town that purchase raw milk from milk cooperative were randomly selected. Then fresh milk sample was taken from selected dairy farms from bulk tank milk before delivery to milk cooperative. On the same day of sampling milk sample was then taken from milk cooperatives from bulk tank. Again the same day milk sample was taken from selected cafeterias from milk canister after taking milk from the cooperative. Raw milk samples from these three sources were collected every two weeks interval for continues four months period.
Accordingly a total of 162 milk samples were collected separately and aseptically from three critical control points in milk value chain and from which 90 samples from farms, nine samples from milk cooperative and 63 samples from cafeterias. Samples of bulk canister fresh whole milk were collected aseptically. After through mixing, milk samples of about 100 ml were taken in sterile glass sample bottles. The samples were transported to Jimma University College of agriculture and veterinary medicine dairy laboratory in an icebox and immediately tested for quality.
Milk quality testing procedures
Organoleptic test: On arrival the appearance of the milk and of the cork of the milk canister or container was observed and inspected instantly after the cork was removed. The milk was smelled, the appearance observed, s the canister was checked for cleanliness, looked for sediment, flies, and tasted if necessary.
Clot on boiling test: This test was performed by heating a small amount (2 ml) of milk in a test tube over a flame. If there was clotting, coagulation or precipitation, the result was reported as positive otherwise negative.
Alcohol test: In this test equal volumes of milk and 68% alcohol in a test tube (2 ml of milk in 2 ml of 68% alcohol) waken. Then the test tube was inverted several times, keeping thumb pressed tightly over the open end of the tube. Finally, the tube was examined to see whether the milk has coagulated, clotted or precipitated and reported as positive (formation of precipitation) or negative (no clotting or precipitation).
pH test: This test was done by using digital pH meter. it is performed by dipping an electrode of a digital pH meter into milk sample after the pH meter was calibrated against standard buffer solutions at pH 4.0 and 7.0 [10]. Then the value was read from the screen and recorded.
Lactometer test: This test was done to measure specific gravity of milk for adulteration using lactometer. First, the temperature of the milk was measured. The temperature of the milk was made to be in between 15°C and 20°C. Hot milk was left to cool at room temperature for at least 30 minutes. The milk sample was mixed well and gently poured into 200 ml measuring cylinder. Then the lactometer was slowly dipped into the milk and left for some moment until it stop sinking. Finally the lactometer reading was taken just above the surface of the milk and specific gravity was calculated using the formula;
Titratable acidity test: In this test about 10 ml of milk and an equal volume of distilled water was added in 25 ml flask. Then about 1.0 ml of the phenolphthalein indicator solution was added into the sample. The content in the flask was then rapidly titrated one against the standard (0.1N NaOH) by stirring the contents with a glass rod until the first definite change to a pink colour, which remains for 10-15 seconds and the titration was completed within 20 seconds. Finally the volume of sodium hydroxide solution consumed was read from the burette and lactic acid% (titratable acidity) was calculated using the following formula;
V1=volume in ml of the standard sodium hydroxide required for titration;
N=normality of the standard sodium hydroxide solution, and
V2=volume in ml of milk taken for the test
Methylene blue reduction test: First sterile test tube was filled with 10 ml of sampled raw milk. Then 1 ml of the Methylene Blue solution was added in it using pipette taking care that the pipette did not came into contact with any of the milk in the tube or with the wetted side of the interior of the tube.
The tube was closed with a sterile rubber stopper and slowly inverted twice for mixing so that the whole column of contained air rises above the level of the milk. Within 5 minutes the tube was placed in water bath at 37°C and the time was noted.
The tube was examined after every 30 minutes and completely decolorized sample or decolorized sample up to 5 mm of the surface was removed. The time at which decolourization observed was recorded and the milk quality was reported as very good, good, fair or bad depending on the length of decolourization time.
Data analysis
Survey data collected were analysed using descriptive and inferential statistics such as means, frequency distribution and percentage using SPSS software (version 16). Milk sample result was analysed using, mean, percentage, and one-way ANOVA using the software.
Questionnaire survey and personal observation
Hygiene and health management of cows: In the study area majority of farmers do not wash their cow’s body (35.59%) followed by nonregular washing (30.5), twice a week (5.08%) and once a week (28.81%) washing. Those farms washing in irregular interval may wash their cows once or twice per month or even per three month. This result indicates only few farms (5.08% +28.81) practice proper cleaning of their cows’ body. No washing at all and irregular washing (65%) results dirt on the cows’ body which will enter in the milk during milking operation and finally results in lower quality milk (Table 1).
| No | Variables | Total | Percentage (%) | |
|---|---|---|---|---|
| 1 | Washing Cows Body | once a week | 17 | 28.81 |
| Twice a week | 3 | 5.08 | ||
| Not regular | 18 | 30.5 | ||
| No wash | 21 | 35.59 | ||
| 2 | Udder disese | Not Encountered | 25 | 42.37 |
| Encountered | 34 | 57.63 | ||
| Taking to veterinary clinic | 18 | 53 | ||
| Milk immediately after treatment from other normal quarter | 16 | 47 | ||
| 34 | 100 |
Table 1: Cow hygiene and health management practices in Jimma town.
Besides other factors, clinical and subclinical mastitis, are the most important reasons for a reduced raw milk quality [11]. In the study area about 34 (57.63%) farms encountered udder diseases and out of this, 47% of them take no action and 53% of them managed the problem by taking to veterinary clinic. None of them take the milk from affected quarter but all of them were not refrained from milking from other quarters. This indicates the milk produced in the study area may contain drug residues.
Feed and water for the cows: The source of feed for the cows in the study area varies in which majority of farms use cut and carry grass and concentrate (37.8%) followed by pasture grazing and concentrate (32.2%), pasture only (29.11%) and cut and carry+concentrate+silage (3.38%). Majority of the farms who use cut and carry system store their cows feed outside a shed (55.93%) and 11.86% of them store their animal feed inside a shed. Regarding source of water about 52.54%, 20.34%, 18.64%, 8.47% of them drink their cow from pipe water, borehole, river and pond, respectively.
The amount, the composition and quality of the forages, as well as their continued availability, have a decisive influence on the quality of the cow’s raw milk. Beside the milk yield, especially the fat and protein content of milk can be influenced with feeding. A well-fed and watered animal will produce high quantities of milk of good composition [12]. However in this study adequate amount of feed is not provided due to shortage of grazing land and inadequate supply and high price of concentrate feeds. In addition to this quality of feed is not as required. A good balance of forage and concentrates is important to produce quality raw milk [13].
Although in this study they do not provide correct balance of this feeds. Improper procurement, manufacturing and handling of animal feed can result in the introduction of pathogens and spoilage organisms to milking animals and the introduction of chemical hazards such as pesticide residues, mycotoxins and of other contaminants which can affect the safety and suitability of milk or milk products. In this study majority of animal feed are improperly stored outside a shed. This expose feeds to rain (moisture) resulting in development of mycotoxins in the feed which finally affect safety of raw milk. Regarding clean water supply only 52.54% of respondents drink their cow clean water and the rest uses water from unsafe sources (Table 2). This will easily affect the health of the cow and some water borne bacteria are dangerous and can easily enter the milk [14].
| S.No | Variables | Total | Percentage (%) | |
|---|---|---|---|---|
| 1 | Source of feed for cows | Pasture and concentrate | 19 | 32.2 |
| Cut and carry and concentrate | 22 | 37.28 | ||
| Cut and carry+concentrate+ silage | 2 | 3.38 | ||
| Pasture only | 16 | 29.11 | ||
| 2 | Place where feeds stored | Inside shed | 7 | 11.86 |
| Outside shed | 33 | 55.93 | ||
| Not stored | 19 | 32.21 | ||
| 3 | Source of water for cows | Pipe water | 31 | 52.54 |
| River water | 11 | 18.64 | ||
| pond | 5 | 8.47 | ||
| Borehole | 12 | 20.34 |
Table 2: Feed and water for cows.
Cow housing and cleaning practices in Jimma town: According to the current study the majority of the interviewed farm owners used separate house for their cows (72.88%) and about 27.12% of farm owner share the same house with their animals (Table 3). This finding disagrees with Bereda et al, in Ezha district of the Gurage zone, Southern Ethiopia and Asaminew, 2007 in Bahir Dar Milk Shed reports where majority respondents shared the same house with their animals.
| S.no. | Variables | Total | Percentage (%) | |
|---|---|---|---|---|
| 1 | Housing | Separate house | 43 | 72.88 |
| Common house | 16 | 27.12 | ||
| 2 | Bedding material | Hay, straw | 11 | 18.64 |
| No bedding material | 48 | 81.36 | ||
| 3 | Frequency of cleaning | Once per day | 17 | 28.81 |
| Three times per week | 12 | 20.34 | ||
| Anytime when it looks dirty | 30 | 50.85 |
Table 3: Cow housing and its hygiene.
Clean, dry and comfortable bedding condition is important to minimize the growth of pathogenic microorganisms. As observed in the present study 18.64% of the respondents used hay and straw as bedding material for their animals. The remaining households (81.36%) did not use any bedding material at all (Table 3) and the floors are moist and muddy when observed.
Teats and udders of cows inevitably become soiled while they are laying in stalls or when they are allowed to stay in muddy barn yard. Hay or straw bedding material has been shown to harbor large numbers of microorganisms. During this observation majority of the floor of houses were moist and improperly drained.
The teat ends of the cows are then exposed to organic bedding sources and wet and muddy pens increase the risk of occurrence of mastitis and milk contamination [15]. About 50.85% of the respondents clean the barn once per day, while 28.81% clean three times per week and 20.34% of them reported to clean any times when it looks dirty (Table 3).
This practice is somewhat worse than that of Zelalem’s report of the Ethiopian highlands where about 87% of the respondents cleaned their barn on daily basis and few (9%) of them cleaned only once or twice a week.
Hygienic practices followed during milking: In this study all of the interviewed farm owners practiced hand milking. Cleaning the udder of cows before milking is important since it could have direct contact with the ground, urine, dung and feed refusals while resting. In this study, about 74.57% of respondents wash their hands and cows’ teat and udder before milking and 27. 43% of respondent do not wash (Table 4).
| S.No. | Variables | Total | Percentage (%) |
|---|---|---|---|
| 1 | Washing hand before milking | 44 | 74.57 |
| Not washing hand before milking | 15 | 25.43 | |
| 2 | Wash udder and teat | 44 | 74.57 |
| Not wash udder and teat | 15 | 25.43 | |
| 3 | Dipping teats before milking | 0 | 0 |
| 4 | Fore stripping | 6 | 10.17 |
| No fore stripping | 53 | 89.83 | |
| 5 | Dipping teats after milking | 3 | 5.08 |
| No dipping | 56 | 94.92 | |
| 6 | Frequency of milking once per day | 6 | 10.17 |
| Frequency of milking twice per day | 53 | 89.83 |
Table 4: Hygienic practices during milking.
Lack of washing udder before milking can impart possible contaminants into the milk. The current study agrees with the reports of Haile et al. who reported that majority of the small size farm owning households in Hawassa city are practicing pre milking udder washing. Pre-dipping, fore-stripping, and post-milking teat disinfection are essential components of hygienic milking operations [16].
However, in this study none of respondents practiced pre-dipping, only 10.17% of them practiced fore-stripping and 5.08% of them practiced post-milking teat disinfection (Table 4). This indicates that there is increased contamination of raw milk in the study area resulting in poor milk quality. Cows are usually milked twice a day except few (10.17%) farms that milk once daily (Table 4).
Milk utensils and source of water for milking operation: Equipment used for milking, storage and transportation determine the quality of milk and milk products. In this study about 88.13% of respondents used plastic utensils and only 11.87% of respondents used metallic utensils as milking, storing and transporting utensil (Table 5). The use of plastic containers can be a potential source for the contamination of milk by bacteria, because it allows the multiplication of bacteria on milk contact surfaces during the interval between milking.
| S.No. | Variables | Total | Percentage (%) | |
|---|---|---|---|---|
| 1 | Milk utensils | Plastic | 52 | 88.13 |
| Metallic | 7 | 11.87 | ||
| 2 | Frequency of milk utensil cleaning | Once per day | 16 | 27.11 |
| Twice per day | 4 | 6.79 | ||
| Every time before and after using | 39 | 66.1 | ||
| 3 | Using utensils after washing | immediately without drying | 46 | 77.96 |
| Using after it is dried | 13 | 22.04 | ||
| 4 | Cooling facility for milk to cool until sell | Have refrigerator | 1 | 1.69 |
| No refrigerator | 59 | 98.31 |
Table 5: Milk utensils and source of water for dairy operation in Jimma town.
Plastic is not advisable as after some time the surface will contain scratches, which can hardly be seen but are nearly impossible to clean. Metal containers such as aluminium and stainless steel cans are recommended under the code of hygienic practices [17]. In this study, all of the respondents practiced washing of their milk utensils in which 27.11% of them wash once per day, 6.79% wash twice per day and 66.1% of them wash every time before and after use. However, cleaning is not efficient and majority of the respondents (77.96%) use immediately after washing without proper drying (Table 5).
To prevent or retard growth of bacteria in milk and to maintain its quality for domestic consumption or during transport to the distributing or processing plant, it is essential to cool the fresh milk as quickly as possible [18]. However present study showed that only one farm has cooling facility. This indicates that almost all of the milk produced was exposed to high temperature until it arrive to milk distributing centre this in turn facilitate proliferation of milk spoiling bacteria in the milk.
The sources of water available to farmers used for different purposes (to clean milk equipment, cows udder and milker hands) varied in the study area. The majority of the respondents (52.54%) had access to pipe water followed by borehole water (20.34), river water (18.64%) and pond water (8.47%) (Figure 1). However, the quality of river, borehole and pond waters used for cleaning may not be of the required standard thus be able to contribute to the poor quality of milk in this study area. When water from no tap sources is used for cleaning purpose, it is important that producers should at least filter and heat treat it before use.
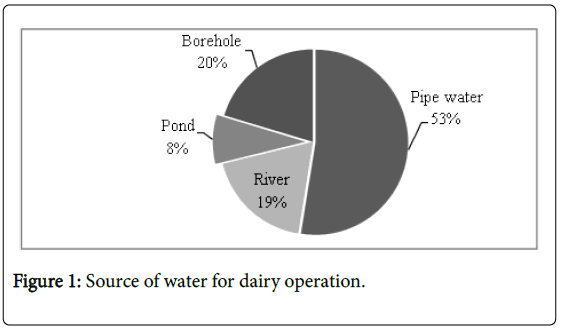
Figure 1: Source of water for dairy operation.
Results of milk quality tests
Clot on boiling test: Clot-on-boiling positive results for farm, cooperative and cafeterias were 7.78%, 55.56% and 58.7%, respectively (Table 6). Great variation was observed in these three points and variations in COBT values are the main reasons of quality deterioration of milk. Higher difference in COBT values for farm milk and cooperative milk might be due to the unhygienic management practices during the handling of raw milk. It was obvious from the results that farm milk was in better condition as compared to other sources. Furthermore it is revealed that deterioration increases as the steps increase towards marketing. This result is in line with reports of [19].
Alcohol test (AT): The results of test are shown in Table 7. The result of the alcohol test shows the significant differences among all three sources of milk. Positive cases recorded were 48.89% in farm milk whereas 77.78% in cooperatives milk and 87.43% in cafeterias milk (Table 6). The result shows high level of acid and excess of salt concentration in the milk samples that indicate low quality milk. Milk coagulated only when the acidity of milk reached 0.21%-0.23%.
| Milk source | Number of samples(N=162) |
Clot-on-boiling test | |
|---|---|---|---|
| Positive (%) | Negative (%) | ||
| Farms | 90 | 7.78 | 92.22 |
| Cooperatives | 9 | 55.56 | 44.44 |
| Cafeterias | 63 | 58.7 | 41.3 |
Table 6: Values for clot-on-boiling test of milk samples from different sources.
| Milk source | Number of samples(N=162) | Alcohol test | |
|---|---|---|---|
| Positive (%) | Negative (%) | ||
| Farms | 90 | 48.89 | 51.11 |
| Cooperatives | 9 | 77.78 | 22.22 |
| Cafeterias | 63 | 87.43 | 12.57 |
Table 7: Result of alcohol test for milk from three different points.
According to the results all the sources showed higher acidity with a big difference observed in between farms and cooperative milk. This big difference is due to mixing of different milk from different farms where some of these milks were already acidic causing whole milk become acidic. High positive result for cafeterias was high risk of contamination from farm to cafeterias and long-time delay as compared to farms and cooperative. The increase in acidity for all sources was due to unhygienic milking practices, dirty plastic utensils, non-potable water and also adulteration of the milk. This finding agrees with the report of [20].
Acidity test-pH and titratable acidity: Milk acidity is an important indicator of milk quality. In this study average mean pH for three sources was 6.68, 6.646 and 6.614, respectively. The mean titratable acidity of samples from farm, cooperatives and cafeterias were 0.191, 0.226 and 0.261, respectively (Table 8). The mean values are significant. Analysis of variance shows pH and titratable acidity found to be significant (Tables 9 and 10 respectively).
| S.No. | Milk source | Ph | Titratable acidity | No. of samples | ||
|---|---|---|---|---|---|---|
| Mean | Sd.dev | Mean | Sd.dev | |||
| 1 | Farm | 6.681 | 0.1435 | 0.191 | 0.0424 | 90 |
| 2 | Milk cooperatives | 6.642 | 0.0554 | 0.226 | 0.046 | 9 |
| 3 | Cafeterias | 6.614 | 0.1755 | 0.261 | 0.0688 | 63 |
Table 8: Mean pH and titratable acidity for different milk sources.
| Source | SS | Df | MS | F | P-value |
|---|---|---|---|---|---|
| Between groups | 0.1656 | 2 | 0.828 | 3.49 | 0.0327 |
| Within groups | 3.769 | 159 | 0.0237 |
Table 9: Analysis of variance for pH.
| Source | SS | Df | MS | F | P-value |
|---|---|---|---|---|---|
| Between groups | 0.182 | 2 | 0.091 | 31.06 | 0 |
| Within groups | 0.466 | 159 | 0.00293 |
Table 10: Analysis of variance for titratable acidity.
The pH of normal raw cow milk is 6.7-6.8 and the natural (titratable) acidity is 0.16% - 0.18%, and samples with higher figures indicate developed acidity. The result indicates acidity increased from farm to cafeteria that is freshness of the milk was decreased. It is obvious that milk from farms is slightly fresh as compared to other sources. The finding of present study was lower than 0.26% at farm reported by [21] in Kersa district of Jimma zone.
Development of acidity was from unhygienic milking practices; dirty milk equipment’s; and high temperatures and delayed transport until arrival to selling centres which facilitated the growth of lactose fermenting bacteria. This bacteria breakdown the lactose content of the milk and increases acidity of milk.
In addition to these, in milk cooperatives the raw milk is collected in big utensil/container in which milk of different sources was mixed, and this kind of mixing may increase the acidity of milk because some of them are already acidic and can be the source of high acidity in whole milk container.
Results of milk adulteration test: The present study shows mean specific gravity of the milk from farms; cooperatives and cafeterias were 1.0297, 1.0288 and 1.0126 g/ml, respectively (Table 11).
| Source of milk | Specific gravity (g/ml) | ||
|---|---|---|---|
| <1.028 (%) | 1.028 -1.034 (%) | >1.034 (%) | |
| Farms (n=90) | 20 | 80 | 0 |
| Cooperative (n=9) | 11.11 | 90.89 | 0 |
| Cafeterias (n=63) | 49.2 | 39.69 | 11.11 |
n= number of sample
Table 11: The proportion (percentage) of adulterated samples in different sampling sources.
The analysis of variance shows that the mean values for specific gravity were found to be significant (Table 12). The proportion of samples with specific gravity less than 1.028 for these three sources were 20%, 11.11% and 49.2%, respectively. From three sources only 11.11% of the samples of cafeteria has specific gravity more than 1.034 (Figure 2).
| Source | SS | Df | MS | F | Prob>F |
|---|---|---|---|---|---|
| Between Groups | 0.0103 | 2 | 0.00518 | 0.082 | |
| Within Groups | 1 | 159 | 0.00629 |
Table 12: One-way ANOVA table for specific gravity.
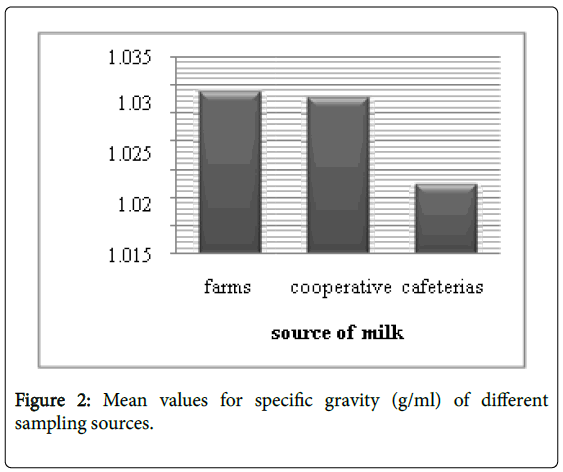
Figure 2: Mean values for specific gravity (g/ml) of different sampling sources.
The present study shows mean specific gravity of the milk from farms; cooperatives and cafeterias were 1.0297, 1.0288 and 1.0126 g/ml, respectively (Table 11).
The analysis of variance shows that the mean values for specific gravity were found to be significant (Table 12). The proportion of samples with specific gravity less than 1.028 for these three sources were 20%, 11.11% and 49.2%, respectively.
From three sources only 11.11% of the samples of cafeteria have specific gravity more than 1.034 (Figure 2).
Addition solids will increase specific gravity beyond normal (i.e. more than 1.034 g/ml). From the three sources only cafeteria sample has smaller proportion (11.1%) with specific gravity above normal range.
This is due to some cafeterias adding some cheap products such as powder milk into the milk after they have diluted the milk with water in order to make it thicker.
Results of methylene blue reduction test: In this study only 3.33% of samples from farms reduced methylene blue above 4½ an hour and about 41.11%, 33.33% and 26.98% of milk samples from farms, cooperatives and cafeterias decolorized the dye within 2:00-4:30 hours, respectively. About 38.89%, 44.44% and 34.92 % of samples from farms, cooperatives and cafeterias, respectively reduced the dye within 1-2 hours. About 14.44%, 11.11% and 30.15% of samples of farms, cooperative and cafeterias decolorized in 0:30-1:00 hour time, respectively and 2.22%, 11.11% and 7.9% of cooperatives and cafeterias samples, respectively reduced the dye below half an hour (Table 13). The results obtained from the three different sources are found significant.
| MB reduction time in hours | Source of milk | ||
|---|---|---|---|
| Farms (%), n=90 | Cooperatives (%), n=9 | Cafeterias (%), n=63 | |
| >4:30 | 3.33 | 0 | 0 |
| 2:00-4:30 | 41.11 | 33.33 | 26.98 |
| 1:00-2:00 | 38.89 | 44.44 | 34.92 |
| 0:30-1:00 | 14.44 | 11.11 | 30.15 |
| <30 min | 2.22 | 11.11 | 7.9 |
Table 13: Methylene blue reduction test result for three sources.
The longer the time of dye reduction show the lower the number of bacteria in the milk and then the higher the quality of the milk. The above result showed that majority of the samples from different sources reduced the dye below two hour. Only 3.33% of samples from farms have very good quality and about 41.11%, 33.33% and 26.98% of farms, cooperatives and cafeterias’ samples, respectively have good quality.
About 38.89%, 44.44% and 34.92% of samples from farms, cooperative and cafeterias respectively have fair quality and about 14.44%, 11.11% and 30.15% of farms, cooperative and cafeterias samples respectively have bad quality. The rest proportions have very bad quality (Tables 13 and 14).
| S. No. | Methylene blue reduction time | Quality of milk |
|---|---|---|
| 1 | >4:30 | Excellent |
| 2 | 2:00-4:30 | Good |
| 3 | 1:00-2:00 | Fair |
| 4 | 0:30-1:00 | Bad |
| 5 | <30 min | Very bad |
Table 14: Grading of milk on the basis of (MBRT) in different milk sources.
In this study most of milk sample showed very short discoloration time of the dye and the reduction time decreased from farm to cafeterias. The shorter time required for the disappearance of the blue colour is indicative of a higher microbial load. This may be due to poor milk handling practices during milking and transporting, poor animal health services, unclean utensils, exposure to high temperature and use of poor potable water which were linked to markedly high TBC [23-25].
Data from questionnaire and personal observation revealed that good hygienic milking practices is not well practiced and this finally resulted in production of less quality milk in Jimma town. The quality of milk samples collected from three different critical points in milk value chain was generally below standards. This is mainly due to lack following strict hygienic practices during milk production and subsequent handling.
Moreover, majority the respondents reportedly used plastic materials as milk container while milking, storing and transporting which can be a potential source for the contamination of milk by bacteria. There is also adulteration of milk at all levels; however, milk is highly adulterated at cafeterias. The majority of milk sample was also found with high microbial load.
Therefore, based on the above conclusion, the following recommendations can be forwarded;
Since, deterioration of raw milk quality starts at farm, dairy farmers should be aware about hygienic milking practices before, during and after milking:
About keeping the health of their dairy cows,
Providing proper house,
Washing hand and disinfecting of udder and teat before milking,
Proper cleaning and drying of milk utensils made of metals and
Immediate cooling of milk until arrival to milk cooperative.
Milk quality control system in every point is very important to assure milk quality. But in the study area appropriate quality tests are not done at milk cooperative. Therefore, milk cooperatives should have to conduct required quality tests in order to approve the quality of milk received from farmers.
Milk adulteration remained a big problem in every point and is directly related to public health risks. Therefore, the concerned bodies should be aware about the bad effects of adulteration to the health and made them to stop such practices.
The Authors would like to acknowledge Jimma University college of Agriculture and Veterinary Medicine for financial support and provision of laboratory desk to do the research. We would like to thank also all the dairy farmers, milk cooperatives and cafeterias willingly provided the milk samples.
The authors declare that they have no competing interests.
We hereby declared that we are the only Authors participated on the research and preparation of the manuscript.