Journal of Nutrition & Food Sciences
Open Access
ISSN: 2155-9600
ISSN: 2155-9600
Research Article - (2025)Volume 15, Issue 2
Assessment of genetic diversity is necessary for any breeding programme to increase world’s food by gathering different favorable genes resulted from segregant generations. The present study was designed to find diversity patterns among fourteen lines of hexaploid wheat (Triticum aestivum L.). Nine quantitative traits were determined phenotypically. Moreover grain properties and nutritional quality were also determined by laboratory procedures. Cluster analysis based on squared Euclidean distance and ward's linkage method, categorized the cultivars into four groups. Based on Principal Component Analysis (PCA), the first seven components explained over 88% of genetic variation. Cluster analysis based on PCA using the first seven principal components indicated four separate groups of genotypes, with the maximum genetic distance observed between genotypes in each cluster. Grain diameter, grain weight, gluten content, protein content, fiber, fat and starch contributed towards significant Principal Components (PCs). 88146, Fareed-06, 6317 and 88132 were concluded as more diverse parents. Diverse parents from various clusters are helpful in planning and broadening the breeding programme especially for grain quality in Pakistan. Wheat Bran (WB) consists mainly of different histological cell layers (pericarp, testa, hyaline layer and aleurone). WB contains large quantities of Non-Starch Polysaccharides (NSP), including Arabinoxylans (AX) and β-glucans. These dietary fibres have long been studied for their health effects on management and prevention of cardiovascular diseases, cholesterol, obesity, type-2 diabetes and cancer. NSP benefits depend on their dose and molecular characteristics, including concentration, viscosity, molecular weight and linked-polyphenols bioavailability. Given the positive health effects of WB, its incorporation in different food products is steadily increasing. However, the rheological, organoleptic and other problems associated with WB integration are numerous.
Conclusion: Biological, physical, chemical and combined methods have been developed to optimise and modify NSP molecular characteristics. Most of these techniques aimed to potentially improve food processing, nutritional and health benefits. In this review, the physicochemical, molecular and functional properties of modified and unmodified WB are highlighted and explored. Up-to-date research findings from the clinical trials on mechanisms that WB have and their effects on health markers are critically reviewed. The review points out the lack of research using WB or purified WB fibre components in randomized, controlled clinical trials
Being staple food, wheat is principal source of carbohydrates in human diet. In Pakistan, during the crop season 2009-2010, total wheat production was 23.864 million tonns thus decreasing the target production by 9.5% [1]. As population of Pakistan is increasing day by day and to fulfill the demands we need to increase its grain yield with available resources. Although Pakistan has made an impressive improvement in wheat production and has attained 10th position in wheat producing countries of the world accounting for approximately 2.73% of global wheat supply. The situation of wheat production in Pakistan is much better than the past but wheat yield is still behind the agricultural developed countries of the world. There is need to advance its stability and improvement. It contributed 13.1% to agriculture and 3.1% to GDP. Increase in population demands a substantial increase in productivity. There must be 2% increase in wheat production on available area under wheat crop will not increase much afar from the present situation to fulfill human needs by 2050 [2]. Overall cultivated area, production and yield of wheat for the year 2010-2011 is, 8.805 million hectares, 24.214 million tonns and 2750 kg/hectare. Plant breeding and other genetic technologies should be adopted to improve human health and the world's nutrition and health communities should support these efforts [3]. In wheat quality, protein and gluten are most important traits however less research work has been done in quality traits.
Muhammad, et al. described positive and significant association between protein and gluten contents at genotypic level [4]. Liu, et al. also reported importance of quality traits for making bread [5]. Wheat yield changes widely as a result of its interaction with environment due to its complex inheritance and product of a number of contributing factors [6].
To harness friable genetic variation in breeding material, it is worthwhile to trace the total variation into its components. Realizing the importance and need for such a comparative study in hexaploid wheats, the present investigation is employed to study genetic diversity in yield related quantitative traits, quality parameter to identify superior accessions, choice of parents and to adapt an efficient breeding programme for variety development in country.
A collection of 14 breeding lines including 3 standard or check varieties of bread wheat (Triticum aestivum L.) were collected from regional agricultural research institute Bahawalpur, Pakistan. The germplasm was experimented during crop year 2010-2011 at the department of plant breeding and genetics, University College of Agriculture, Bahauddin Zakariya University Campus, Multan (Latitude 30.277, Longitude 071.507, Altitude 373 ± 19) having a semi-natural and agricultural landscapes that lies in southern irrigated zone Punjab Pakistan. The experiment was planned in randomized complete block design with three replications. Each genotype was sown by single seed dibbler technique in 4 rows 5 meter long; keeping distance of 25 cm between rows and 20 cm within plants for each genotype. All agronomic practices were applied to raise the crop. Data was recorded at an appropriate time. Ten plants were selected randomly and tagged from central two rows to measure the following traits separately for each replication. Seven quantitative traits including Plant Height (PH), number of Spikes per Plant (S/P), Spike Length (SL), number of Spikelets per Spike (Sp/S), number of Grains per Spike (G/S), Biomass of Spike (BS), Grain Yield per Plot (GY/P) were measured for each replication.
Moreover a second experiment was performed at cereals laboratory Ayub Agricultural Research Institute, Faisalabad for measuring grain physical characteristics such as Thousand Kernel Weight, Single Kernel Characterization System (SKCS) (kernel weight, kernel diameter, kernel moisture, hardness index, grain length and grain width) grain nutritional profile (protein content, starch content, gluten content, zeleny sedimentation rate) were measured by Kernelyzer (omeg analyzer g model) whereas ash content, crude fat and fiber were measured by standard methods chemically at department of food science and technology, University College of Agriculture Bahauddin Zakariya University Multan (Table 1).
| Genotypes | Varietal code |
|---|---|
| Mairaj-08 | V1 |
| 88131 | V2 |
| 88132 | V3 |
| 99192 | V4 |
| 88106 | V5 |
| 88124 | V6 |
| Fareed-06 | V7 |
| 99199 | V8 |
| 88146 | V9 |
| 88148 | V10 |
| 6317 | V11 |
| 32862 | V12 |
| 76346 | V13 |
| Sehar-06 | V14 |
Table 1: List of wheat genotypes used in experiments.
Statistical analysis
The recorded data for all attributes was statistically analyzed using statistical package [7]. Multivariate analysis such as principal component analysis and cluster analysis were performed for determination of genetic diversity based on morphological and quality attributes. Principal component analysis was based on correlation matrix. Statistically significant principal components were selected using eigen significant criteria as established by Kaiser, et al. whereas cluster analysis was applied according to Ranjbar, et al. and Chaparzadeh, et al. [8-10].
Analysis of Variance (ANOVA) represented that genotype used for present study had significant variation for most of the traits. The spikelets per plant and grain diameter showed nonsignificant variation among the genotypes for the year. Whereas grains per spike, moisture), protein content, fat and fiber were highly significant (Tables 2-5).
| Source of variation | Degree of freedom | Plant height (cm) | Spike length (cm) | Spikes/plant | Biomass of spike (g) | Spikelets per spike | Grains per spike | Yield per plot |
|---|---|---|---|---|---|---|---|---|
| Replication | 2 | 57.71 | 0.65 | 0.74 | 0.042 | 1.36 | 1.023 | 0.052 |
| Variety | 13 | 62.83* | 0.72* | 0.40NS | 0.095* | 1.51* | 40.33** | 0.035* |
| Error | 26 | 25.20 | 0.32 | 0.28 | 0.038 | 0.61 | 4.357 | 0.016 |
| Total | 41 |
Table 2: Mean squares of the 7 morphological traits for wheat (Triticum aestivum L.).
| Source of variation | Degree of freedom | 1000-kernel weight (g) | Hardness index % | Diameter (mm) | Grain weight (mg) | Grain length (mm) | Grain width (mm) | Moisture % |
|---|---|---|---|---|---|---|---|---|
| Variety | 13 | 14.68* | 45.32* | 0.00986NS | 6.29* | 0.35* | 0.05* | 0.62** |
| Error | 28 | 6.47 | 20.83 | 0.00797 | 2.61 | 0.15 | 0.02 | 0.13 |
| Total | 41 |
Table 3: Mean squares of the 7 kernel traits for wheat (Triticum aestivum L.).
| SOV | Degree of freedom | Protein | Starch | Gluten | Zeleny | Ash | Fat | Fiber |
|---|---|---|---|---|---|---|---|---|
| Variety | 13 | 1.43** | 1.30* | 10.55* | 147.50* | 0.35** | 0.060** | 0.09146** |
| Error | 28 | 0.38 | 0.55 | 4.90 | 56.71 | 0.008 | 0.005 | 0.01041 |
| Total | 41 |
Table 4: Mean squares of the nutritional profile for wheat (Triticum aestivum L.).
| Characters | PH | SL | S/P | BS | S/Sp | G/Sp | Y/Plot |
|---|---|---|---|---|---|---|---|
| Mean | 91.09 | 8.91 | 5.38 | 2.23 | 16.35 | 34.90 | 1.70 |
| Range | 83.5-98.7 | 8.3-10.3 | 5.0-5.7 | 1.9-2.57 | 15.3-17.6 | 27-43.6 | 1.55-1.90 |
Table 5: Mean, minimum and maximum values of grain yield traits for the year 2010-2011.
Principal component analysis is a classical technique used for data analysis, compression and visualization of features of data set Jolliffe, et al. and Bishop [11,12].
Scree plot
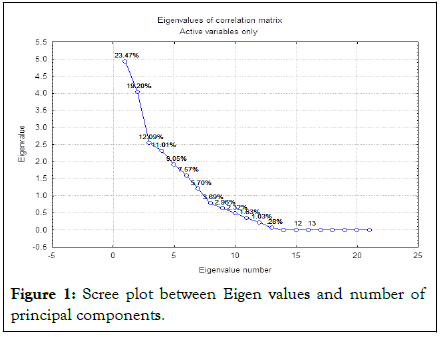
Eigen values for 13 principal components have been shown in the scree plot (Figure 1). The data revealed that out of thirteen, seven PCs exhibited Eigen value (also called latent root) greater than one (significant) contributing 88.09% of variation. The rest six PCs explained trivial (non-significant) amount of variation and were not worth interpreting. Among 14 accessions of wheat, the contributions by the first four PCs showed 65.76% of variability and were due importance for further explanation (Table 6). The PC1 has 23.47%, PC2 showed 19.20% and PC3 exhibited 12.10% variability among the genotypes for the traits under study. In fact, with this method, 12 variables were reduced to seven. Gluten, protein, grain weight, grain diameter, starch, fat and fiber were noted as the characteristics for variability (Figure 1). The principle developed by Johnson and Wichern was used to determine the importance of a trait coefficient for each significant principal component [13].
| PCA | Eigen value | % Total-variance | Cumulative-Eigen value | Cumulative-% |
|---|---|---|---|---|
| 1 | 4.927789 | 23.46566 | 4.92779 | 23.4657 |
| 2 | 4.032677 | 19.20322 | 8.96047 | 42.6689 |
| 3 | 2.538137 | 12.08636 | 11.49860 | 54.7552 |
| 4 | 2.311460 | 11.00695 | 13.81006 | 65.7622 |
| 5 | 1.901104 | 9.05287 | 15.71117 | 74.8151 |
| 6 | 1.590544 | 7.57402 | 17.30171 | 82.3891 |
| 7 | 1.197682 | 5.70325 | 18.49939 | 88.0923 |
Table 6: Eigen values of correlation matrix and related statistics for first seven PC’s Active variables only.
The first principal component was highly related to the gluten, protein, grain weight and grain diameter. This implies that PC1 is a weighted average of these four traits. Whereas in second principal component starch, fat and fiber are traits of significant importance. The third principal component exhibited positive effect for moisture, grain width, zeleny sedimentation rate and 1000-grain weight [14,15].

Figure 1: Scree plot between Eigen values and number of principal components.
Biplot
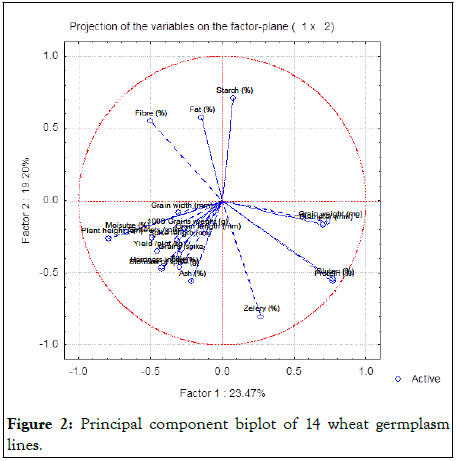
A principle component biplot showed that variables are super imposed on a plot as vectors; relative length of vector represents the relative proportion of the variability in each variable represented. In PC1 and PC2 together gluten, protein, grain weight and diameter are well represented in the plot but hardness index, biomass of spike, grains/spike and 1000-grains weight have minimum difference in PC1 and PC2 (Figure 2) [16].

Figure 2: Principal component biplot of 14 wheat germplasm lines.
Scatter plot
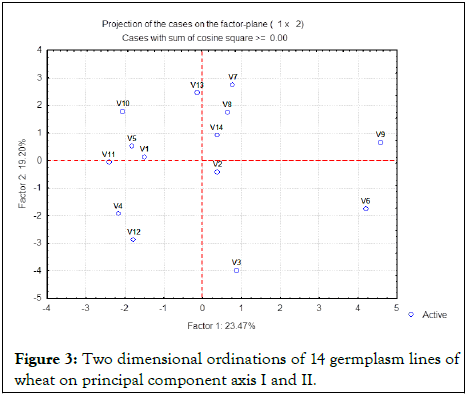
A principal component scatter plot of the wheat accessions depicts that the accessions that are close together are perceived as being similar when rated on the twenty-one variables. Accessions which are further apart are more different. Thus most of accessions are close to each other while V3 (88132), V6 (88124), V7 (Fareed-06), V9 (88146), V11 (6317) and V13 (76346) are rather separated from each other on both PC1 and PC2. This population structure aided in identification of diverse groups of parents from segregating population (Figure 3 and Tables 7,8) [17].

Figure 3: Two dimensional ordinations of 14 germplasm lines of wheat on principal component axis I and II.
| Characteristics | Factor 1 | Factor 2 | Factor 3 | Factor 4 | Factor 5 | Factor 6 | Factor 7 |
|---|---|---|---|---|---|---|---|
| Plant height (cm) | 0.7919 | 0.2644 | 0.1897 | 0.1215 | 0.2960 | 0.1294 | 0.1875 |
| Spike length (cm) | 0.3158 | 0.2779 | 0.2405 | 0.3672 | 0.6840 | 0.0093 | 0.0966 |
| Tillers | 0.2979 | 0.4605 | 0.1271 | 0.5767 | 0.0790 | 0.2648 | 0.2727 |
| Biomass of spike (g) | 0.4179 | 0.4786 | 0.5929 | 0.0163 | 0.1292 | 0.0162 | 0.2698 |
| Spikelets/spike | 0.4859 | 0.2576 | 0.6180 | 0.0863 | 0.2014 | 0.1277 | 0.1789 |
| Grains/spike | 0.2970 | 0.3756 | 0.7298 | 0.2095 | 0.2635 | 0.0419 | 0.1950 |
| Yield/plot (kg) | 0.4546 | 0.3510 | 0.3512 | 0.2417 | 0.5710 | 0.1580 | 0.1523 |
| 1000 grains weight (g) | 0.2599 | 0.1982 | 0.3069 | 0.1320 | 0.1736 | 0.6167 | 0.5507 |
| Hardness index (%) | 0.4164 | 0.4626 | 0.4049 | 0.0611 | 0.3496 | 0.4696 | 0.0833 |
| Diameter (mm) | 0.7032 | 0.1705 | 0.2190 | 0.4491 | 0.3791 | 0.0524 | 0.0998 |
| Grain weight (mg) | 0.7343 | 0.1491 | 0.0244 | 0.5136 | 0.3829 | 0.0882 | 0.0030 |
| Grain length (mm) | 0.1206 | 0.2321 | 0.3958 | 0.6566 | 0.1420 | 0.1635 | 0.1735 |
| Grain width (mm) | 0.3029 | 0.0874 | 0.4062 | 0.5956 | 0.0838 | 0.4614 | 0.0091 |
| Protein (%) | 0.7701 | 0.5591 | 0.0211 | 0.0095 | 0.2398 | 0.0572 | 0.0877 |
| Moisture (%) | 0.6670 | 0.2247 | 0.4568 | 0.0861 | 0.3940 | 0.0541 | 0.0636 |
| Starch (%) | 0.0772 | 0.7062 | 0.1837 | 0.4754 | 0.1409 | 0.3335 | 0.1345 |
| Gluten (%) | 0.7720 | 0.5423 | 0.0196 | 0.0162 | 0.1942 | 0.0028 | 0.2017 |
| Zeleny (%) | 0.2668 | 0.8037 | 0.3094 | 0.0760 | 0.0290 | 0.1987 | 0.0841 |
| Ash (%) | 0.2120 | 0.5573 | 0.0834 | 0.3364 | 0.2920 | 0.3290 | 0.4745 |
| Fat (%) | 0.1454 | 0.5756 | 0.1926 | 0.1053 | 0.0487 | 0.5862 | 0.4408 |
Table 7: Factor coordinates of the characters, based on correlations.
| Variety | Factor 1 | Factor 2 | Factor 3 | Factor 4 | Factor 5 | Factor 6 | Factor 7 |
|---|---|---|---|---|---|---|---|
| V1 | -1.4913 | 0.1326 | -0.5084 | 1.2486 | 2.2526 | -2.0372 | -0.1257 |
| V2 | 0.3805 | -0.4078 | 3.6637 | 0.0041 | -0.0312 | 0.0337 | -0.4830 |
| V3 | 0.8739 | -3.9838 | 1.2341 | 0.6278 | -1.7505 | 0.8094 | 0.9983 |
| V4 | -2.1716 | -1.9257 | -2.4686 | 1.9009 | -1.3477 | 0.8809 | -0.2054 |
| V5 | -1.8118 | 0.5284 | 0.6378 | 1.0296 | -1.2443 | -1.4083 | -1.4242 |
| V6 | 4.2015 | -1.7303 | -1.4104 | 0.9035 | 1.5764 | 0.9630 | -0.8992 |
| V7 | 0.7787 | 2.7522 | -1.6868 | 1.0473 | 0.4060 | 0.5659 | 1.2714 |
| V8 | 0.6417 | 1.7452 | -1.4452 | -2.1928 | -1.1115 | 0.4264 | -0.9485 |
| V9 | 4.5805 | 0.6601 | 0.7712 | -0.0722 | 0.1921 | -1.3689 | 0.8218 |
| V10 | -2.0492 | 1.7869 | 1.1709 | -0.7184 | 0.9949 | 2.2874 | 1.5306 |
| V11 | -2.4079 | -0.0634 | 0.4050 | 0.8967 | 0.5666 | -0.9860 | 1.0942 |
| V12 | -1.7672 | -2.8748 | -0.5868 | -3.3538 | 1.8040 | -0.0674 | -0.5272 |
| V13 | -0.1331 | 2.4511 | 1.0784 | 0.6150 | -0.1386 | 1.2912 | -1.9349 |
| V14 | 0.3751 | 0.9294 | -0.8549 | -1.9362 | -2.1687 | -1.3900 | 0.8318 |
Table 8: Factor coordinates of genotypes, based on correlations.
Cluster analysis
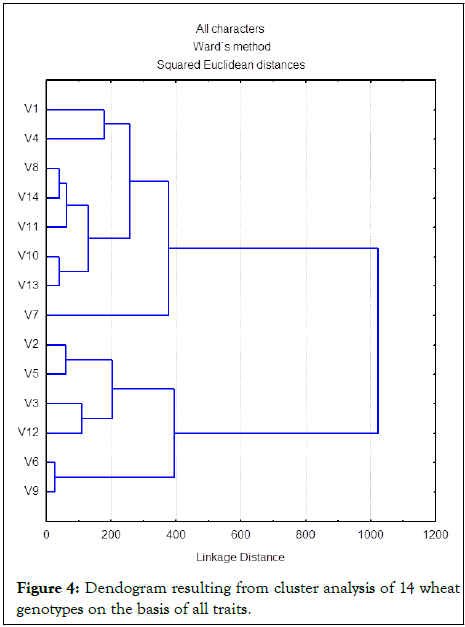
According to dendogram obtained (Figure 4) cluster analysis grouped V6 (88124) and V9 (881446) in cluster I. Cluster II carried V1 (Mairaj-08), V4 (99192), V8 (99199), V14 (Sehar-06) V10 (88148), V11 (6317) and V13 (76346). Cluster III consisted of V7 (Fareed-06) while cluster IV carried V2 (88131), V5 (88106), V3 (88132) and V12 (32862).
Cluster I carried the genotypes that indicated the lowest genetic difference among them. Cluster II carried the genotypes which had large genetic diversity. On the basis of comparison among the genotypes grouped in the same cluster it was clear that the genotypes grouped in cluster I exhibited least differences among themselves (Figure 4).

Figure 4: Dendogram resulting from cluster analysis of 14 wheat genotypes on the basis of all traits.
The number of spikes per plant for 2010-2011 for current genotypes (5-5.7) was lower than found in Indian germplasm by Kumar, et al., West Bengal germplasm by Kotal, et al., Pakistani germplasm and CIMMYT by Gulnaz, et al. The results are similar to that of determined by using principal component analysis of Maqbool, et al.
The observed variability might be due to anthropogenic, geographic and environmental factors. This information on genetic diversity of local wheat genotypes is very useful for better management of wheat gene pool and genetic enhancement of cultivars in crossing nurseries for wheat improvement and breeding programs. Moreover it helps in collection, characterization, conservation and utilization of wheat germplasm.
[Crossref] [Google Scholar] [PubMed]
[Crossref] [Google Scholar] [PubMed]
Citation: Wahid MA, Sultan T (2025) Screening of Gluten Free Wheat in Punjab Pakistan. J Nutr Food Sci. 15:57.
Received: 23-Dec-2023, Manuscript No. JNFS-23-28648; Editor assigned: 26-Dec-2023, Pre QC No. JNFS-23-28648 (PQ); Reviewed: 09-Jan-2024, QC No. JNFS-23-28648; Revised: 09-Jan-2025, Manuscript No. JNFS-23-28648 (R); Published: 16-Jan-2025 , DOI: 10.35248/2155-9600.25.15.057
Copyright: © 2025 Wahid MA, et al. This is an open-access article distributed under the terms of the Creative Commons Attribution License, which permits unrestricted use, distribution, and reproduction in any medium, provided the original author and source are credited.