Journal of Nutrition & Food Sciences
Open Access
ISSN: 2155-9600
ISSN: 2155-9600
Research Article - (2017) Volume 7, Issue 4
Laser-induced Breakdown Spectroscopy (LIBS) was used for the quantitative study of Shilajit samples using first harmonic (1064 nm) of a Q-Switched Nd:YAG laser by an appropriate detection system. The samples were chosen from the northern Himalayan mountainous range at locations namely Skardu, Gilgit, Chilas, Chitral, and Muzaffarabad. The relative concentrations of detected species were measured via integrated intensity of the strongest line of an element and via Calibration-Free CF-LIBS approach. Our findings recommend the altitudinal variations in Physico-chemical properties of Shilajit. Different functional groups were identified using Fourier Transform infrared (FTIR)-Spectroscopy. The results of LIBS were compared to results of Inductively Coupled Plasma/Optical Emission Spectroscopy (ICP/OES) with fine harmony.
Keywords: Laser-induced Breakdown Spectroscopy (LIBS); Shilajit plasma; Edible analysis; Quantitative study
Laser-induced Breakdown Spectroscopy (LIBS) is used extensively for the quantitative as well as qualitative study of different materials [1-4]. Whenever laser pulses are focused on a solid target surface, breakdown of the laser irradiated part of target occurs. Based on the properties of laser pulse, for example, energy (E), wavelength (λ), pulse duration (tp) etc., and on the physical and chemical properties of the specimen, the laser removal removes the amount of test sample fluctuating from several Nano-grams to micro-grams. At the point when nanosecond laser pulses are utilized, electrons gain a considerable segment of the pulse thereby increasing the kinetic energy. Under these circumstances hot and dense expanding plasma is generated. The radiation emitted from such plasma provides a distinctive spectral signature that facilitates the detection of elemental composition of the target. The intensities of spectral emission lines observed in the spectrum can be used to measure the relative abundance of species in the sample [5]. Literature survey report the significant work using LIBS on the elemental analysis of materials including marbles [6,7], metals and ceramics [8], vegetables [9], crystals [10], pigments [11], and plant materials [12,13]. This method has been used for the elemental analysis fertilizers [14]. Laser-induced breakdown spectroscopy has applied successfully for quantitative analysis of calcified tissue samples [15]. The detection of chromium has also been performed using LIBS [16]. This technique is found capable for the detection of Cu, Pb, V and Zn in polluted soil [17]. LIBS in conjunction with Inductively Coupled Plasma-Optical Emission Spectroscopy (ICP-OES) have been applied to determine lead in paints [18].
The present work was performed to utilize LIBS to analyze the elemental composition and relative concentration of the detected species in Shilajit occurring in Pakistan, which is used in as medicine to increase endurance, strength, and immunity. The Shilajit samples were collected from the northern Himalayan mountainous range at different locations namely Skardu, Gilgit, Chilas, Chitral, and Muzaffarabad, were converted in pellets that were exposed to laser light to record the emission spectra. The relative concentrations of the detected species in the samples were determined by integrated intensity of strongest line of an element and by calibration-free LIBS method and propose the altitudinal variation in Physico-chemical properties of Shilajit, which will be useful for its fruitful treatment in medicines for diverse maladies. Spectral analysis technique of FTIR was used to study different functional groups. The results of LIBS were compared to the outcomes of ICP/OES and were found in sound conformity. The results by means of ICP/OES were more perfect; but this methodology needed more time and sample preparation, while LIBS is easy and the results can be obtained by minimum sample preparation.
The experimental setup used is exposed in Figure 1. The laser pulse was produced using a custom made at 1064 nm of Q-switched Nd:YAG laser that was optimized to deliver 100 mJ/ pulse with a time delay of 0.4 μs. The plasmas were generated by focusing a pulsed laser onto the surface of the target placed atmospheric pressure. The laser beam was focused on the target using a Plano-convex lens having a focal length of 20 cm and diameter 30 mm. The samples were pasted on a rotating holder that was moving uniformly at the rate 6.1 mm/s using a step motor to in order to provide a fresh target surface for every laser shot and to avoid the non-uniform pitting of the target surfaces. In order to avoid ambient gas breakdown, we have gone through many pre- tests to find out the optimum point for placing the focusing lens. The distance between focusing lens and target was optimized by investigating the effect of its separation on the quality of spectra. In our case it was ~18 cm.

Figure 1: Schematic diagram of the experimental setup.
The emitted radiations from the plasma were collected by a fiber optics (high-OH, core diameter: 600 μm) having a collimating lens (0º–45º field of view) placed perpendicular to the direction of laser beam. From the spot diameter of ~102 μm, laser fluence was approximated to be 40 J/cm2. The pulse energy was measured with a calibrated Joule meter (Quantel NOVA-QTL, USA). The light radiated from plasma flash was collected by a collimating lens utilizing UV graded fused silica 1 meter, multimode sampling fiber of focal length ~0.4 m and spectral resolution  with SMA connector and is transferred to a broadband spectrometer (LIBS2500+, Ocean Optics, Inc., USA).
Our LIBS2500+ was equipped with seven HR2000 high resolution (FWHM ≈ 0.1 nm) miniature spectrometers in 200-900 nm wavelength range. The integration time of the detector was set to be 2.1 ms and the time interval between the laser pulse and the start of spectrum recording (opening of the detector) was optimized and set 2 μs. To display the data in the form of spectrum, built-in software was used. In order to get the best signal-to-noise (S/N) ratio, each spectrum was recorded using a single laser shot and output data were averaged of twenty laser shots. Our LIBS system was calibrated by recording the well-known lines of neon and argon with an uncertainty of ~0.02 nm. The collected samples were first converted into pellets by putting 10 gm of each sample in a dye and pressing them by applying a load of 10 tons for 20 min in the dimensions ~4 × 6 cm and a thickness of ~2 cm and were pasted on target stand for ablation.
For analysis of Shilajit using ICP/OES, the samples were dissolved in concentrated HNO3 and allowed to stand for 24 h. 10 mm of HClO4 were added to the mixture heated in range (280 and 300ºC). The liquid solution was analyzed by ICP-spectrometer (Optima 2100-DV; Dual View, PerkinElmer). The ICP spectrometer was calibrated to detect in organic elements only that is why Carbon was not detected using ICP analysis.
For the Infrared spectra, ∼2 mg of the samples were blended with ≈100 mg KBr (potassium bromide) in a clean glass grinder and mortar and pressed together to convert them into pellets of thickness ~0.78 mm. The pellets were then treated using FTIR-spectrometer (Perkin- Elmer Spectrum GX).
Locations of samples collection
The Shilajit samples were collected at different locations from the Himalayan mountainous ranges in Pakistan. The collected Shilajit samples and their locations are tabulated in Table 1.
| Samples locations | Samples names | Height from sea level (meters) |
|---|---|---|
| Skardu | S1 | 2438 |
| Gilgit | S2 | 1500 |
| Chitral | S3 | 1100 |
| Chilas | S4 | 915 |
| Muzaffarabad | S5 | 724 |
Table 1: Locations of collected Shilajit samples versus Height from sea level.
Studies of optical emission lines
In the first phase of this experimental work, we recorded the spectral emissions during cooling and recombination phase of plasma generated by Q-switched Nd:YAG laser at 1064 nm. The emission spectra of S1, S2, S3, S4, and S5 are shown in Figures 2-6. Careful study of the spectrum via the National Institute of Standards and Technology (NIST) spectral atomic data-base exposed the existence of neutral and ionic lines of aluminum, magnesium, calcium, iron, sulphur, and neutral carbon, potassium, lithium, silicon, sodium, oxygen, phosphorous, nickel, manganese, and hydrogen. The presence of hydrogen and oxygen line is due to water in air and the samples. Furthermore, the analysis was verified via the comparison of LIBS spectra of Shilajit with individual LIBS spectra of the pure elements.

Figure 2: (a-d) LIBS emission spectrum of sample S1 covering spectral range 230-780 nm.

Figure 3: (a-d) LIBS emission spectrum of sample S2 covering spectral range 230-780 nm.

Figure 4: (a-d) LIBS emission spectrum of sample S3 covering spectral range 230-780 nm.

Figure 5: (a-d) LIBS emission spectrum of sample S4 covering spectral range 230-780 nm.

Figure 6: (a-d) LIBS emission spectrum of sample S5 covering spectral range 230-780 nm.
Statistical analysis
Statistical investigation was carried out to study the consistency between the results of LIBS and ICP-spectroscopy. Student’s t-test analysis was performed on the acquired spectrum. The analysis showed that the results were statistically consistent (t-test at p>0.05).
The agreement between the results using LIBS and standard technique was studied via performing the statistical correlation test on the acquired results (Figures 7-9).

Figure 7: Lorentzian fitted profile to the experimentally data of Ca I spectral emission at 422.67 nm corresponding to (3p6 4s2 1S0→3p64s4p1P01) transition.

Figure 8: Typical Boltzmann plot for Ca I lines in S2 at 1064 nm having
energy of 100 mJ/pulse.

Figure 9: (a-c) Comparison between concentrations of elements in Shilajit using two LIBS calibration approaches and ICP/OES.
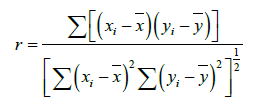
The linear correlation coefficient was estimated using relation:
 (1)
(1)
Where, r is called correlation factor (-1 ≤ r ≤ 1).
Quantitative measurement
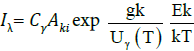
The atomic line’s integrated intensity of a particular element can be used to measure its abundance in a sample [1,14,19,20]. To determine the relative concentration of different elements there in Shilajit, two calibration techniques were utilized. In the first technique, we selected the strongest line of each element whose integrated intensities were used to extract the relative concentrations in the samples. We used the following lines: Al at 237.3 nm, C at 247.8 nm, Ca at 422.67 nm, Fe at 440.4 nm, K at 766.4 nm, Li at 670.7 nm, Mg at 285.2 nm, Mn at 403.07 nm, Na at 588.9 nm, Ni at 341.4 nm, P at 253.5 nm, S at 675.7 nm and Si at 288.16 nm. The relative abundance (%-age) of elements measured by this formula in Shilajit samples are tabulated in Table 2 and plotted in Figure 9.
| Sample No. | Elements | CF-LIBS | LIBS(strongest line) | ICP/OES | Sample No. | Elements | CF-LIBS | LIBS(strongest line) | ICP/OES |
|---|---|---|---|---|---|---|---|---|---|
| Sample 1 | Al | 5 | 4.5 | 4 | Sample 3 | Mg | 4 | 3.4 | 3 |
| C | 10 | 9 | ND | Mn | ND | ND | ND | ||
| Ca | 19 | 18.3 | 18 | Na | 4 | 3 | 2.7 | ||
| Fe | 8.04 | 7 | 6.2 | Ni | ND | ND | ND | ||
| K | 13 | 12 | 11.5 | P | 14 | 14.3 | 13.8 | ||
| Li | 8 | 7 | 6.7 | S | 5.0.0 | 4 | 4.3 | ||
| Mg | 6 | 5.04 | 5.04 | Si | 5 | 3.5 | 3 | ||
| Mn | 3 | 2.5 | 2 | Sample 4 | Al | 2 | 1.5 | 1 | |
| Na | 2 | 1.98 | 1.5 | C | 6.6 | 6 | ND | ||
| Ni | ND | ND | ND | Ca | 15 | 14.43 | 14 | ||
| P | 3 | 2.54 | 2 | Fe | 3.5 | 3 | 2.6 | ||
| S | 5 | 4.42 | 4 | K | 9 | 8.4 | 8 | ||
| Si | 1.8 | 1.6 | 1.4 | Li | ND | ND | ND | ||
| Sample 2 | Al | 3 | 2.53 | 2 | Mg | 3.5 | 3.2 | 2.7 | |
| C | 9 | 8 | ND | Mn | ND | ND | ND | ||
| Ca | 18 | 17 | 16.3 | Na | 4.7 | 4.3 | 4.5 | ||
| Fe | 7 | 6.3 | 5.6 | Ni | ND | ND | ND | ||
| K | 12 | 12.5 | 11 | P | 15 | 14.5 | 14.1 | ||
| Li | ND | ND | ND | S | 6 | 5.5 | 5 | ||
| Mg | 5 | 4 | 3.4 | Si | 4.5 | 4 | 3.7 | ||
| Mn | ND | ND | ND | Sample 5 | Al | 1.57 | 1 | 0.57 | |
| Na | 3 | 2.5 | 2 | C | 5 | 4.5 | ND | ||
| Ni | ND | ND | ND | Ca | 13.78 | 13.5 | 13 | ||
| P | 10 | 9.1 | 11 | Fe | 2.53 | 2 | 1.7 | ||
| S | 4 | 3.2 | 8.7 | K | 8.42 | 8 | 7.7 | ||
| Si | 5 | 4 | 3 | Li | ND | ND | ND | ||
| Sample 3 | Al | 2.5 | 2 | 1.7 | Mg | 2.5 | 2 | 1.59 | |
| C | 7 | 7 | ND | Mn | ND | ND | ND | ||
| Ca | 16.8 | 15.5 | 15 | Na | 5 | 4.6 | 4 | ||
| Fe | 5 | 4.3 | 4 | Ni | 1.66 | 1.3 | 1 | ||
| K | 10.3 | 8.4 | 9 | P | 15.7 | 15.2 | 15 | ||
| Li | ND | ND | ND | S | 6.7 | 6.4 | 6 | ||
| Si | 5 | 4.7 | 4.2 |
ND: Not Detected
Table 2: Table showing the relative abundance of detected elements using LIBS and ICP/OES.
The second approach was calibration-free LIBS. This strategy does not require standard sample curves. The detail of this method has been presented in the literature [9,21]. This technique is based on supposition of Local Thermodynamic Equilibrium (LTE) and Optically Thin Plasma (OTP).
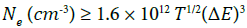
McWhirter criterion is one of the conditions for LTE is given [22,23]:
 (2)
(2)
Where Ne is the electron number density, T gives the average plasma temperature, and ΔE gives the energy difference between upper and lower levels.
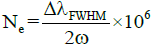
To verify the existence of LTE, the Ne was measured with the Stark-broadened line profile of the Ca-I line at 422.67 nm (Figure 3). The full width at half-maximum (FWHM) (Δλ1/2) of the line profile was 0.282(5) nm. The electron density was determined using the relation as:
 (3)
(3)
Where the term ω is called electron impact parameter and its value is taken from Griem [24]. For S1, the value of electron density was (5.8 ± 0.09 × 10¹⁷) and measured electron temperature via the Boltzmann plot method was 77.50 ± 620 K. After putting the plasma temperature and ΔE (eV) for the Ca I at 422.6 nm in equation (2), the resultant value was smaller than the value of electron density measured using equation (3). This verifies the LTE condition. The values electron densities for samples S2, S3, S4 and S5 are: Ne= 5.4 ± 0.09 × 10¹⁷, and Ne=5.1 ± 0.08 × 10¹⁷, Ne=5.0 ± 0.08 × 10¹⁷, Ne=5.2 ± 0.08 × 10¹⁷, respectively. The plasma temperatures for S2, S3, S4, and S5 are 7849 ± 627 K, 7700 ± 616 K, 7520 ± 670 K, and 7600 ± 530 K respectively. The measured electron densities (for sample-2, 3, 4, and 5) were also tested for McWhirter criteria and got verified.
The plasma is assumed to be optically thin, if the ratio of intensity of two non-interference emission lines from a species of same upper level and the ratio of their corresponding transition probabilities with-in the experimental uncertainty have the same values [25,26]. For this purpose, we compared the ratio of Ca I and Mg I lines to the ratio of their corresponding transition probabilities via NIST database. The ratio of Ca I at 428.94 nm/at 429.90 nm was 1.23 whereas; the ratio of their transition probability was 1.29. Similarly, the ratio of Mg I at 382.9 nm/at 383.2 nm was 1.33 and the ratio of corresponding transition probabilities was 1.39. This uniformity in the ratios between the intensity and their transition probabilities clearly declares the plasma is optically thin. Under LTE assumption, the line intensity of constituents present in target sample corresponding to a transition between levels Ek and Ei of the atomic species γ is
given by:
 (4)
(4)
where Cγ is the concentration of emitting element, G is called the experimental factor, Ek and gk are the upper level’s energy and statistical weights, T gives the plasma temperature (average), Aki stand for transition probability, and Uγ gives the partition function of emitting elements and is given as:
 (5)
(5)
Taking log of equation (4), and using the definition as below, where, 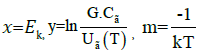
 (6)
(6)
We obtained the linear relationship as:
 (7)
(7)
This is a graphical illustration of Boltzmann plot. We measured the plasma temperature using its slope m. In Figure 8 a typical Boltzmann plot is shown for Ca-I emission lines whose linear fit displays a correlation coefficient close to unity.
After calculating partition function for each known elements (using Equation 5), and the plasma temperature, the experimental factor G may was estimated via normalizing the sum of the species abundances:
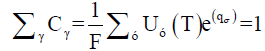 (8)
(8)
Hence
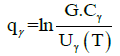
 (9)
(9)
qγ is the intercept of the straight line of the Boltzmann plot (Equation 7) which is proportional to the logarithm of the concentration of species times by the factor G. After the determination of partition function Uγ(T), the experimental factor G, and the intercept qγ (through Boltzmann plot method), we used Equation 6 to estimate concentration Cγ of every elements. For the relative concentration, the concentration of each element was divided by the total concentration of all elements. The relative concentration or abundance of the species acquired through calibration-free LIBS is exposed in Figure 5a-5c.
Mutual comparison of relative concentration using LIBS and ICP/ OES of the detected species in Shilajit samples was exposed in Figure 9. Carbon and calcium has increasing tendency, which may be a result of constant carbon inputs and decrease in rate of carbon loss or may be due to Carbon sequestration in soil [27]. The phosphorous content diminishes with the altitude [28]. Similar to carbon and calcium, aluminum also shows expanding pattern with height [29]. Manganese and iron also increase with altitude. Additionally, in some regions Li, Mn, and Ni were not detected because of low concentration and were below the detectable range of our experimental setup. Furthermore, silicon was available in low amount in all the gathered samples. As the Shilajit from more height contains more aluminum, calcium, magnesium and potassium, therefore Shilajit collected from the more heighted location may be useful for keeping strong muscle, strong bones, and maintaining blood pressure normal as well as for heart rhythm problems. It may also be helpful in reducing the problems of kidney stone [30-33]. On the other hand Shilajit from lower altitude may be helpful in keeping balance hormonal and digestion process [34,35] helpful in the formation of protein. In the same way, it may use to contract muscle and maintain the body’s fluid and electrolyte balance [31], due to abundant amount of Phosphorous present in the Shilajit acquired from lower altitudes. Carbon was not detected using ICP-analysis in all of the collected samples because ICP spectrometer was able to detect in-organic metals only.
The FTIR spectroscopy was performed in base line range from 3500-500 cm-1 for of all the acquired samples. The representative FTIR spectrum of S2 was exposed in Figure 10. The Shilajit samples were characterized by relatively few broad bands. The spectrum reveals a broadband region of 3450 cm-1 to 3350 cm-1 due to the vibration of hydrogen bonded hydroxyl of the phenolic functional group. The appearance of the band at 2952 cm-1 may be credited to the stretching of aliphatic carbon and hydrogen. The Peak at 1000 cm-1 may be due to Si-OR. The range 2280 cm-1 to 2440 cm-1 corresponds to phosphene. Weak bands in the region of 1644 cm-1 and 1411 cm-1 may be attributed to the aromatic carbon-carbon double bond, H-bonded C=O and O-H bending vibrations of COOH (carboxylic) and OH (alcohols) respectively.

Figure 10: Representative FTIR spectrum of sample S2.
Diminishing peak tendency at 1054 cm-1 may be indorsed to the OH deformations of (COOH) carboxyl groups. Similarly, the Peak at 713 cm-1 may be ascribed to Calcite. The vagueness of the peaks suggests the presence of lower molecular weight compounds due to the chemical breakdown of animal and plant remains under specific geothermal conditions leading to the generation of lignin, protein, and polyphenols along with lipids. All these findings were strongly supported by the already documented literature. Similar is the case for other Shilajit samples. In the present work, ICP/OES was used as a standard method. Figure 5 shows that the relative concentration acquired via the integrated line intensity of the strongest peak for every element gives the outcome close to that of the ICP/OES study with exceptions of carbon. These experimental findings were verified using statistical correlation test.
Spectroscopic analysis of the collected Shilajit samples was performed using LIBS. The elements like Al, C, Ca, Fe, K, Li, Mg, Mn, Na, Ni, P, S and Si was detected. Our findings suggest the altitudinal variations in Physico-chemical properties of Shilajit. Elements like Al, C, Ca, Mg, Mn and Fe showed an increasing trend with altitude whereas, Na, Ni, P, S have decreasing tendency with respect to the height from ground level. The elements Li, Mn, and Ni were below the detectable range of our experimental setup for some locations. The altitudinal variations of observed elements were due to atmospheric and soil properties. To identify different functional groups, we used FTIR-Spectroscopy. These measurements confirm that the relative concentration using the strongest line of an element provide values were in good comparison to the results obtained with ICP/OES that yields a high correlation factor. The results show that LIBS is fast and reliable method for food classification and detection of food contents.