Journal of Nutrition & Food Sciences
Open Access
ISSN: 2155-9600
ISSN: 2155-9600
Research Article - (2018) Volume 8, Issue 5
Keywords: Bread; Whole wheat; Bambara groundnut; Acceptability; Enriched bread
Bread is a staple food and is consumed in large quantities because it is affordable, is an excellent source of nutrients and is available in a “ready to eat” form [1]. Wheat, the basic ingredient in bread making and is one of the most important crops grown round the world; however it cannot be grown in all bread consuming areas hence it may need to be imported making it relatively expensive according to the reports of [2]. Before now, imported wheat flour has been the only kind of flour used in bread production in Nigeria. However, over the years, in response to the increase in the price of wheat, reports have been published on successful composite bread technology with indigenous crops like kidney bean, soybeans, plantain, cocoyam, sweet potato, breadfruit etc. [2-7]. Utilization of these composite flours would reduce the demand for imported wheat; conserve foreign reserves [4] and widen the utilization of indigenous crops in food formulation and hence improve the nutritional quality of the products [5].
Whole wheat is one of the most important staple foods for humans [4]. It has been shown that the whole grain is a concentrated source of essential nutritional components such as vitamins, minerals, protein, fat and fibre while the refined grain is mostly starch [8]. The consumption of whole wheat food products is currently receiving attention in view of the health benefits as a good source of minerals and fiber [4]. The potentials of whole wheat and inexpensive good protein source such as Bambara groundnut in bread making have not yet been tapped.
Moreover, formulation of foods from low-lysine staples such as grains fortified with legumes has been proposed as a practical and sustainable approach to improving the protein nutritional value of foods for vulnerable people in developing countries [9] and especially in famine and war situations where there is the need to provide a one stop whole meal with all the required nutritional components that will cater for dire nutritional needs of both the young and elderly victims [9].
Bambara groundnut is a legume species of African origin and is widespread south of the Sahara [10]. Food legumes have a major role to play in the fight against malnutrition. It is therefore necessary that their levels of consumption, which are already too low in a number of developing countries, should be increased [10]. Legumes serve as a source of protein to a large proportion of the population in the poor countries of the world by being the least expensive and easily stored and transported non-processed protein source. Therefore, the objective of this study was to produce acceptable enriched bread from whole wheat grain and Bambara groundnut.
Source of raw materials
Wheat flour, Bambara groundnut and other ingredients were purchased from Wurukum market Makurdi, Benue State, Nigeria.
Preparation of raw material
Bambara groundnut flour: Bambara groundnut seeds (Bukina) were sorted and the bean soaked for 24 h in distilled water and dehulled manually. The seeds were further boiled for 10 min (1:4 beans to water ratio); in a stainless steel pot, drained and dried at 50°C in an air circulating oven for 9 h. The dried samples were milled and sieved into flour using 0.25 mm sieves [2].
Whole wheat flour preparation: The whole wheat was processed using the method described by [11]. The wheat grain was sorted to remove dirt and foreign materials, washed to remove dust. The washed grain was drained to remove excess water, after draining; the grain was placed in laboratory oven for drying at 600°C for 6 h. The dried grain was milled to flour using the hammer milling machine, the flour was sieved using a 500 μm aperture sieve to obtain fine flour.
Formulation of composite flour blends: The blends of Bambara groundnut whole wheat flour were prepared with increasing level of Bambara groundnut 0, 10, 20, 30 and 40% addition in whole wheat flour. The flours were thoroughly mixed to obtain a homogenous blend. The samples were stored at (ambient temperature 30 ± 2°C) in air tight container and labeled until needed for bread production.
Method of bread production: The bread samples were produced using the straight-dough method described by [11]. The baking formula was 500 g of flour blend, 10 g of compressed baker’s yeast, 5 g of salt, 80 g of cane sugar, 40 g of vegetable shortening and approximately 380 ml of water. All the ingredients were mixed in a Kenwood mixer (Model A 907 D) for 3.5 min. The doughs were fermented for 90 min at 28°C ± 1°C then punched, scaled to 250 g dough pieces, proofed for 90 min at 30°C, 85% relative humility and baked at 250°C for 30 min.
Methods of analysis
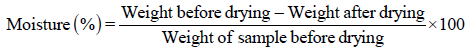
Determination of the proximate composition of bread: Protein, fat, moisture and ash were determined using the Association of Official Analytical Chemists [12]. Nitrogen content was determined using the micro-Kjeldahl procedure. Briefly, zero point five gram (0.5 g) food sample was weighed, heated and digested using conc. sulphuric acid with the aid of catalyst mixture. The digest was neutralized with alkali and distilled into a boric acid solution. The borate anions formed are titrated with standardized acid, which is converted to nitrogen in the sample.
The protein content was calculated by this formula:
 (1)
(1)
Crude protein = % total Nitrogen × 6.25 (2)
Titer = Final burette reading - Initial burette reading
N = Normality of acid
DF = Dilution factor
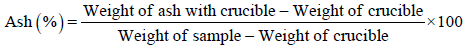
The moisture was determined using the oven method. The ash was determined using the muffle furnace. The moisture and ash were calculated using the formula:
 (3)
(3)
 (4)
(4)
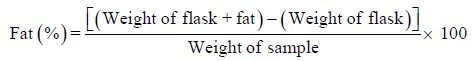
Soxhlet method was used to determine fat content. It was calculated as:
 (5)
(5)
The dietary fiber was determined according to the procedure of AOAC, Method 7.504. Briefly, Samples were defatted with petroleum ether and digested with tetra oxosulphate (vi) acid solution; it was filtered and washed with water. The residue was then boiled with NaOH solution to saponify the fat components. The washed residue was incinerated, cooled and weighed.
 (6)
(6)
The carbohydrate content was calculated by difference as described by [13]. This method involved adding the total values of crude protein, fat, crude fiber, moisture and ash constituents of the sample and subtracting it from 100.
Determination of minerals: Iron and phosphorous were determined calorimetrically [14]. Calcium was determined titimetrically following precipitation as calcium oxalate as described by [15]. Phosphorus in the samples was determined according to [16]. Sodium and Potassium were determined by flame photometric method as described by [15].
Determination of physical properties of bread: Loaf weight: The loaf weight was determined by weighing the bread loaves 20 min after baking, using the laboratory weighing scale and the reading recorded in grammas as described by [17].
Loaf volume: The loaf volume was determined by using rape seed displacement method as described by [17]. This was done by loading 3000 ml of sorghum grains into a calibrated container, mark until it reached the marked level and unloaded back, the bread sample was put into the container and the measured sorghum was loaded back again, the remaining sorghum gains left outside the container was measured using measuring cylinder and recorded as loaf volume in cm3.
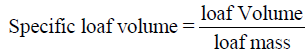
Specific loaf volume: The specific volume (volume to mass ratio) (cm3 /g) was thereafter calculated as described by [17].
 (7)
(7)
Loaf Height: The bread height was determined by using a measuring rule.
Oven spring: The oven spring of the dough was determined by using a measuring rule.
 (8)
(8)
Functional properties of composite flour of whole wheat and Bambara groundnut
Bulk density: Bulk density of sample was determined by a method of potter [18], 10 ml of capacity graduated measuring cylinder was gently fill with the composite flour the cylinder was gently tap, on the laboratory bench for several times until there is no further diminution of the sample level after filling to the 10 ml mark.
 (9)
(9)
Water absorption capacity: The water absorbing capacity of flour was evaluated by methods of [19]. The water absorption capacity of flour blends was determined, 1 g of sample was weighed into conical graduated centrifuge tube, using a warring whirl mixer, the sample were mixed thoroughly with 10 ml of distilled water in a centrifuge tube for 20 minutes. The water absorption capacity was calculated:
 (10)
(10)
Oil absorption capacity: Sample (1 g) was mixed with 10 mL of vegetable oil in pre-weighed centrifuge tube, the tube was stirred for 1 min for complete dispersion of sample in the oil, after 30 min of holding time at room temperature, and the sample was centrifuged at 2000 rpm for 20 min. The separated oil was then removed using a pipette and tube was inverted on oil absorbent paper for 25 min to drain the oil prior to reweighing [19].
 (11)
(11)
Swelling index: The swelling index was determined using the method of [16]. 10 g of sample was weighed into a 100 ml graduated cylinder with the dry bulk volume noted and 100 ml of hot water at 70°C was mixed, the volume after 10 minutes was recorded and the swelling index was calculated.
 (12)
(12)
Foam capacity and foam stability: Foaming capacity was determined by the method of [19]. 2 g of flour sample was blend with 100 ml of distilled water in a warring blender, the suspension as whipped at 1600 rmp for 15 minutes. The mixture was poured into a 250 ml measuring cylinder and the volume after 30 s was recorded. Foam capacity was expressed as percentage increase in volume.
 (13)
(13)
The foam volume was recorded after whipping to determine the foam stability according to [16].
 (14)
(14)
Sensory evaluation of samples of bread from whole wheat and Bambara groundnut: Sensory evaluation of the bread samples was carried out after 2 h of bread production by 20 panelists [13]. The panelists comprise of research scholars and post graduate students in the Department of Food Science and Technology. A 9 – point hedonic scale was used for sensory evaluation. The samples were presented in random order and panelists were asked to rate their assessment of crumb color, crust color, aroma, taste, texture, mouth feel and overall acceptability on a 9-point hedonic scale (1=dislike extremely and 9=like extremely). A score of 5 or below was considered a limit of acceptability for all sensory attributes tested.
Statistical Analysis
Data obtained were subjected to analysis of variance (ANOVA) as described by [20]. Least significance different (LSD) test was used to separate means where significant difference existed at P<0.05.
Proximate composition of bread samples from whole wheat and Bambara groundnut
The proximate composition of the bread is presented in Table 1. There was significant difference among samples in all the parameters being determined. Sample E with 40% Bambara groundnut flour has the highest moisture value of 20.95%. It was followed by sample D with 30% Bambara groundnut composition with moisture value of 19.45%. The sample with the least moisture content was sample a (control) with a moisture content of 17.00%. The result indicated that Bambara groundnut flour confer hydrophobic ability to wheat. The values reported compares favorably with 16.85% to 22.50% values reported by [21]. The moisture contents of the samples were generally low (17.00- 20.95%). The low values are advantageous [22]. Reported that low moisture content is required to prevent growth of micro-organisms.
| Samples | Moisture (%) | Fibre (%) | Ash (%) | Fat (%) | Protein (%) | Carbohydrate (%) |
|---|---|---|---|---|---|---|
| A | 17.00e ± 0. 31 | 1.01e ± 0.04 | 1.71e ± 0.05 | 1.78e ± 0.22 | 8.65e ± 0.18 | 69.85a ± 0.09 |
| B | 18.85d ± 0.22 | 1.31d ± 0.02 | 1.77d ± 0.03 | 2.04d ± 0.03 | 13.34d ± 0.11 | 62.69b ± 0.43 |
| C | 19.19c ± 0.20 | 2.50c ± 0.57 | 2.23c ± 0.03 | 2.15c ± 0.02 | 15.16c ± 0.02 | 58.85c ± 0.84 |
| D | 19.45b ± 0.25 | 2.72b ± 0.02 | 2.39b ± 0.02 | 2.22b ± 0.15 | 17.24b ± 0.11 | 56.00d ± 4.94 |
| E | 20.95a ± 0.35 | 2.77a ± 0.01 | 2.44a ± 0.03 | 2.38a ± 0.04 | 18.41a ± 0.02 | 53.05e ± 0.09 |
| LSD | 0.035 | 0.026 | 0.043 | 0.032 | 0.027 | 0.026 |
Values are means ± standard deviation of Duplicate determinations. Values followed by the same superscript(s) within the column are not significantly (P>0.05) different.
Key: A= control 100% wheat flour, B = 90% Wheat flour and 10% Bambara groundnut flour, C = 80% Wheat flour and 20% Bambara groundnut flour, D = 70% Wheat flour and 30% Bambara groundnut flour, E = 60% Wheat flour and 40% Bambara groundnut flour.
Table 1: Effect of bambara groundnut flour on the proximate composition of bread from whole wheat flour.
The ash content increased from 1.71% - 2.44% with increased in Bambara groundnut in the blends formulation. Ash content indicates the level of mineral in a food compare with other results. The fibre content also differed among samples, sample E containing 40% Bambara groundnut and D containing 30% Bambara groundnut were highest in fibre content and did not differ at P>0.05, they were followed by sample C containing 20% Bambara groundnut. The sample least in fibre is sample a containing 1.01% fibre. There was increase in protein with increase in Bambara groundnut blend. Sample E has the highest protein value of 18.41%, followed by sample D with 17.24% and the least was sample A with 8.65% protein content. The increased in protein is as expected. Bambara groundnut contains 18- 24% protein while wheat was reported to contain 11-12% protein [21]. The increased could be attributed to the addition effect. The increased in protein content would be useful in eliminating the challenges of protein deficiencies among all age groups especially in areas where many people can hardly afford proteins foods because of the high cost [21]. There was also clear increase in the fat content of the product with increase in Bambara groundnut. Sample E was the highest with 2.38% fat content, it was followed by sample D with 2.22% fat content and the sample with the least fat content was sample A with 1.78% fat content. The carbohydrate value differed among samples, sample A contained 69.85% which was the highest, it was followed by sample B with 62.69%, and sample E was the least in carbohydrate content with 53.05% value. The decreased in carbohydrate is as expected. Cereals contain higher amount of carbohydrate than legume such as Bambara groundnut [23]. The decrease in carbohydrate with increase in Bambara groundnut could be as a result of dilution effect of Bambara groundnut in the bread samples.
Mineral composition of the bread samples from whole wheat and Bambara groundnut
The mineral content of the bread samples are presented in Table 2. The result showed that there was significance difference among samples in the parameters, although all the minerals increased with increased in the level of substitution of wheat flour with Bambara groundnut at 5% confidence level. Sodium value for sample E was the highest value of 96 20 mg/100 g it was followed by sample D with 82.30 mg/100 g and sample C has 73.60 mg/100 g and yet the two samples showed no significance difference at p>0.05. Then sample B with 65.24 mg/100 g and sample E with 23.18 mg/100 g. Potassium content shows there was an increased from 421.25 mg/100 g to 824.26 mg/100 g. Calcium increased from 50.32 mg/100 g to 79.05 mg/100 g. Phosphorus increased from 323.81 mg/100 g to 640.71 mg/100 g. Iron increased from 1.10 mg/100 g to 4.62 mg/100 g. The increased in all the minerals could be attributed to addition effect [24]. [24] reported that Bambara groundnut is rich in mineral element. This result is in accordance with the report of [25]. [25] reported that mineral are essential nutrients that are needed in the body to facilitate proper functioning of certain organs. Therefore, the bread samples are rich in these nutrients and could promote the health of both children and adults.
| Samples | Sodium | Potassium | Calcium | Phosphorus | Iron |
|---|---|---|---|---|---|
| A | 23.18e ± 0.02 | 421.25e ± 0.33 | 50.32e ± 0.23 | 323.81e ± 0.04 | 1.10e ± 0.04 |
| B | 65.24d ± 0.01 | 521.90d ± 0.42 | 61.28d ± 0.32 | 328.35d ± 1.49 | 3.29d ± 0.02 |
| C | 73.60c ± 0.06 | 623.39c ± 0.58 | 68.30c ± 0.32 | 432.60c ± 0.30 | 4.34c ± 0.03 |
| D | 82.30b ± 0.01 | 723.47b ± 0.58 | 72.56b ± 0.23 | 537.60b ± 1.65 | 4.41b ± 0.01 |
| E | 96.20a ± 0.06 | 824.26a ± 0.61 | 79.04a ± 0.32 | 640.71a ± 0.02 | 4.62a ± 0.03 |
| LSD | 0.041 | 0.032 | 0.036 | 0.034 | 0.047 |
Values are means ± standard deviation of Duplicate determinations. Values followed by the same superscript(s) within the column are not significantly (P>0.05) different.
Key: A= control 100% wheat flour, B=90% Wheat flour and 10% Bambara groundnut flour, C=80% Wheat flour and 20% Bambara groundnut flour, D=70% Wheat flour and 30% Bambara groundnut flour, E=60% Wheat flour and 40% Bambara groundnut flour
Table 2: Effect of bambara groundnut flour on the mineral composition (mg/100 g) of bread from whole wheat flour.
Functional properties of the flour blends of whole wheat and Bambara groundnut
The functional properties of the flour blends of whole wheat and Bambara groundnut are presented in Table 3. The result shows that addition of Bambara groundnut to whole wheat flour significantly (P<0.05) increase the water absorption capacity (WAC) of the composite flours. This observation suggests that the hydrophilic constituents like carbohydrates which are less in Bambara groundnut than whole wheat did not contribute very much to higher WAC in the blends. WAC is not mainly dependent on the amount but on the nature of hydrophilic constituents and also to some extend the pH and protein denaturation [26]. Similar increase in WAC was reported for maize Bambara groundnut blend for kpekele production [27].
| Samples | Water Absorption (ml/g) | Oil Absorption (ml/g) | Bulk Density (g/cm3) | Foaming Capacity (Cm3) | Foaming stability (Cm3) | Swelling Index (ml/g) |
|---|---|---|---|---|---|---|
| A | 0.71d ± 0.16 | 0.92a ± 0.04 | 0.96d ± 0.17 | 19.86e ± 1.14 | 14.37e ± 1.63 | 3.60a ± 0.44 |
| B | 0.77c ± 0.08 | 0.89b ± 0.02 | 0.97c ± 0.10 | 23.10d ± 0.26 | 14.59d ± 0.24 | 2.80b ± 0.08 |
| C | 0.77c ± 0.23 | 0.83c ± 0.02 | 0.98c ± 0.02 | 23.61c ± 1.30 | 15.47c ± 1.30 | 2.66c ± 0.14 |
| D | 1.02b ± 0.08 | 0.81c ± 0.12 | 1.00b ± 0.07 | 26.44b ± 0.28 | 16.53b ± 0.79 | 2.50d ± 0.20 |
| E | 1.06a ± 0.02 | 0.73d ± 0.04 | 1.01a ± 0.04 | 26.60a ± 0.34 | 16.78a ± 0.25 | 2.40e ± 0.20 |
| LSD | 0.021 | 0.03 | 0.011 | 0.032 | 0.033 | 0.022 |
Values are means ± standard deviation of Triplicate determinations. Values followed by the same superscript(s) within the column are not significantly (P>0.05) different.
Key: A=control 100% wheat flour, B=90% Wheat flour and 10% Bambara groundnut flour, C=80% Wheat flour and 20% Bambara groundnut flour, D=70% Wheat flour and 30% Bambara groundnut flour, E=60% Wheat flour and 40% Bambara groundnut flour.
Table 3: Effect of bambara groundnut flour on the functional properties of whole wheat flour for bread production.
According to [26,28], high water absorption capacity can be attributed to lose structure of starch polymers while low value indicates the compactness of the structure since Bambara groundnut is proteinous.
The oil absorption capacity (OAC) revealed that there were significant (P<0.05) differences among the samples. The oil absorption capacity of the samples ranged from 0.73 to 0.92 mL/g. Sample E had the least oil absorption capacity of 0.73 mL/g. The low oil absorption capacity recorded for sample E could be due to the presence of hydrophilic group from the Bambara groundnut flour. OAC of wheat flour in this study (1.55 mL/g) is slightly lower than that (1.61 mL/g) reported for wheat flour [29]. Protein concentration and their conformational properties in foods also influence fat absorption. It has also been reported that variations in the content of non-polar side chains which might bind the hydrocarbon side chains of oil, explains why there might be a differences in the oil binding capacity of flours. The ability of the proteins of this flour blends to bind oil and makes them useful in food systems where oil imbibition’s is desired. The flours could, therefore, have functional uses in foods such as sausage production. The high oil absorption capacity also makes the flours suitable in facilitating enhancement in flavor and mouth feel when used in food preparations.
The bulk densities correlate negatively with oil absorption capacities (OAC). The samples with higher OAC had lower bulk density and vice versa. The result is in agreement with the result of Iwe MO et al. [30]. They attributed the increase and bulk density of sweet potato and soy flour blend to direct influence of protein content. Higher values of bulk densities 2.45 and 2.46 g/ml were reported by Agunbiade SO et al. [31] for breakfast cereals made from maize sorghum African yam bein and soybeans. The bulk densities suggest that the samples may require different package space and material. The more packaging space is required the less the bulk density [31]. On the other hand, the higher the bulk density, the less packaging space and more rigid the packaging material. Variations in bulk densities can result due to variations in particle size and other factors such as expansion ratio, wall support and presence of oil [31].
Foam capacity of protein refers to the amount of interfacial area that can be created by the protein. Foam is a colloidal of many gas bubbles trapped in a liquid or solid. Small air bubbles are surrounded by thin liquid films [32]. Values of the foam capacity of the sample ranged from 19.86 to 26.44 cm3 with sample E having the highest and sample a having the lowest foam capacity. There was a significant (P<0.05) difference between the control sample and the other samples. Higher foaming capacity may be due to highly hydrated foam and increase in foaming stability due to protein denaturation [33]. Foam capacity improves the textural consistency of foods. Good foam capacity is a desirable attribute for flours in the food system due to its high percentage of porosity intended for the production of a variety of baked products such as ice cream, cakes, muffins, akara, etc. and also act as functional agents in other food formulations [32].
Values of the swelling index (SI) of samples ranged from 2.40 to 3.60 cm3 and they were significantly (P<0.05) different from each other. The values decreased with increased in Bambara groundnut. Moorthy SN et al. [34] reported that the swelling power of flour granules is an indication of the extent of associative forces within the granule. Swelling power is also related to the water absorption index of the starch-based flour during heating [35].
The physical characteristics of dough and bread from whole wheat and Bambara groundnut
The results of the physical quality characteristics of the dough and bread baked from blends of Bambara groundnut and whole wheat of various substitution levels is shown in Table 4. The average dough height increase decreased as the quantity of Bambara groundnut blend increased. This could be as a result of lesser gluten content in the blends containing Bambara groundnut. The average dough height decreased from 3.30 cm for the control sample to 2.11 cm as the proportion of the Bambara groundnut blend increased to 40% after 35 minutes of fermentation. The proofing rate also decreased from 0.019 (cm3/min) to 0.11 (cm3/min). This could be as a result of reduction/dilution effect of gluten in the dough with addition of Bambara groundnut blend resulting to less retention of carbon dioxide gas and a dense texture since Bambara groundnut is low in gluten. This result is in agreement with [36] who reported that the increase in addition of unripe plantain and Bambara groundnut protein concentrate blends for composite bread reduced the proofing rate accordingly.
| Samples | Average dough Height Increase | Proofing Rate (Cm3/mins) | Loaf Weight (g) | Loaf Volume (Cm3) | Specific Volume | Oven spring |
|---|---|---|---|---|---|---|
| A | 3.30a ± 0.02 | 0.019a ± 0.002 | 245.60d ± 0.83 | 380.85a ± 0.02 | 0.49a ± 0.22 | 0.90a ± 0.023 |
| B | 3.03b ± 0.09 | 0.019a ± 0.002 | 245.75c ± 0.84 | 365.66b ± 0.03 | 0.49a ± 0.18 | 0.76b ± 0.032 |
| C | 2.45c ± 0.16 | 0.016b ± 0.001 | 245.80b ± 0.22 | 340.33c ± 0.16 | 0.47 b ± 0.16 | 0.72b ± 0.030 |
| D | 2.33d ± 0.05 | 0.015c ± 0.001 | 245.84b ± 0.93 | 310.87d ± 0.13 | 0.43c ± 0.16 | 0.68c ± 0.027 |
| E | 2.11e ± 0.04 | 0.011d ± 0.002 | 246.97a ± 0.03 | 280.72e ± 0.08 | 0.43c ± 0.21 | 0.65c ± 0.012 |
| LSD | 0.002 | 0.004 | 0.001 | 0.004 | 0.002 | 0.003 |
Values are means ± standard deviation of Triplicate determinations. Values followed by the same superscript(s) within the column are not significantly (P>0.05) different.
Key: A=control 100% wheat flour, B=90% Wheat flour and 10% Bambara groundnut flour, C=80% Wheat flour and 20% Bambara groundnut flour, D=70% Wheat flour and 30% Bambara groundnut flour, E=60% Wheat flour and 40% Bambara groundnut flour.
Table 4: Effect of bambara groundnut flour on the physical characteristics of bread from whole wheat flour.
The loaf weight increased (P<0.05) significantly with increased Bambara groundnut flour. The values ranged from 245.60 g for the control sample to 246.97 g at 40% substitution of Bambara groundnut flour. The increase in loaf weight could be attributed to increased moisture absorption and less retention of carbon dioxide gas in the blended dough, resulting in heavy dough and thus heavy loaves [2]. The loaf volume and specific loaf volume were observed to decrease (P<0.5) significantly as the proportion of Bambara groundnut flour increased from 10-40%. This could be as a result of reduction/dilution effect of gluten in the dough with addition of the composite flour resulting to less retention of carbon dioxide gas and a dense texture [37]. The gluten causes the dough to extend and trap the carbon dioxide produced by yeast during formulation making the dough to be elastic and retain high volume. During baking, the high temperature coagulates the gluten structure and it becomes rigid without collapsing [38]. The percentage of wheat flour required to achieve a certain effect on composite flours depends heavily on the quality and quantity of wheat gluten and the nature of the product involved [38]. A minimum protein content of 11.0% in wheat flour is necessary for the production of yeast-leavened bread [38]. The bulkiness of the bread will be ideal for hungry consumers due to filling satisfying.
Sensory evaluation of bread from wheat substituted with Bambara groundnut
Sensory evaluation results is shown in Table 5. In terms of crumb colour, sample A with 100% whole wheat was rated highest than any of the other samples, it was noted that as the level of substitution of Bambara groundnut increased, the crumb color rating decreased. In terms of crust color, sample A with 100% whole wheat was rated highest than any of the other samples. It was noted that as the level of substitution of Bambara groundnut increased, the crust color rating decreased. The crust color of the samples with 10% and 20% Bambara groundnut were significantly same. The lowest crust color rating was recorded for sample E. The lowest rating in crust color of bread as the percentage of substitution of whole wheat flour with Bambara groundnut flour increased could be attributed to the color imparted by Bambara groundnut. In terms of aroma and taste, sample A with 100% whole wheat was rated highest. Sample B, C, D and E were rated the lowest, this could be attributed to the strong beany flavor of Bambara groundnut. The overall acceptability indicates that the control sample (7.15) was significantly higher than any other samples. This followed by sample B (7.00) with 10% Bambara groundnut substitution. There was a progressive significance decreased as Bambara groundnut increases from 10-40%.
| Samples | Crumb Colour | Crust Colour | Aroma | Texture | Taste | Overall Acceptability |
|---|---|---|---|---|---|---|
| A | 7.40a ± 0.12 | 7.10a ± 0.07 | 6.70a ± 0.12 | 7.20a ± 0.32 | 6.60a ± 0.23 | 7.15a ± 0.02 |
| B | 6.85b ± 0.11 | 6.85b ± 0.09 | 5.95b ± 0.15 | 6.30b ± 0.22 | 6.50b ± 0.26 | 7.00b ± 0.03 |
| C | 6.30c ± 0.21 | 6.85b ± 0.10 | 5.95b ± 0.16 | 6.15c ± 0.12 | 6.15c ± 0.32 | 6.50c ± 0.02 |
| D | 6.35c ± 0.30 | 6.15c ± 0.08 | 5.75c ± 0.15 | 6.15c ± 0.43 | 5.65d ± 0.32 | 6.40d ± 0.03 |
| E | 6.35c ± 0.14 | 5.90d ± 0.12 | 5.10d ± 0.23 | 6.00d ± 0.36 | 4.80e ± 0.41 | 5.60e ± 0.04 |
| LSD | 0.011 | 0.022 | 0.013 | 0.02 | 0.013 | 0.013 |
Values followed by the same superscript(s) within the column are not significantly (P>0.05) different.
Key: A=control 100% wheat flour, B=90% Wheat flour and 10% Bambara groundnut flour, C=80% Wheat flour and 20% Bambara groundnut flour, D=70% Wheat flour and 30% Bambara groundnut flour, E=60% Wheat flour and 40% Bambara groundnut flour.
Table 5: Effect of bambara groundnut flour on the sensory characteristics of bread from whole wheat.
The study had showed that the protein content of the composite bread increased and the minerals also increased. The functional properties of the composite flour - water absorption capacity, oil absorption capacity; bulk density, foaming capacity, foaming stability and swelling index were affected by the increased in the substitution of Bambara groundnut flour. In terms of physical properties and sensory characteristics of the composite bread, it was observed that up to 10-40% Bambara groundnut flour could be substituted whole wheat flour in bread making without adversely affecting the physical and sensory properties of the loaf. Beyond this level, the bread appears scattered, strong and had a characteristics beany flavor which was detected by the panelists.