Journal of Nutrition & Food Sciences
Open Access
ISSN: 2155-9600
ISSN: 2155-9600
Research Article - (2016) Volume 6, Issue 6
Overproduction of free radicals is implicated in the pathogenesis of most chronic diseases. Antioxidant phytochemicals thus play an important role in the prevention of these diseases. Tea is consumed across different cultures and is a major source of phenolic compounds in our diets. The aim of this study was to optimize extraction conditions for the preparation of a phytochemical-rich Moringa oleifera functional tea with antioxidant potential using Response Surface Methodology. Extraction conditions (temperature (°C), solid to liquid ratio (mg/mL) and time (min)) were optimized for recovery of total polyphenols (TP), total flavonoids (TF) and total tannins (TT). At the optimal conditions, Moringa tea was produced and its antioxidant capacity determined using the 2,2’-diphenyl-1- picrylhydrazyl (DPPH) radical scavenging and total reducing power assays. The amount of phytochemicals extracted was significantly (p<0.05) influenced by the extraction variables and their interactions in some cases. All 3 response variables (TP, TF and TT) exhibited the same optimal extraction conditions which were a solid to liquid ratio of 1/20 mg/mL, a temperature of 97°C and time of 35 min with optimal yields of 56.96, 34.66 and 3.53 mg/100 mL for TP, TF and TT respectively. Moringa olifera functional tea prepared at these optimal conditions was able to inhibit 81% of free radical using the DPPH assay, slightly higher than ascorbic acid (77%) used as reference; and had a reducing potential of 1.75 g Ascorbic Acid Equivalence/100 g DM. The tea could thus be considered an antioxidant rich tea for use in the prevention of chronic diseases.
Keywords: Moringa oleifera functional tea; Total polyphenols; Total flavonoids; Total tannins; Antioxidant potential; Response surface methodology
The rising incidence of degenerative diseases coupled with the fact that consumers have become more aware of the relationship between food and health has increased the demand for functional foods. Overproduction of free radicals or oxidant species is implicated in the pathogenesis of most chronic diseases. Excessive production of free radicals in the body can lead to oxidative damage of large biomolecules such as DNA, lipids and proteins, responsible for the pathogenesis of several chronic diseases such as cardiovascular diseases, cancers, and diabetes [1,2]. Thus, antioxidant phytochemicals can play an important role in the prevention and treatment of chronic diseases [1].
Plants with their rich bioactive compounds content (polyphenols, flavonoids, tannins, carotenoids) with antioxidant and antiinflammatory properties beneficial in the fight against these diseases have received growing attention over the years for the production of functional foods to help fight these diseases [1-3].
Moringa oleifera Lam is a plant belonging to the Moringaceae family. Its leaves have been shown to possess antioxidant [4,5], cholesterol and lipid lowering [6], anti-tumor and anti-inflammatory [7] and anti-diabetic [8,9] properties. These properties are the result of the richness of this plant in bioactive compounds such as polyphenols (flavonoids, saponins, and tannins), carotenoids and Vitamin C [7].
Tea is a soft drink obtained by boiling and by maceration or infusion of plant materials (fresh or dried flowers, leaves, stems, roots) in hot or cold water, and is a major source of phenolic compounds in our diets given its wide consumption [10,11]. The amount of polyphenols extracted into the tea during brewing, is a function of such factors as, the time and temperature of extraction, as well as the quantity of the substrate used. M. oleifera, being rich in phenolic compounds, with its given health benefits could be used for the preparation of a phytochemical-rich functional tea with antioxidant potential. Such a tea could serve as a source of bioactive antioxidant phytochemicals important in the fight against chronic diseases [1,2].
Extracts of M. oleifera have been prepared using aqueous and organic solvents and their antioxidant effects studied [4,5,12]. However, there is the need to understand the interactive effects of the different extraction variables on phenolic contents and antioxidant properties of such extracts, and to optimize extraction conditions. In addition, when organic solvents are used these extracts cannot be consumed directly given the toxicity of these solvents. The goal of this study therefore, was, to optimize conditions for the production of a phytochemicalrich Moringa functional tea with antioxidant potentials using response surface methodology.
Plant materials
M. oleifera leaves were harvested in Maroua in the Far North Region of Cameroon and transported to the Food Biophysics, Biochemistry and Nutrition Laboratory, of the National School of Agro-Industrial Sciences (ENSAI) of the University of Ngaoundere.
Production of Moringa oleifera powder
Leaflets were detached from the M. oleifera leaves, sorted to remove dead leaves, washed with distilled water, rinsed and drained on plastic trays for 30 min before drying at 45 ± 2°C for 14 h in a ventilated electric dryer (Riviera & Bar QD105A, Paris, France). Dried leaves were ground in a hammer mill (Culatti, Polymix, France) and sieved through a 500 μm sieve to obtain powder. The powder samples were stored in airtight glass jars and stored at 4°C until further analyses.
Extraction of plant materials
M. oleifera powder was extracted in distilled water, using a temperature controlled shaking water bath. Solid to liquid Ratio (SLR), extraction time and temperature were varied according to experimental conditions. The extracts were filtered through whatman N°1 filter paper and the clear extracts were stored in airtight amber bottles at 4°C. Extraction was done in duplicates and the duplicate extracts pooled together. All measurements were assayed in triplicates. The extracts were analyzed for total polyphenols, total flavonoids and total tannins. Preliminary trials using one factor at a time approach was employed to determine the range of the design variables to be employed in the optimization experiments.
Experimental design
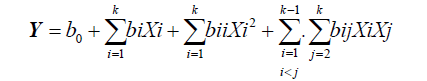
Response Surface Methodology (RSM): Response Surface Methodology (RSM) was used to optimize extraction conditions for total polyphenols (TP), total flavonoids (TF) and total tannins (TT) from M. oleifera leaf powder for the preparation of a functional tea. A central composite design was used to investigate the effects of three independent variables; solid to Liquid ratio (SLR or Ratio, mg/mL, X1), temperature (°C, X2) and time (min, X3). The independent variables were each coded at five levels (-α, -1, 0, +1, +α) and their values were selected based on preliminary experiments. The independent variables and their coded and uncoded (actual) levels are given in Table 1. The complete design as generated by Statgraphics Centurion 15.1 software (StatPoint Technologies, Inc., Warrenton, USA) consisted of 17 experimental runs with three replications at the center point (Table 2). The response variables are total polyphenols (Y1), total flavonoids (Y2) and total tannins (Y3). Experimental data were fitted to a second order quadratic polynomial model which was explained by the following quadratic equation (Equation 1):
 (1)
(1)
| Coded Levels | ||||||
|---|---|---|---|---|---|---|
| Independent variables | Symbol | (-α) -1.682 |
-1 | 0 | 1 | (+α) 1.682 |
| Actual Levels | ||||||
| Solid to liquid ratio-SLR (mg/mL) | X1 | 1/61 | 1/40 | 1/26 | 1/20 | 1/17 |
| Temperature (°C) | X2 | 50 | 60 | 75 | 90 | 100 |
| Time (min) | X3 | 3 | 10 | 20 | 30 | 37 |
Table 1: Levels of independent variables and their coded and actual levels established according to the central composite design.
| Coded variables | Responses | |||||
|---|---|---|---|---|---|---|
| Run | X1 mg/mL | X2 °C | X3 min | Total polyphenols (mg/100mL) | Total flavonoids (mg/100mL) | Total tannins (mg/100mL) |
| 1 | 0 | 0 | 0 | 46.58 | 20.79 | 2.72 |
| 2 | 0 | 0 | 0 | 47.45 | 22.04 | 2.40 |
| 3 | 0 | 0 | 0 | 46.30 | 20.81 | 2.29 |
| 4 | -1 | -1 | -1 | 40.68 | 12.55 | 1.03 |
| 5 | 1 | -1 | -1 | 42.78 | 17.33 | 2.68 |
| 6 | -1 | 1 | -1 | 41.48 | 16.11 | 0.86 |
| 7 | 1 | 1 | -1 | 51.80 | 27.30 | 1.87 |
| 8 | -1 | -1 | 1 | 43.44 | 14.95 | 1.48 |
| 9 | 1 | -1 | 1 | 50.71 | 21.14 | 2.13 |
| 10 | -1 | 1 | 1 | 42.64 | 16.45 | 2.11 |
| 11 | 1 | 1 | 1 | 53.32 | 29.40 | 3.53 |
| 12 | -1.682 | 0 | 0 | 34.17 | 11.70 | 1.13 |
| 13 | 1.682 | 0 | 0 | 51.85 | 29.07 | 2.94 |
| 14 | 0 | -1.682 | 0 | 42.06 | 12.59 | 2.33 |
| 15 | 0 | 1.682 | 0 | 49.30 | 23.09 | 3.12 |
| 16 | 0 | 0 | -1.682 | 48.03 | 19.68 | 1.74 |
| 17 | 0 | 0 | 1.682 | 50.57 | 22.46 | 2.32 |
Table 2: Central composite design for independent variables and measured responses.
Where Y represents the response variable; X1, X2, X3, ..., Xk are the coded independent variables affecting the response Y; b0, bi (i=1, 2, ... k), bii (i=1,2 ... k), bij (i=1, 2, ... k; j=1,2, ..., k) are respectively the regression coefficients for the intercept, linear, quadratic and interaction terms, k is the number of variables. The intercept, linear, quadratic and interaction terms were statistically analyzed for variation using analysis of variance (ANOVA).
Validation of model
Verification tests for the validity of the model were done using optimal extraction conditions (SLR, temperature and time) that yielded maximum values for each of the responses (total polyphenols, total flavonoids and total tannins). These conditions were obtained by solving second order polynomial models of RSM using Stat graphics Centurion 15.1 software (StatPoint Technologies, Inc., Warrenton, USA). Verification experiments were then conducted under these conditions (duplicate extractions and triplicate analyses) and the experimental and predicted values compared. The R2 values, lack of fit test and absolute average deviation (AAD) were used to determine the validity of the model. R2 and the test of fitness were derived from the analysis of the experimental matrix through Statgraphics, and AAD was calculated using the following formula [13]:
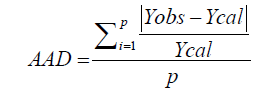
Where Yobs and Ycal respectively represent experimental and calculated responses and p is the number of experimental test.The model is valid if the lack of fit is insignificant, AAD is close to zero and R2 is close to 1 [13].
At the determined optimal conditions, a functional tea was prepared and its antioxidant potential determined using the DPPH (2,2’ diphenyl-1-picryl hydrazyl) radical scavenging capacity and Total reducing Power (TRP) assay.
Analysis of the response variables
Total polyphenols: The total polyphenols were determined by the method of Makkar et al. [14]. Extract (10 μl) was diluted 20 times with distilled water (2.99 mL) in a test tube and mixed with 500 μL of Folin-Ciocalteu reagent and 400 μL of 7.5% sodium carbonate (w/v). The mixture was votexed, and incubated in the dark at room temperature for 10 min. The absorbance was measured at 760 nm using a spectrophotometer (Metertech SP8001, Germany). Total phenolic content was calculated against a calibration curve established using gallic acid and expressed as mg gallic acid equivalent (GAE) per 100 mL.
Total flavonoids: Total flavonoids were determined by a colorimetric method as described by Adom [15]. To 0.1 mL of extract was added 2.4 mL of distilled water and 0.15 mL of sodium nitrite (5% w/v) and the mixture incubated at 25°C for 5 min. Thereafter, 0.15 mL of Aluminum chloride hexahydrate (10% w/v) was added followed by a second incubation. Finally 1 mL of 1M sodium hydroxide solution was added and the optical density was read at 510 nm against a reagent blank. A calibration curve was established using catechin solution. Flavonoid concentration was calculated from the calibration curve and expressed as catechin equivalents per 100 mL.
Total tannins: Total tannins were determined using the vanillin HCl method as described by [16]. To 1 mL of extract was added 3 mL of 4% (w/v) vanillin in methanol, followed by addition of 1.5 mL concentrated hydrochloric acid. The mixture was vortexed and incubated at 30°C for 20 min. The absorbance was read at 500 nm against a blank. Tannin content was calculated from a standard curve prepared using tannic acid solution (0.2 g/L). The results were expressed as equivalent grams of tannic acid per 100 mL.
Determination of antioxidant activity of functional tea
DPPH radical scavenging activity: Antioxidant capacity (Radical scavenging activity) of M. oleifera functional tea was determined using the modified Brand-Williams et al. [17] method. DPPH (2,2’-diphenyl- 1-picryl hydrazyl) in ethanol is a stable radical, dark violet in color. Its color is bleached by its reaction with a hydrogen donor. For analyses, 0.1 mL of M. oleifera tea was added to 2 mL of 100 μM DPPH solution in ethanol. Ethanol without extract was included as control. The reaction mixture was incubated for 30 min in the dark at 25°C and the absorbance read at 517 nm. Vitamin C was used as the standard against which the antioxidant activity of the tea was compared. The free radical scavenging activity was calculated as follows:

Where Abs. is the Absorbance at 517 nm
DPPH activity was expressed as % inhibition.
Total reducing power
The reducing power of M. oleifera functional tea was determined by the method of Yen and Chen [18] using potassium ferricyanide (K3Fe(CN)6). An aliquot of extract (100 μL) was mixed with equal amounts of 0.2 M phosphate buffer (pH 6.6) and 1% potassium ferricyanide and incubated for 20 min at 50°C followed by precipitation with 10% TCA. After centrifugation at 3,500 rpm for 15 min, the supernatant was diluted with equal volumes of distilled water and 100 μL of 0.1% ferric chloride (FeCl3) to determine ferric reducing capacity of Moringa tea. The absorbance was read at 700 nm against a reagent blank. A higher absorbance indicates a higher reducing power because more ferric cyanide is reduced to ferrous cyanide by the tea. Ascorbic acid was used as reference standard and results expressed as ascorbic acid equivalence (g AAE/100 g Dry Matter).
Statistical analysis
All analyses were conducted in triplicates. Mean values were analyzed using Duncan multiple range test, and the software Stat graphics Centurion 15.2 was used to fit the generalized second order polynomial equation (Equation 1) to each of the dependent variables. Response surface plots were generated from the polynomial models and optimum conditions identified from them.
Model fitting
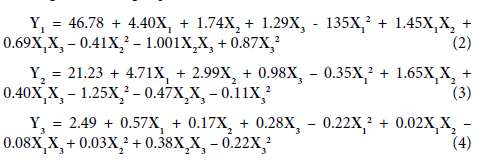
Extraction conditions for total polyphenols (TP), total flavonoids (TF), and total tannins (TT) from Moringa oleifera leaf powders were optimized using response surface methodology and a central composite design for the production of a functional tea. Table 2 shows the experimental design and the corresponding response data for TP, TF, and TT. The experimental data was fitted to a second order polynomial equation (Equation 1), and regression coefficients for the intercept, linear, quadratic and interaction terms of the model were analyzed statistically for variation using ANOVA. The results of these analyses are presented in Table 3. Using the determined regression coefficients, second order regression equations for the concentration of TP (Y1), TF (Y2) and TT (Y3) were established (Equations 2, 3, and 4 respectively), where X1, X2 and X3 are the coded values for the independent variables SLR, temperature and time respectively. From Table 3 we observe that the second order regression models were significant (p<0.05), thus demonstrating the significance of the experimental variables. The models p values were respectively 0.0001, 0.0001 and 0.006 for TP, TF and TT. To verify the models accuracy we used the R2, lack of fit, and the AAD. The determination coefficient R2 which is the ratio of observed variation to the total variation is a good measure of the models overall performance. In this study R2 for TP, TF and TT were respectively 0.96, 0.99 and 0.91. This coupled with the fact that the lack of fit was not significant (p>0.05) and that AAD was small (0.02, 0.02 and 0.1 for TP, TF and TT respectively) confirms the validity of the model (Table 3). The R2 values for TP, TF and TT were greater than 90% indicating that a high proportion of the variability in the response variables can be attributed to the independent variables and that only a small portion of the variability in the response variables is due to other uncontrollable factors. Thus the model can be used to predict response values. The adjusted R2 values were above 80%. The models were therefore judged to accurately represent data in the experimental region and were used to navigate the design space.
Effect of extraction conditions (concentration, temperature and time) on response variables
Total polyphenols: The relationship between the independent variables (extraction conditions) and polyphenols is illustrated by 3 dimensional response surface and contour plots generated by the model (Figure 1). In these three variable plots when two experimental variables are depicted on the dimensional plots, the third variable is kept constant at its center value. As can be seen from Table 3, the independent variables had a significant (p<0.05) positive influence on TP extracted; that is the amount of polyphenols extracted increased with an increase in these variables (Figure 1). Solid to liquid ratio had the most positive linear coefficient (4.40), followed by temperature (1.74) and lastly time (1.29). However, the quadratic effect of SLR had the most negative effect (-1.35) on TP indicating that higher SLR are not favorable for polyphenol extraction. The amount of polyphenols extracted increased from a ratio of 1/61 up to a ratio of 1/20 and thereafter remained constant (Figure 1A). At higher SLR saturation of the medium may account for the stability in polyphenols extracted. The interaction between SLR and temperature was significant (p<0.05), and positively influenced polyphenol extraction, whereas that between temperature and time had a negative effect on TP. However, polyphenol extraction increased independently with temperature and time (Figures 1B and 1C). The duration of extraction is a function of the extraction temperature which influences the diffusion of extraction materials into the solvent. Increase in extraction temperature could soften the matrix and break protein-polyphenol and polysaccharidepolyphenol linkages, thus facilitating the migration of polyphenols into solution [16,19]. At higher temperatures for longer times, oxidation of polyphenols may occur [20] reducing quantities of polyphenols extracted.

Figure 1: Effect of extraction variables (solid liquid ratio-ratio, temperature and time) on total polyphenols contents. (A) Higher temperatures and ratio improved the amount of polyphenols extracted. The interaction between high temperature and higher ratios were favorable for polyphenol extraction. (B) The amount of polyphenols extracted increased with temperature and with time, though higher temperatures had a slightly negative effect at longer times. (C) At higher ratios more polyphenols were extracted but required longer times.
| Source | Total polyphenols (mg/100mL) | Total Flavonoids (mg/100mL) | Total Tannins (mg/100mL) | ||||||||||
|---|---|---|---|---|---|---|---|---|---|---|---|---|---|
| DF | Coefficients | Sum of squares | F-value | P-value | Coefficients | Sum of squares | F-value | P-value | Coefficients | Sum of squares | F-value | P-value | |
| X0, Constant | - | 46.78 | - | - | - | 21.23 | - | - | - | 2.49 | - | - | - |
| Linear | - | - | - | - | - | - | - | - | - | - | - | - | - |
| X1, Ratio | 1 | 4.40 | 264.52 | 735.52 | 0.0014 | 4.71 | 303.11 | 591.29 | 0.0017 | 0.57 | 4.44 | 88.91 | 0.0111 |
| X2, Temperature | 1 | 1.74 | 41.50 | 115.39 | 0.0086 | 2.99 | 122.78 | 239.51 | 0.0041 | 0.17 | 0.41 | 8.23 | 0.1030 |
| X3, Time | 1 | 1.29 | 22.79 | 63.37 | 0.0154 | 0.98 | 13.00 | 25.36 | 0.0372 | 0.28 | 1.04 | 20.92 | 0.0446 |
| Quadratic | |||||||||||||
| X12 | 1 | -1.35 | 20.62 | 57.33 | 0.0170 | -0.35 | 1.42 | 2.77 | 0.2379 | -0.22 | 0.54 | 10.72 | 0.0820 |
| X22 | 1 | -0.40 | 1.88 | 5.23 | 0.1495 | -1.25 | 17.70 | 34.52 | 0.0278 | 0.03 | 0.01 | 0.15 | 0.7322 |
| X32 | 1 | 0.87 | 8.56 | 23.81 | 0.0395 | -0.11 | 0.14 | 0.27 | 0.6546 | -0.22 | 0.54 | 10.89 | 0.0808 |
| Interaction | - | - | - | - | - | - | - | - | - | - | - | - | - |
| X12 | 1 | 1.45 | 16.91 | 47.01 | 0.0206 | 1.65 | 21.68 | 42.29 | 0.0228 | 0.02 | 0.00 | 0.04 | 0.8669 |
| X13 | 1 | 0.69 | 3.82 | 10.63 | 0.0826 | 0.40 | 1.26 | 2.45 | 0.2580 | -0.08 | 0.05 | 0.90 | 0.4425 |
| X23 | 1 | -1.00 | 8.02 | 22.30 | 0.0420 | -0.47 | 1.78 | 3.47 | 0.2037 | 0.38 | 0.05 | 22.85 | 0.0411 |
| Lack of fit | 5 | - | 14.38 | 8.00 | 0.1149 | - | 2.62 | 1.02 | 0.5621 | - | 0.67 | 2.68 | 0.2941 |
| Pure Error | 2 | - | 0.72 | - | - | - | 1.03 | - | - | - | 0.10 | - | - |
| Total (corr.) | 16 | - | 414.39 | - | - | - | 485.81 | - | - | - | 8.88 | - | - |
| R2 | - | 0.9636 | - | - | - | 0.9925 | - | - | - | 0.9136 | - | - | - |
| Adjusted-R2 AAD |
- | 0.9167 0.020 |
- | - | - | 0.9828 0.020 |
- | - | - | 0.8025 0.103 |
- | - | - |
Table 3: Analyses of variance and regression coefficients of second degree polynomial models for the different response factors (Total polyphenols, total flavonoids, and total tannins).
Total flavonoids: All three independent variables significantly (p=0.0001) influenced TF extraction positively (Table 3) with concentration again having the highest linear positive coefficient (4.71), followed by temperature (3.00) and time (0.98). Thus higher SLR, temperatures and time improved flavonoid extraction (Figure 2). Dailey and Vuong [21] had observed that flavonoid extraction increased with temperature. The quadratic effect of temperature significantly (p=0.03) negatively (-1.25) influenced TF. With time held constant at its center value (20 min), the amounts of flavonoids extracted increased with increasing SLR and with temperature of extraction (Figure 2A) and the interaction between these two variables was significant (p=0.02).

Figure 2: Effect of extraction variables (solid liquid ratio-ratio, temperature and time) on total flavonoids contents. (A) Flavonoids were extracted more at higher temperatures and ratios. (B) Flavonoids extracted increased with temperature and with time but peaked and remained stable at higher temperatures. (C) The amount of flavonoids increased with ratio, and with time of extraction.
Total flavonoids extracted increased with temperature up to 85oC and thereafter remained constant. When SLR was fixed at its center value, TF extracted increased with temperature and time, but more so with temperature (Figures 2B and 2C). The interaction temperature time (X2X3) and SLR time (X1X3) had no significant influence on flavonoids.
Total tannins: Only the linear effect of SLR and time significantly (p<0.05) influenced tannin extraction, although the effects were minimal given the small values of their coefficients which were respectively 0.57 and 0.28 (Table 3). Tannin extraction was positively (0.38) and significantly (p<0.05) influenced by the interaction between time and temperature (Figures 3B and 3C). At higher temperatures, longer times favored tannin extraction. Tannins extracted increased from 3 to 20 min, remained constant up to 30 min and thereafter dropped. Tannins were not appreciable influenced by the independent variables suggesting either that their concentrations in M. oleifera leaf powders are small or that the extraction variables do not significantly affect tannin extraction. It is evident from the above that solid to liquid Ratio and temperature had the most effect on TP and TF.

Figure 3: Effect of extraction variables (solid liquid ratio-ratio, temperature and time) on total tannin contents. (A) Tannins increased with ratio and temperature. (B) Time had no effect on tannins at lower temperatures but as temperatures increased, longer times favored tannin extraction. (C) Time and ratio improved tannin extraction up to a maximum and later dropped.
Determination of optimum extraction conditions: The optimum values for the independent variables were obtained by solving second order regression equations (Equation 2, 3, and 4) using the software Stat graphics Centurion 15.2 and the maximum desirability of all the dependent variables. It emerges from this that the optimum extraction conditions for the three measured responses TP, TF and TT are the same (1/20 mg/mL, 97ºC and 35 min with desirability of 1). This observation concurs with previous findings by Khan et al. [22] in the optimization of extraction conditions of phenolic compounds from orange peel using ultrasound centered composite design. The authors noted that the optimal extraction conditions for the different polyphenols were concentrated around the same values. Similarly, the work of Ondrejovic et al. [19] on optimizing extraction of antioxidants from the leaves of M. officinalis showed that total polyphenols and flavonoids have the same optimal conditions, which is in accordance with our results.
To check the validity of this model, extractions were done using the optimal conditions and the response factors measured. Mean values for the response factors are presented on Table 4 alongside the predicted values. No significant differences were observed between predicted and experimental values for TP, TF and TT. We therefore conclude that the equations are adequate for predicting the response factors.
Antioxidant capacity of Moringa oleifera functional tea: M. oleifera functional tea was prepared using the optimum conditions and its antioxidant potential measured using the DPPH radical scavenging and the total reducing power assays. DPPH radical was used as a substrate to evaluate the free radical scavenging activity of Moringa tea. DPPH is known to abstract labile hydrogen and the ability to scavenge the DPPH radical is related to the inhibition of lipid peroxidation [23]. Reduction in DPPH absorbance implies increased antioxidant potential of the extract. Moringa tea thus showed strong antioxidant potential as it inhibited 81% of the DPPH radicals compared to 76.5% inhibition observed with vitamin C (0.1 mg/ml) that was used as reference (Table 4). The DPPH scavenging activity of Moringa tea is comparable to that (89%) reported by Pakade et al. [24] with methanolic extracts of M. oleifera leaves.
| Independent Variables | Dependent variables (Responses) | Optimum Value | |||
|---|---|---|---|---|---|
| X1 (mg/ml) | X2 (°C) | X3 (min) | Predicted | Experimental* | |
| - | - | - | Y1(mg/mL) | 56.92 | 56.96 ± 0.07 |
| 1/20 | 97 | 35 | Y2 (mg/mL) | 34.35 | 34.66 ± 0.07 |
| - | - | - | Y3 (mg/mL) | 3.62 | 3.53 ± 0.03 |
| Antioxidant Capacity | |||||
| - | - | - | DPPH (% inhibition) | - | 80.94 ± 0.76% |
| - | - | - | Reducing power (g AAE/100 g DM) | - | 1.75 ± 0.21 |
| - | - | - | - | - | - |
Table 4: Optimum conditions, predicted and experimental values of response variables and antioxidant capacity of Moringa oleifera functional teaa.
Reducing power is a measure of the reductive ability of a substance. It is evaluated by its ability to donate electrons and reduce Fe3+ to Fe2+. It is thus used to measure the potential antioxidant activity of a substance [6,25]. Results showed that Moringa tea has good reductive capability (1.75 ± 0.21 g AAE/100 g DM). Similar observations have been reported by Shih et al. [25].
The antioxidant capacity of Moringa has been attributed to its polyphenols and flavonoid contents [25,26]. Several studies have also shown significant correlations between phenolic contents and antioxidant capacity [10,27].
This study shows that extraction conditions influence recovery of phenolic compounds and that Response surface methodology could be employed to optimize phenolic extraction from Moringa oleifera leaves for the production of a phytochemical-rich antioxidant functional tea. Optimum extraction conditions were the same for total polyphenols, total flavonoids and total tannins at 1/20 mg/mL solid to liquid ratio, 97ºC for temperature and time of 35 min. The interaction between solid to liquid ratio and temperature had the most effect on TP and TF, but not on TT. There were no significant differences between predicted and experimental values suggesting that the response models could reliably predict extraction conditions. Moringa functional tea inhibited 81% of free radicals in the DPPH assay and had reducing capacities of 1.75 g Ascorbic acid equivalence/100 g DM. Given the strong antioxidant potential of this M. olefera tea, its consumption could be beneficial in the prevention of stress related chronic diseases. Further investigations are however needed to determine the actual functionality of this tea.