Journal of Nutrition & Food Sciences
Open Access
ISSN: 2155-9600
ISSN: 2155-9600
Research Article - (2014) Volume 0, Issue 0
Background: Stunting is a major public-health problem in low and middle-income countries, and it increases risk of morbidity and mortality during childhood. In Ethiopia, it is a major public health problem. Objective: To assess prevalence and associated factors for stunting among school children at Debre Markos town and Gozamen woreda, East Gojjam Zone, Amhara regional state, Ethiopia. Methods and materials: Cross-sectional quantitative study design was employed. The study area and study sites were selected by random sampling method and the study subjects were taken by systematic random sampling technique. The study was conducted at eight selected schools. The study was carried out from March 2013 up to June 2013. Statically analysis: Data were entered into Epi-info (version 3.5.1) satirical software then exported in to SPSS version 16.0 statistical programs and anthroplus software was used to determine HAZ score of individual values. Result: The overall prevalence of stunting was 48.1%, out of which, 5% were severely stunted, 14.3% moderately stunted and 28.8% mildly stunted, and the mean was 1.72 with standard division of 0 .887. 3.1% boys and 1.9% girls were severely stunted. As the age increased stunting was significant. Rural school children were highly stunted as compared to urban children. Conclusion: This study showed that stunted rate was alarming magnitude. Total prevalence of stunting in this study was 48.1%; 5% were severely stunted (<-3SD), 14.3% moderately stunted (<-2SD) and 28.8% mildly stunted (<-1SD). As this study showed all age groups of schoolchildren were affected. However, age groups 13-15 years were significantly associated. Living in rural area was independently associated with increasing rate of stunting. Sex difference was no significant.
Keywords: Child; Children; School children; Associated factors; Stunting
Stunting is Height-for-Age Z-score (HAZ) of equal to or less than minus two standard deviation (-2 SD) below the mean of a reference standard [1]. Stunting is a major public-health problem in low and middle-income countries because of its association with increased risk of mortality during childhood [2,3]. Under nutrition is a serious risk factor for illness, and it contributes substantially to the burden of disease in Low- to Middle-Income Countries (LMICs) [4]. Increasing adverse ramifications of childhood under nutrition is recognized later in life, and it includes impaired cognitive development, poorer educational achievement and human capital formation [5]. It is associated with poor developmental achievement in young children and poor school performance in older children [6,7].
Ethiopia is also one of the countries in the Sub-Saharan Africa with the highest rates of malnutrition. The economy is based on small landholder agriculture which more than 85% of the population of 63 million living in rural areas under very poor conditions [8]. In Ethiopia, no progress has been made in reducing child malnutrition over the past 17 years. There could be several underlying and basic causes for the problem; some of which could be due to low agricultural production, low and inadequate food consumption, disease and falling gross national product per capita. Drought, civil war and political instability are also the major contributing factors. This has serious implications because child health goals for the early part of the next century have specifically targeted at improvements in the rates of stunting. Recently, in 2012, Ethiopian Demographic Health Survey (EDHS) report showed that 44% of children under age five were stunted, and 21% of children were severely stunted [9]. DHS of Ethiopia, in 1998 reported that the prevalence was 51.2% [9]. Considering Ethiopia’s position in the rate of stunting, the 1992 national prevalence of stunting (i.e., 64 %) was the highest in the world [10].
Many researchers have done on prevalence and associated factors for chronic malnutrition among under-five children, and the result showed that it is multi factorial, and there were high prevalence rate. However, no more published researches, which assessed the associated factors and prevalence of stunting among school children, were available still in country, especially in the study area. So, in this research, the magnitude of stunting and associated factors for stunting was determined among school children.
Study area: Cross-sectional quantitative study design was conducted at eight selected schools in Debremarkos town and Gozaminworeda, East Gojam zone, Amhara National Regional State, Northwest Ethiopia, which are located about 299 km north of the capital city of Ethiopia, Addis Ababa. DebreMarkos and Gozamenworeda include 23 and 50 elementary schools respectively. About 70, 000 elementary students were found in both DebreMarkos town and Gozamenworeda.
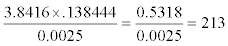
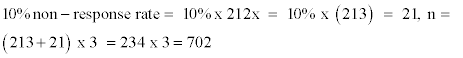
Method of sampling: At the time of the survey, using the multistage random-sampling technique, eight schools –four primary schools in rural area and the other four primary schools were selected from urban area. To determine the number of children to be included in the study, the single population formula was used, and estimated stunting population was16.6% taken from Kenya [11].
Using the estimated prevalence of stunting the minimum sample size (n) for the study was calculated as follows:
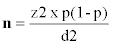
Where ‘z’ is the critical value, and in a two-tailed test, it is equal to 1.96, p is the estimated prevalence of stunting, and d is the absolute sampling error that can be tolerated.
In this study, it was fixed at 5%. Multiplication by 3 was done for correcting design effect. Therefore, the minimum sample size was:
Population proportionate formula was used. Each study subjects have been taken every 14 intervals from their registered list by systematic simple random technique.
Data collection techniques and procedures: Standardized interview questionnaires were adopted and modified from related articles to collect data on the socio-demographic variables and risk factors. The interview was translated into the local language (Amharic) for easy understanding by the respondents. Each student was interviewed to obtain information on demographic and socioeconomic characteristics of the child’s family.
Measurements: The recorded parameters were age and height. Age information was obtained from the child’s reporting. The anthropometric data were collected at schools by six well-trained nurses. Height was measured for all children without shoes using in centimeters with an accepted error of 0.1 cm. The data were used to calculate: height-for-age, the anthropometric indicator used to evaluate stunting. This was determined by National Center for Health Statistics (NCHS)/World Health Organization (WHO) reference values for height [12]. HAZ score of individuals or nutritional survey was calculated by using WHO AnthroPlus Software for assessing growth of the world’s children and adolescents [13].
Data processing and analysis: Data were entered into Epi Info version 3.5.1 then exported to and analyzed by using SPSS for Windows software (version 16.0). Analyses of data were done using step wise bivariate and multivariate logistic regression to observe the effect of independent variables on the dependent variable by controlling confounders. Statistical significance was evaluated at 95% levels of significance or p-value <0.05 in logistic regression result was considered as associated factors for stunting.
Ethical clearance: Ethical approval and clearance was obtained from Addis Ababa University College of health science school of allied science Ethics Committee. Assent form was prepared for children. Children had been told that the information obtained from them was treated with complete confidentiality and the measurement had no any harm to the study subjects.
A total of 702 children were included in the study. Three participants were rejected from the study as a result, the data were not completed during data collection; therefor 699 participants were participated in the study with a response rate of 99.6%. As shown on Table 1 below, the study sample included 357 (51.1%) boys and 342 (48.9%) girls with mean age of 11.76 year and a standard deviation of 2.253. Three hundred eight (44%) study participants were in range of 13-15 years of age. Two hundred forty eight (35.5%) were rural and 451(64.5%) urban participants.
| Socio-demographic factors | Frequency N=699 |
Percentage (%) |
|
|---|---|---|---|
| Sex | Male | 357 | 51.1 |
| Female | 342 | 48.9 | |
| Age | 7-8 | 67 | 9.6 |
| 9-10 | 145 | 20.7 | |
| 11-12 | 179 | 25.6 | |
| 13-15 | 308 | 44.1 | |
| Father’s educational status | Illiterate | 255 | 36.5 |
| Primary | 218 | 31.2 | |
| Secondary | 101 | 14.4 | |
| College | 62 | 8.9 | |
| University | 63 | 9 | |
| Mother’s educational status | Illiterate | 338 | 48.4 |
| Primary | 207 | 29.6 | |
| Secondary | 81 | 11.6 | |
| College | 46 | 6.6 | |
| University | 27 | 3.9 | |
| Mother’s occupational status | Housewife | 426 | 60.9 |
| Governmental employee | 98 | 14 | |
| Private employee | 103 | 14.7 | |
| Merchant | 72 | 10.3 | |
| Father’s occupational status | Farmer | 269 | 38.5 |
| Merchant | 113 | 16. 2 | |
| Governmental employee | 211 | 30.2 | |
| private employee | 106 | 14.7 | |
| Family size | 1-3 | 367 | 52.5 |
| >3 | 332 | 47.5 |
Table 1: Socio-demographic characteristics of study samples among school children in Debre Markos town and Gozamenworeda,East Gojjam, zone, Amhara regional state, etthiopia, June 2013.
Prevalence of stunting: The overall prevalence of stunting was 48.1%, out of which, 35 (5%) were severely stunted (< -3SD), 100 (14.3%) moderately stunted (< -2SD) and 201 (28.8%) mildly stunted (< -1SD), and the mean was 1.72 with standard division of 0 .887. Twenty two (3.1%) boys and 13(1.9%) girls were severely stunted (<- 3SD) (Table 2).
| Height-for- age | Male | Female | Total | |||
|---|---|---|---|---|---|---|
| N | % | N | % | N | % | |
| Total | 357 | 51 | 342 | 48.9 | 699 | 100% |
| Normal | 184 | 21.2 | 179 | 25.6 | 363 | 51.9 |
| Mild | 99 | 14.2 | 102 | 14.6 | 201 | 28.8 |
| Moderate | 52 | 7.4 | 48 | 6.9 | 100 | 14.3 |
| Sever | 22 | 3.1 | 13 | 1.9 | 35 | 5 |
Table 2: Growth status distribution of height-for-age among school children in DebreMarkos and Gozamenworeda, East Gojjam Zone, Amhara regional state, Ethiopia, June 2013.
Figure 1 showed that children in the age group 13-15 years old, 185 (26.5 %) were stunted. In the age group (7-8) years old 25(3.6%) were stunted (Figure 1).

Figure 1: Prevalence of stunting according to age categories among school children in Debre markos town and GozamenWoreda, East Gojjam Zone, Amhara regional state, Ethiopia, June 2013.
Figure 2 showed that 19.3% in rural and 28.8% in urban children were stunted.

Figure 2: Prevalence of stunting in rural and urban school children, in DebreMarkostown and Gozamenworeda, East Gojjam Zone, Amhara regional state, Ethiopia, June 2013.
Associated factors for stunting: Bivariate and multiple logistic regression analysis were applied to identify the risk of stunting. As showed on Table 3 below, adjusting the confounder variables through bivariate and multivariate logistic analysis, age of the children, rural resident, and children who had 5-8 grade levels was strongly associated with increasing rate of stunting. Age groups of 13-15 years were 2.7 times at risk of stunting as compared to age groups 7-8 ( AOR=2.679, 95% CI = 1.537, 4.669). Children lived in the rural area were 2 times at risk of stunting as compared to live in urban (AOR= 1.928, 95% CI= 1.229, 3.025). Children from grade level 5-8 were 1.5 times at risk of stunting as compared to 1-4 grade level (AOR= 1.559, 95%CI= 1.012,2.401).
| Variables | Stunted | COR (95% CI) | AOR (95% CI) | |
|---|---|---|---|---|
| Yes | No | |||
| Age 7-8 | 25 | 42 | 1.00 | 1.00 |
| 9-10 | 103 | 0.685(0.372, 1.263) | 0.714(.384, 1.328) | |
| 11-12 | 42 | 95 | 1.485**(.835, 2.641) | 1.621(0.901,2.916) 2.679(1.537,4.669*) |
| 13-15 | 84 | 123 | 2.527**(1.465 ,4.358*) | 1.00 |
| Educational level | ||||
| 1-4 | 114 | 199 | 1.00 | 1.00 |
| 5-8 | 222 | 164 | 2.363**(1.740,3.209) | 1.559(1.012,2.401*) |
| Mother’s education | ||||
| Illiterate | 163 | 175 | 1.58**( 0.705, 3.558) | |
| Primary | 92 | 115 | 1.36**(0.594, 3.112) | |
| High school | 46 | 35 | 2.23**(0.912 ,5.475) | |
| College | 25 | 21 | 2.02**(0.765 , 5.355) | |
| University | 10 | 17 | 1.00 | |
| Father’s education Illiterate |
||||
| Primary | 129 | 126 | 1.13**(.648 ,1.956) | |
| High school | 93 | 125 | 0.82 (.466 ,1.436) | |
| College | 44 | 57 | 0.849 (.451, 1.597) | |
| University | 40 | 22 | 2.00**(.976, 4.099) | |
| Illiterate | 30 | 33 | 1.00 | |
| Father’s occupation | ||||
| Gov’tal employee | 106 | 105 | 0.655 (.406, 1.056) | |
| Private employee | 41 | 62 | 0.705 (.445, 1.119) | |
| Merchant | 47 | 66 | 1.082 (.755 , 1.550) | |
| Farmer | 140 | 129 | 1.00 | |
| Mother's occupation | ||||
| Gov'tal employee | 42 | 30 | 1.48**(.809, 2.724) | |
| Private employee | 208 | 218 | 1.011 (.658, 1.556) | |
| Merchant | 36 | 62 | 0.615 (.350, 1.082) | |
| Housewife | 50 | 53 | 1.00 | |
| Resident | ||||
| Rural | 135 | 113 | 1.48**(1.088,2. 029) | 1.93** (1.229,3.025*) |
| Urban | 201 | 250 | 1.00 | 1.00 |
| Source of Water | ||||
| Tap | 263 | 235 | 1.40**(0.702, 2.807) | 2.112 (0.937 , 4.760) |
| Borehole | 51 | 47 | 1.45**(0.665, 3.154) | 1.557(0.690, 3.512) |
| Spring | 27 | 40 | 2.33**(1.016, 5.334*) | 2.19**(0.924 , 5.188) |
| River | 22 | 14 | 1.00 | 1.00 |
| Feeding per day | ||||
| 1-2 times | 33 | 34 | 1.73** (0.669,4.447) | 2.112 (0.937 , 4.760) |
| 3 times | 244 | 254 | 1.70** (0.741,3.937) | 1.557(0.690, 3.512) |
| 4 times | 50 | 59 | 1.50**(0.613,3.703) | 2.19**(0.924 , 5.188) |
| >4 times | 9 | 16 | 1.00 | 1.00 |
Table 3: Bivariate and multivariate logistic regression table for stunting among school children in DebreMarkostown and Gozamenworeda, east Gojjam zone Amhara regional state, Ethiopia, June 2013.
This study was held to determining the prevalence of stunting and identified associated factors for stunting among school Children. School children are considered to be found in a dynamic period of growth and development because children undergo physical, mental, emotional and social changes. In this study, the prevalence of stunting among school children was found to be high, which was 48.1%. This was the highest as compared studies, in Nigeria 17.4% [14], in Kenya 16.64 % [11], in Baghdad Iraq 18.7% [15] and in India 18.5 % [16]. This may be attributed due to differences in socio-economic, cultural, educational, feeding habits, genetic and environmental factors.
In this study, there was no significant difference in stunting among boys and girls (48.5%) and 47.7% respectively). Similarly, a study in Burkina Faso showed that stunting rate was 8.8% of girls and 9.4% of boys [17], and in Palestine 14.3% of boys and 14.4% of girls, from 13- 15 years of age, were stunted [18]. Other studies in Kenya [11], Nigeria [14], Santal [19], and in Bangladesh [20] study explained that more boys were stunted than girls. This may be due to preference towards daughters and this may occur as a result of low socio-economic status or may also be due to cultural influence.
In contrast, study in India and UAE, under nutrition was significantly more prevalent in girls than boys [16]. This discrepancy attributed due to differences in family setups, gender bias and parental preferences for male children in that society.
As the age of children increased risk of stunting increased. Children in the age of 13-15 years were 2.7 times risk of stunting with increasing rate of significant as compared to the youngest school children (7-8 years) (AOR=2.679, 95%CI= 1.537, 4.669). Similarly recent study in India, showed stunting were highly significant at 11-12 years of age [21] and study in Burkina Faso explained that children in the 13-14 years old age group were the most affected group while the youngest children 7-9 age group were not stunted. This may be due to long exposure to chronic malnutrition since most of the growth deficit or catch-up takes place at early age and adverse consequences of childhood under nutrition is recognized later in their life. It may also be due to eating habitual influence; in the society as the children growing up, they work outside the home throughout the day without food.
In this study, even though over all prevalence in girls and boys were similar, but at each age category, stunting rate varied in girls and boys. At the early age, girls were more stunted than boys; however as the age increased boys were more stunted than girls. The prevalence were 23.9%, 16.6%, 25.1% and 25.3% in girls and 13.45%, 12.45%, 21.8% and 34.7% in boys respectively with increasing order of their age. In the age group 13-15 years old, boys were more stunted than girls. The others study in Nigeria Abeokuta indicated the prevalence of stunting was higher among young female children 5-9 years of age while as the age increased boys were more stunted [15]. This could be attributed to socio cultural influence; at the early age parents give priority care for boys than girls. However, when the child becomes older, girls were culturally involved in the cooking of family-food and they had access to food. So girls have better nutritional status as compared to boys.
In this study, rural school children were significantly stunted as compared to urban (AOR=1.928, 95% CI 1.229, 3.025). Similarly, a report in Pakistani showed that rural children with low SES (17%) and urban children with low SES (10%) had significantly and higher risk of being stunted than urban children with middle SES (2%) or high SES (3%) (p = 0.001) [22]. Studies on anthropometric status of rural school children in low income countries (Ghana, Tanzania, Indonesia, Vietnam and India) found the overall prevalence of stunting to be high in all five countries, ranging from 48 to 56% [23]. The other study in Burkina Faso showed, stunting were significantly higher in peri-urban than urban schools [17]. This may be attributed due to differences in income, education and eating practice or low and inadequate food consumption because in rural community people were eating their meals two times per day in the morning and evening, so this could be seen as the main factor to be stunted more in rural than urban.
Age groups from 13-15 years, grade level 5-8 children and living in rural area were independently associated with increasing rate of stunting. Chronic malnutrition remains a prominent feature of both rural and urban school children, in east Gojjam zone, Amahara regional state. Cumulative stunting of this study was 48.1%; 5% were severely stunted (<-3SD), 14.3% moderately stunted (<-2SD) and 28.8% mildly stunted (<-1SD).
The study was sponsored by Addis Ababa University, college of health sciences, department of nursing for giving this opportunity to do the research. The authors express their gratitude thanks to the East Gojjam zone educational bureau as well as Debre Markos town and Gozamen woreda educational offices. The authors thank the principals of all schools and teachers for giving them permission to use their pupils. They also thank all the pupils who participated in the study.