Journal of Nutrition & Food Sciences
Open Access
ISSN: 2155-9600
ISSN: 2155-9600
Research Article - (2015) Volume 5, Issue 1
This experiment was conducted to optimize temperature and time for hot smoking of Nile Tilapia in order to get the most nutritive quality. Three levels of smoking temperature (80 ± 3°C, 90 ± 3°C and 100 ± 3°C) and time (2:00, 2:30 and 3:00 hours) were used. Accordingly, Face centered central composite design using Design expert (version 7.0.0., Stat-Ease, Minneapolis, MN) was used to optimize and evaluate main effects, interaction effects and quadratic effects of smoking temperature and time on gross energy value and overall sensory acceptability. A Multiple Linear Regressions Analysis (MLRA) was performed to determine all the coefficients of constant, linear, quadratic and interaction terms using least square minimization to fit the intended model to the collected data. The lack of fit test was used to evaluate the fitness of the generated model using coefficient of determination (R2). The adequacy of the model was justified through Analysis of Variance (ANOVA).The result show that all the built polynomial equations were found to be statistically non-significant as determined by ANOVA, lack of fit is nonsignificant and the model is less adequate to sufficiently describe the experimental data. The numerical optimization using desirability approach of all combination resulted in smoking temperatures and times were found to be optimum to produce good gross energy value and sensory acceptability of smoked fish. From model summary statistics, a negative predicted R2 implies the overall/grand mean is a better predictor of gross energy value and overall sensory acceptability than the current model. Accordingly, Nile Tilapia (Oreochromis niloticus) smoked at 80 ± 3°C for 2:00 and 80 ± 3°C for 3:00 hour possessed the highest gross energy value (kcal) for non-dried and pre-dried respectively and fish smoked at 100 ± 3°C for 2 and 3 hours and 90 ± 3°C for 2 and 3 hours possessed highest overall sensory acceptability for non-dried and pre-dried respectively.
Keywords: Nile tilapia; Optimization; Smoking; Temperature; Time
Fish is an important source of food and income to many people in the developing world. The high moisture content of fish renders it extremely perishable. It has been estimated that in the high ambient temperatures of the tropics, fish spoils within 12-20 hours of being caught depending on species and size [1]. As fish is rich in protein with an amino acid composition very well suited to human dietary requirements comparing favorably with eggs, milk and meat, there shall be appropriate method to preserve those mentioned nutrients. Smoking of fish have developed over many centuries, largely to suit the prevailing climate and is a good method of drying and preserving fish where there is no cold facility for fresh fish handling. Smoke curing of fish is an ancient traditional method aimed at preserving fish by exposure to heat and smoke. The components of wood smoke deposited on fish are not only imparting good flavor and color, but also increases stability due to their bactericidal and antioxidant properties [2]. The reason for smoking fish are varied, the process has proved to prolong its shelf life, enhance flavor and increase utilization in soups and sauces, reduce wastage times of bumper catches, store for the lean season and increase protein availability to people throughout the year [3]. However, it requires skill and experience to produce a high quality end product that will keep long shelf life as well as high nutrient quality resemble to the natural one. Hot smoking of fish involves temperature of more than 800C and the fish is cooked during processing. Excessive heat treatment is known to impair the nutritional value of fish protein as a result of variety of chemical reactions [4-8] demonstrated that traditionally prepared hot smoking fish can suffer appreciable protein damage, finding a loss of lysine availability in traditionally smoked Tilapia nilotica in Uganda.
The exposure of wet fish to high temperature is the most likely cause of protein damage. Smoking at 85°C lowered lysine availability and net protein utilization (NPU) [8], however heating dry fish up to 105°C without an appreciable decrease in NPU. Similarly a temperature of 110oC did not appear to cause any nutritive damage to dry fish protein concentration (FPC) even after four hours exposure [9]. Obileye and Spinelli [10] smoke Tilapia after drying it at 30°C for two hours to moisture content of 40% before hot smoking. Such treatment causes only minor losses (>20%) in lysine availability, and most of this resulted from the initial drying stage rather than subsequent hot smoking. Thus, in dried fish the protein may be less sensitive to heat damage, but more evidence is required before definite conclusions can be drawn as to the relationship between the temperature and time of treatment, moisture content of fish and the degree of protein damage [11].
Smoking is a method of preserving fish which involves some processes of cooking, drying and preservative value of the smoke [3]. Smoking is a traditional fish preservation method of considerable economic importance worldwide. The smoke is produced by the process of incomplete combustion of wood in order to impart characteristic flavor and color to the fish. In addition, smoking increases shelf life of fish as a result of the combined effect of dehydration, antimicrobial and antioxidant activity of several smoke constituents mainly; formaldehyde, carboxylic acid and phenols. Numerous study have been carried to investigate the effect of hot smoking on proximate composition, minerals content, microbiological quality, biochemical composition and organoleptic acceptability of smoke fish. However, there are limited studies which investigate the prediction of optimum smoking temperature and time.
Fish smoking conditions must be standardized, controlled, monitored, and documented so the potential for producing toxic, or even lethal, food products is eliminated. It is therefore important to ascertain how the smoking temperatures and time affect some of the nutritional properties of smoked fish. The present study therefore was conducted to provide scientific information on the effect of smoking temperature and time on the gross energy value/caloric/ and over all sensory acceptability of smoked Nile Tilapia using acacia wood.
Sample collection and preparation
A total of fresh 204 Nile Tilapia (Oreochromis niloticus) both sex was purchased from menefash lading site of Lake Zeway. The fish was taken to Zeway fishery resources research center where the experiment was carried out. The fish was washed, cleaned, gutted and kept in brine solution for 40 minutes. Out of 204 fish, 144 were used for proximate composition analysis and 60 fish was used for sensory evaluation. Sample was analyzed in quadruplicate.
Smoking process
Smoking was performed using four altona ovens each having dimension of 1 m × 1.28 m × 1.75 m. Fish were divided into two groups for smoking. Half group of fish was smoked directly after taken out of brine solution. The remaining lot was dried using solar tent dryer for two hours after taken out of brine solution. Fire wood (Acacia) was set up in the combustion chamber and then lighted. The temperature of smoke generated was monitored in the smoking chamber until the required temperature was obtained. To be certain whether the set temperature is in check or not, digital infrared (IR) thermometer with distance (D) to spot size (D:S) = 12:1 was used to measure the temperature. Once the required temperature was obtained, the fish was placed inside the oven by screwing fish eye using one side sharpen metal rod. The burning wood was adjusted continuously to maintain the required temperature in the oven. In this study, three different smoking temperatures of 80 ± 3°C, 90 ± 3°C and 100 ± 3°C and three different smoking time 2:00 hr., 2:30 hr. and 3:00 hr. were used.
Proximate composition analysis
Moisture content analysis: Moisture content was determined by Oven drying method immediately after smoking was completed. Empty crucibles were dried using air drying oven for 1 hour at 105°C. Immediately after smoking was completed, 5 g of fish flesh taken from the dorsal part of fish was transferred to the dried and weighed crucibles. The crucibles and their contents were placed in the drying oven and dried for 10 hrs. at 105°C in an oven. The moisture content was determined by measuring the weight of a sample before and after the water was removed by evaporation using:

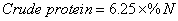
Crude protein analysis: Crude protein content of smoked fish was quantified by Kjeldahl methods. 5 g of powdered fish fillet was weighed into tecator tube and then digested by heating at 370°C for three hours in the presence of 6 mL mixed sulfuric acid and orthophophoric acid, 3.5 mL H2O2, 3 g of catalyst potassium Sulfate (K2SO4) and Selenium. After digestion was completed, formed clear solution was cooled for 30 minutes. After cooling, it was distilled by steam distillation with 25 mL of 40% of sodium hydroxide and the ammonium is released as a form of ammonia. Finally, the condensed NH3 is trapped by 1% boric acid and titrated by 0.1N HCl.
Note: all reagents were added to the blank except the sample. The nitrogen content was estimated by titration of the borate anion formed with 0.1N HCl. The amount of Nitrogen was calculated using the formula:

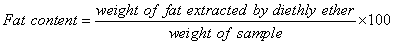
Crude fat analysis: Crude fat was determined by sox let extraction methods. 3.5 g powdered smoked fish was weighed into a clean aluminum cup with boiling chips that has been dried at 92°C. Thimble was covered with fat free cotton and attached to magnetic ring to hang the thimble. 70 ml diethyl ether was added to aluminum cup through the condenser. The extraction process will continue for three hours and twenty minutes. At the end of the extraction process, the aluminum cup containing the solvent and lipid was removed, the solvent was evaporated in drying oven at 92°C for at least 30 minute and the mass of lipid remaining was quantified gravimetrically and calculated from the difference in weight of the aluminum cup before and after extraction as percentage. The crude fat in the initial sample was calculated as:
Eventually protein and fat content in wet base was recalculated from dry base using the formula:

Gross energy value: Gross energy values (kcal/g) was calculated by overall addition of the protein content multiplied by 4 and the total lipids content multiplied by 9 and using Atwater’s conversion factors. The result was expressed as kcal per 100 gram.

Sensory evaluation
Organoleptic characteristics of smoked fish like texture, flavor, odor, appearance and overall acceptability was evaluated. For this reason ten consumer panels comprised of Zeway fisheries resources research center staff were used to determine consumer reaction to a product. Due to large sample size, four digit random numbers were used to code the samples. Coded samples were presented randomly. Taste neutral water was provided for oral rinsing between samples after each bite to eliminate the taste of the previous fish sample. The consumers expressed degree of liking or disliking using nine point hedonic scale ranging from “like extremely” to dislike extremely [12].
Experimental design for optimization
The experiment was conducted using full factorial design (2 x 3 x 3). Response surface methodology was employed using three independent factors, two numerical factors and one categorical factor. The drying conditions prior to smoking, time and temperature of smoking were regarded as independent variables. The numerical factors namely temperature and time of smoking were chosen to have three levels. The two levels of categorical factor was fish dried using solar tent dryer for two hours prior to smoking and not. Nine experiments covering three time of smoking and three temperature of smoking were conducted with both dried fish prior to smoking and not. All other conditions like fish size, cleaning methods and gutting procedures, size of smoking oven and concentrations of brine solution were kept constant throughout the smoking process. The responses used were gross energy value and overall organoleptic acceptability of smoked fish. The experiment was repeated two times and proximate data were determined in quadruplet. It has been assumed that the responses (Yk) are the function of three independent variables mentioned in equation 1: K (1,2) indicating gross energy value and overall sensory acceptability of smoked fish.

Where: T° smoking temperature
t smoking temperature
c drying condition prior to smoking i.e. solar tent dried or not
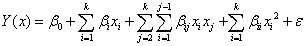
The optimal point was predicted by the quadratic model based on the following Equation (2). In the following equation X1 stands for temperature and X2 stands for time. The responses (gross energy value and overall sensory acceptability) for different experimental combinations were related to the coded variables (xi, i = 1 and 2) by second degree polynomial equation, because it is interesting and very flexible model to describe experimental data in which there is [13].
Response surface methodology is a sequential form of experimentation used to help predict or optimize response (dependent, outcome) variables made up of a mathematical-statistical model of several input (independent, predictor) factors. The most common response surface methodology is central composite design which consists of CCI, CCC and CCF types. Both CCI and CCC require five test levels however face centered CCD requires only three test levels because α value is taken as one. Hence, Face centered CCD using Design expert (version 7.0.0., Stat-Ease, Minneapolis, MN) was used to optimize and evaluate main effects, interaction effects and quadratic effects of smoking temperature and time on gross energy value and overall sensory acceptability. A Multiple Linear Regressions Analysis (MLRA) technique that is included in the response surface methodology was performed to determine all the regression coefficients of constant, linear, quadratic and interaction terms using least square minimization to fit the intended model to the collected data. The lack of fit test was used to evaluate the fitness of the model using coefficient of determination (R2). The adequacy of the model was justified through analysis of variance (ANOVA). Finally, a numerical optimization technique using the desirability approach was employed to establish the optimum level of smoking temperature and time with the desired gross energy value and overall sensory acceptability.
It can be seen that the smoking process of Nile Tilapia mainly depends on smoking process such as; temperature of smoking (X1, °C) and smoking time (X2, hr). These technological parameters affect objective functions: the amount of calorie/gross energy value obtained (Y1, Kcal/g) and overall sensory acceptability of the product (Y2) (Table 1)
| Independent variables | Symbol | Coded level | ||
|---|---|---|---|---|
| -1 | 0 | 1 | ||
| Smoking temperature (°C) Smoking time (hr) |
X1 X2 |
80 ± 3°C 2:00 |
90 ± 3°C 2:30 |
100 ± 3°C 3:00 |
Table 1: Coded and real value of smoking temperature and time.
Design of experiments (DOE)
Arrangement of face centered CCD of experiments for gross energy value of wet/non-dried/ and predried smoked nile tilapia and arrangement of face centered CCD of experiments for overall sensory acceptability of non dried and predried smoked Nile Tilapia (Tables 2 and 3).
| Experimental run | 1 | 2 | 3 | 4 | 5 | 6 | 7 | 8 | 9 | 10 | 11 | 12 | 13 |
| Temperature | 0 | 1 | -1 | 0 | 0 | 0 | 0 | 1 | 0 | 1 | -1 | 0 | -1 |
| Time | 0 | 1 | -1 | 0 | -1 | 0 | 0 | 0 | 1 | -1 | 1 | 0 | 0 |
| Gross energy value (Kcal) Predried | 313.77 | 296.25 | 314.02 | 278.24 | 291.79 | 277.76 | 349.53 | 301.63 | 308.96 | 296.25 | 320.45 | 349.58 | 315.06 |
| Gross energy value (Kcal) Non dried | 277.38 | 283.13 | 284.18 | 258.66 | 262.64 | 260.86 | 294.52 | 263.36 | 268.29 | 259 | 279.3 | 295.47 | 280.37 |
Table 2: Arrangement of face centered CCD of experiments for gross energy value of wet/non-dried/ and predried smoked nile tilapia.
| Experimental run | 1 | 2 | 3 | 4 | 5 | 6 | 7 | 8 | 9 | 10 | 11 | 12 | 13 |
| Temperature | 0 | 1 | -1 | 0 | 0 | 0 | 0 | 1 | 0 | 1 | -1 | 0 | -1 |
| Time | 0 | 1 | -1 | 0 | -1 | 0 | 0 | 0 | 1 | -1 | 1 | 0 | 0 |
| Gross energy value (Kcal) Non dried | 8.5 | 8.2 | 7.9 | 7.3 | 7.9 | 8 | 7.7 | 8 | 8 | 8.2 | 7.4 | 7 | 7.8 |
| Gross energy value (Kcal) Predried | 7.7 | 7.7 | 7.4 | 8 | 7.7 | 8 | 7.6 | 8.1 | 8.1 | 7.5 | 7.6 | 7.4 | 7.5 |
Table 3: Arrangement of face centered CCD of experiments for overall sensory acceptability of non dried and predried smoked Nile Tilapia.
Building of mathematical model
Mathematical relationships was generated using multiple linear regression analysis was performed using design expert and the following coefficient was obtained for each response studied. The method of least square was used to estimate the regression coefficients in the multiple linear regression models.
Gross energy value =275.10-6.39X1+4.15 X2+7.25 X1X2 +2.42 X12-3.97X22(non dried)
Gross energy value =311.55-6.36 X1+6.80 X2+2.70 X1X2 +2.34 X12- 5.62 X22(pre-dried)
Overall sensory acceptability=7.73+0.216X1-0.66X2+0.125X1X2+0. 913X1 2+0.141X2 2-non dried)
Overall sensory acceptability=7.7+0.033X1+0.11X2-0.125X1X2- 0.262X12+0.287X2 2-for pre dried
In the above empirical models X1 and X2 are independent variables often called predictor variables or repressors, their coefficients are called partial regression coefficients, because β1 measures the expected change in y per unit change in x1 when x2is held constant, and β2 measures the expected change in y per unit change in x2 when x1 is held constant. The sign and magnitude of the main effects signify the relative influence of each factor on the response (Table 4).
| Source | Sum of square | df | Mean square | F-Value | P-value Prob>F |
|---|---|---|---|---|---|
| Model | 605.25 | 5 | 121.05 | 0.58 | 0.7132 (Non-siginificant ) |
| Temp | 245.25 | 1 | 245.25 | 1.18 | 0.3125 |
| Time | 103.34 | 1 | 103.34 | 0.50 | 0.5028 |
| Temp* Time | 210.40 | 1 | 210.40 | 1.02 | 0.3470 |
| Temp2 | 16.29 | 1 | 16.29 | 0.079 | 0.7872 |
| Time2 | 43.56 | 1 | 43.56 | 0.21 | 0.6604 |
| Residual | 1449.65 | 7 | 207.09 | ||
| Lack of fit | 205.28 | 3 | 68.43 | 0.22 | 0.8781(Non-sigificant) |
| Pure error | 1244.38 | 2 | 311.09 |
Table 4: ANOVA for response surface quadratic model of gross energy value of
wet/non pre-dried smoked Nile Tilapia.
The «Model F-value» of 0.58 implies the model is not significant relative to the noise. There is a 71.32% chance that a «Model F-value» this large could occur due to noise. The «Lack of Fit F-value» of 0.22 implies the Lack of Fit is not significant relative to the pure error. There is a 87.81% chance that a «Lack of Fit F-value» this large could occur due to noise (Table 5).
| Source | Sum of square | Df | Mean square | F-Value | P-value Prob>F |
|---|---|---|---|---|---|
| Model | 637.43 | 5 | 127.49 | 0.17 | 0.9665 (Non siginificant) not significant |
| X1 | 242.70 | 1 | 242.70 | 0.32 | 0.5893 |
| X2 | 277.98 | 1 | 277.98 | 0.37 | 0.5640 |
| X1X2 | 29.21 | 1 | 29.21 | 0.039 | 0.8500 |
| X12 | 15.18 | 1 | 15.18 | 0.020 | 0.8915 |
| X22 | 87.40 | 1 | 87.40 | 0.12 | 0.7442 |
| Residual | 5309.09 | 7 | 758.4 | 0.049 | |
| Lack of fit | 188.86 | 3 | 62.95 | 0.9836 (Not significant) | |
| Pure error | 5120.23 | 4 | 1280.06 |
Table 5: ANOVA for response surface quadratic model of gross energy value of pre-dried smoked Nile Tilapia.
The «Model F-value» of 0.17 implies the model is not significant relative to the noise. There is a 96.65% chance that a «Model F-value» this large could occur due to noise. The «Lack of Fit F-value» of 0.05 implies the Lack of Fit is not significant relative to the pure error. There is a 98.36% chance that a «Lack of Fit F-value» this large could occur due to noise (Table 6).
| Source | Sum of square | df | Mean square | F-Value | P-value Prob>F |
|---|---|---|---|---|---|
| Model | 0.49 | 5 | 0.099 | 0.46 | 0.79 (NS) |
| Temp | 0.28 | 1 | 0.28 | 1.32 | 0.28 |
| Time | 0.027 | 1 | 0.027 | 0.12 | 0.73 |
| Temp * Time | 0.063 | 1 | 0.063 | 0.29 | 0.60 |
| Temp2 | 0.023 | 1 | 0.023 | 0.11 | 0.75 |
| Time2 | 0.055 | 1 | 0.055 | 0.26 | 0.62 |
| Residual | 1.50 | 7 | 0.21 | ||
| Lack of fit | 0.12 | 3 | 0.039 | 0.11 | 0.948 (NS) |
| Pure error | 1.38 | 4 | 0.34 |
Table 6: ANOVA for response surface quadratic model of overall sensory acceptability for non-dried smoked Nile Tilapia.
The «Model F-value» of 0.46 implies the model is not significant relative to the noise. There is a 79% chance that a «Model F-value» this large could occur due to noise. The «Lack of Fit F-value» of 0.11 implies the Lack of Fit is not significant relative to the pure error. There is a 94.8% chance that a «Lack of Fit F-value» this large could occur due to noise (Table 7).
| Source | Sum of square | df | Mean square | F-Value | P-value Prob>F |
|---|---|---|---|---|---|
| Model | 0.45 | 5 | 0.091 | 1.98 | 0.1994 (NS) |
| Temp | 6.667E-0.003 | 1 | 6.667E-0.003 | 0.14 | 0.7148 |
| Time | 0.082 | 1 | 0.082 | 1.77 | 0.2245 |
| Temp* Time | 0.062 | 1 | 0.062 | 1.36 | 0.2820 |
| Temp2 | 0.19 | 1 | 0.19 | 4.12 | 0.0819 |
| Time2 | 0.25 | 1 | 0.25 | 4.98 | 0..609 |
| Residual | 0.32 | 7 | 0.046 | ||
| Lack of fit | 0.15 | 3 | 0.05 | 1.16 | 0.421(NS) |
| Pure error | 0.17 | 4 | 0.043 |
Table 7: ANOVA for response surface quadratic model of overall sensory acceptability for pre dried smoked Nile Tilapia.
The «Model F-value» of 1.98 implies the model is not significant relative to the noise. There is a 19.94% chance that a «Model F-value» this large could occur due to noise. The «Lack of Fit F-value» of 1.16 implies the Lack of Fit is not significant relative to the pure error. There is a 42.1% chance that a «Lack of Fit F-value» this large could occur due to noise.
Three dimension of response surface plot
Response surface 3D plot of smoking time and temperature level against gross energy value smoked Nile Tilapia (wet) and (Predried) (Figures 1 and 2). Response surface 3D plot of smoking time and temperature level against overall sensory acceptability non-dried smoked Nile Tilapia and pre-dried smoked Nile Tilapia (Figures 3 and 4).

Figure 1: Response surface 3D plot of smoking time and temperature level against gross energy value smoked Nile Tilapia (wet).

Figure 2: Response surface 3D plot of smoking time and temperature level against gross energy value smoked Nile Tilapia (pre-dried).

Figure 3: Response surface 3D plot of smoking time and temperature level against overall sensory acceptability non-dried smoked Nile Tilapia.

Figure 4: Response surface 3D plot of smoking time and temperature level against overall sensory acceptability pre-dried smoked Nile Tilapia.
Model adequacy checking
Once a mathematical model has been established, optimization of the process, that is, finding the unique set of process conditions that produces the best results, is carried out [14]. It is always necessary to examine the fitted model to ensure that it provides an adequate approximation to the true system [13] (Tables 8 and 9).
| Response | Mean | CV | Std. dev | R2 | Adjusted R2 | Predicted R2 | Adeq precision | PRESS |
|---|---|---|---|---|---|---|---|---|
| Non-dried | 274.40 | 5.24 | 14.39 | 0.2945 | -0.2094 | -0.5956 | 2.880 | 3278.77 |
| Pre dried | 310.04 | 8.88 | 27.54 | 0.1072 | -0.5305 | -0.4792 | 1.489 | 8796.34 |
Table 8: Model summary statistics of overall gross energy for both non-dried and pre dried smoked fish.
| Response | Mean | CV | Std.dev | R2 | Adjusted R2 | Predicted R2 | Adeq precision | Press |
|---|---|---|---|---|---|---|---|---|
| Not-dried | 7.84 | 5.9 | 0.46 | 0.24 | 0.288 | -0.54 | 2.175 | 3.04 |
| Pre dried | 7.72 | 2.78 | 0.21 | 0.58 | 0.28 | -0.99 | 4.8 | 1.55 |
Table 9: Model summary statistics of overall sensory acceptability for both non-dried and pre dried smoked fish.
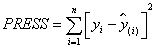
All the built polynomial equations were found to be statistically non-significant as determined by ANOVA. The lack of fit of the model was checked by determination coefficient (R2). Coefficient of determination explains percentage of variability explained by the regression. The R2 value is always between 0 and 1, and a value greater than 0.75 indicates aptness/correctness of the model. The R2 value less than 0.75 usually indicate an insufficiently precise description of the experimental data. For the good statistical model, R2 value should be close to 1. Small predicted R2 values (<0.7) in this experiment indicate that the model has poor predictive ability and have large prediction error. The R2value is an over estimate of goodness of fit. Thus it is usually modified into adjusted R2 by taking into account the degree of freedom of the model. Prediction error sum of squares (PRESS) was also used to check for model adequacy. It is the sum of the squared differences between the experimental response y and the response predicted by the regression model.
Negative predicted R2 indicates PRESS is greater than total mean square. Coefficient of variation (CV) describes the extent to which the experimental data are dispersed and in the models developed. The values of CV indicate that there is deviation between experimental and predicted values. Adequate precision is a measure of the range in predicted response relative to its associated error. Adequate precision measures the signal to noise ratio. A ratio greater than 4 is desirable. In this experiment the ratio of three mathematical model equations were found to be lower than four.
Numerical optimization of smoking temperature and time
Numerical optimization using desirability function approach has provided the “most desirable” response values. For both responses yi (x), a desirability function di (yi) assigns numbers between 0 and 1 to the possible values of yi, with di (yi) = 0 representing a completely undesirable value of yi and di(yi) = 1 representing a completely desirable or ideal response value. Numerical optimization using desirability approach has generated 30 solution set for all quadratic model, where the desirability equal to 1 indicating that all combination of independent factors are desirable. Generally, from model summary statistics, a negative predicted R2 implies, the model is bad predictive model, hence, the overall/grand mean is a better predictor of gross
Gross energy value/calorie
The nutritional value of fish comprises the contents of moisture, dry matter, protein lipids, vitamins and minerals plus the caloric values of the fish [15]. The proximate composition (crude protein and crude fat) of smoked fish is generally higher as compared to raw fish due to loss of moisture content/water during smoking. This could be attributed to the extent of drying which lowered moisture and concentrated proteins. The moisture content of wet/ non-dried/ smoked fish higher as compared to pre-dried for similar temperature and time could be due to loss of water through dehydration during drying. According to Sigurgisladottir et al. [16], the weight loss is due to dehydration during smoking. This is known to vary, depending on several factors such as, origin of raw material, final product characteristics and parameters used in the process, time and temperature. The moisture content of non-dried smoked fish was higher than dried smoked samples however lower in crude protein. Ipinmoroti [17] indicated that fish dried in solar tent dryer gave the best final products in terms of low moisture content and highest protein. The low moisture content has significant implication on shelf life of dried products, microbial activities and deterioration processes proceed faster with increasing moisture levels, thus affecting organoleptic characteristics, processing potential and consumer acceptability of fish products. Smoking drastically reduces the moisture content of the smoked fish to levels that fall within the range that will contribute to good storage, and not favor the development of Mycotaxon producing moulds [18].
The increase in moiture content of the non dried smoked at 100°C for 2 hours as compared to the others could due to water reabsorption. It is observed that protein contents increased with decrease in moisture content [19]. From the results Table 10, it can be seen that smoking of fish at 80 ± 3°C for duration of 2:00 for non-dried and 80 ± 3°C for duration of 3:00 hour for dried smoked is adequate for both safe storage and maintenance of the desirable nutritive quality of the dried products. It has been noted that a fish well dried with moisture reduced to 25% (wet basis) will not be affected by spoilage organisms like mould and that if further dried to moisture content of 15%, the growth of mould will cease and the shelf life will increase [2]. It can be seen from these results that these safe moisture contents can effectively be achieved by smoke drying the fish at smoking temperature of 80 ± 30c for a duration of 2:00 hour for non-dried and 80 ± 3°C for a duration of 3:30 hour for dried smoked. Although there is irregularity on calorie of fish smoked at 80°C and 90°C of non-dried smoked fish, there is an increasing trend in calorie of smoked fish at the same temperature but different smoking time.
| Experimental run | Processing conditions |
Temperature (°C) |
Time (hr) |
Moisture Contents |
Protein Contents |
Fat contents | Gross energy value (Kcal/g) |
|---|---|---|---|---|---|---|---|
| 1 2 3 4 5 6 7 8 9 |
Not dried after brining | 80 ± 3 | 2:00 | 35.00 | 52.91 | 8.06 | 284.18 |
| 2:30 | 30.00 | 59.24 | 4.81 | 280.37 | |||
| 3:00 | 29.00 | 60.81 | 4.00 | 279.30 | |||
| 90 ± 3 | 2:00 | 34.00 | 58.54 | 3.16 | 262.64 | ||
| 2:30 | 30.00 | 59.52 | 4.36 | 277.38 | |||
| 3:00 | 33.00 | 58.83 | 3.65 | 268.29 | |||
| 100 ± | 2:00 | 37.00 | 53.10 | 5.17 | 259.00 | ||
| 2:30 | 35.00 | 55.55 | 4.57 | 263.36 | |||
| 3:00 | 31.00 | 57.85 | 5.74 | 283.13 | |||
| 10 11 13 13 14 15 16 17 18 |
Pre-dried after brining |
80 ± 3 | 2:00 | 26.00 | 62.17 | 7.25 | 314.02 |
| 2:30 | 26.00 | 62.35 | 7.29 | 315.06 | |||
| 3:00 | 25.08 | 64.10 | 7.11 | 320.45 | |||
| 90 ± 3 | 2:00 | 26.00 | 62.44 | 4.66 | 291.79 | ||
| 2:30 | 26.00 | 61.97 | 7.31 | 313.77 | |||
| 3:00 | 25.33 | 64.12 | 5.82 | 308.96 | |||
| 100 ± 3 | 2:00 | 25.33 | 65.50 | 3.80 | 296.25 | ||
| 2:30 | 25.50 | 64.68 | 4.76 | 301.63 | |||
| 3:00 | 24.50 | 63.52 | 6.59 | 313.49 |
Table 10: The effects of smoking temperature and time on gross energy value/calorie of Nile Tilapia (O. niloticus).
There is no exaggerated change in protein contents, this could be due to protein nitrogen was not lost during smoking at those temperatures [20]. The highest gross energy value was obtained 80 ± 3°C for 3:00 hour (pre dried) while the lowest was found at 100 ± 3°C for 2:00 hour (non- dried smoked). There is no significant variation in moisture, crude protein and fat contents between wet and predried smoking process for similar temperature and time of smoking. Contrary to the present finding, smoking temperatures and time can influence the nutritive and physical quality parameters of dried tilapia [21].
Overall sensory acceptability
Sensory evaluation is a scientific method that evokes measures, analyzes, and interprets responses to products, as perceived through the senses of sight, smell, touch, taste, and sound [22]. Smoking duration can gives effect on organoleptic value and proximate composition of smoked fish. Some sensory (organoleptic) parameters like flavor, texture, appearance, odor and taste were examined and their results are presented in Table 11. The best smoked tilapia with very good quality was samples smoked at 100 ± 3°C for 2 and 3 hours for nondried smoked fish and 90 ± 3°C for 2 and 3 hours for pre dried smoked fish. The sensory attributes were evaluated by a non-trained panel. Flavor, odor, appearance (color), texture and general acceptance were evaluated in a hedonic scale of 9 points (from 9 = I liked it very much to 1 = I disliked it very much). The effect of smoke curing with respect to quality and shelf life of the product depends on the preparation of the raw material, the type of smoking, the relative humidity, velocity, temperature, density, and composition of the smoke, and the time of smoking [2]. Smoking gives also an appealing smoked color and smoky flavor to the fish. Methods of smoking, curing, and drying of fish were originally developed for purely pragmatic reasons to prevent loss through spoilage. However, over time a preference for the taste and texture of smoked, cured, and dried products has developed with the result that there is a demand for these products even though, because of cold storage and improved distribution networks, they are not needed to preserve the fish [23-26].
| Experimental run | Processing conditions |
Temperature (C°) |
Time (hr) |
Texture | Flavor | Odor | Appearance | Overall acceptability |
|---|---|---|---|---|---|---|---|---|
| 1 2 3 4 5 6 7 8 9 |
Not dried after brining | 80 ± 3 | 2:00 | 7.8 | 7.5 | 7.7 | 7.1 | 7.9 |
| 2:30 | 7.0 | 7.1 | 7.5 | 7.9 | 7.8 | |||
| 3:00 | 7.8 | 8.2 | 7.4 | 7.0 | 7.4 | |||
| 90 ± 3 | 2:00 | 8.0 | 7.7 | 7.2 | 7.7 | 7.9 | ||
| 2:30 | 8.1 | 7.7 | 8.2 | 8.1 | 7.7 | |||
| 3:00 | 8.0 | 7.6 | 7.9 | 7.6 | 8.0 | |||
| 100 ± | 2:00 | 8.2 | 8.1 | 8.0 | 8.4 | 8.2 | ||
| 2:30 | 8.4 | 8.4 | 8.0 | 8.0 | 8.0 | |||
| 3:00 | 8.2 | 7.8 | 8.2 | 7.9 | 8.2 | |||
| 10 11 13 13 14 15 16 17 18 |
Pre-dried after brining |
80 ± 3 | 2:00 | 7.2 | 7.2 | 7.1 | 7.1 | 7.4 |
| 2:30 | 7.4 | 7.5 | 7.4 | 7.0 | 7.4 | |||
| 3:00 | 7.7 | 7.0 | 7.8 | 7.8 | 8.0 | |||
| 90 ± 3 | 2:00 | 8.4 | 8.1 | 8.4 | 7.9 | 8.1 | ||
| 2:30 | 8.2 | 8.1 | 8.5 | 7.7 | 7.7 | |||
| 3:00 | 8.4 | 8.2 | 7.6 | 8.0 | 8.1 | |||
| 100 ± 3 | 2:00 | 8.0 | 7.7 | 7.8 | 7.4 | 7.6 | ||
| 2:30 | 8.4 | 8.1 | 7.9 | 7.6 | 7.7 | |||
| 3:00 | 7.9 | 7.6 | 7.6 | 7.4 | 7.7 |
Table 11: Mean values of sensory evaluation of smoked Nile tilapia (Oreochromis niloticus).
Smoking temperature and time gives an effect on organoleptic value, proximate composition content of smoked fish. The better preservation method is therefore one that produces a final product that retains its nutritional properties to a level that is beneficial to consumers at the time of consumption. With this regards, Nile Tilapia (Oreochromis niloticus) smoked at 80 ± 3°C for a duration of 2:00 for non-dried and 80 ± 3°C for a duration of 3:00 hour for dried smoked fish possessed the highest gross energy value/calorie and fish smoked at 100 ± 3°C for 2 and 3 hours for non-dried smoked fish and 90 ± 3°C for 2 and 3 hours for pre dried smoked fish possessed the highest overall sensory acceptability.
The authors are grateful to Oromia Agricultural Research Institute for financial support. Ethiopian Health and Nutrition Research Institute are gratefully acknowledged for proximate composition analysis of the samples. The whole staffs of Zeway fisheries resources research centers are indebted for sensory evaluation of smoked fish. Kasim Indirs and Bune Uki deserve special gratitude for commitment and effort during sample collection, preparation and smoking.