Journal of Nutrition & Food Sciences
Open Access
ISSN: 2155-9600
ISSN: 2155-9600
Research Article - (2012) Volume 0, Issue 0
The ohmic heating rate of a food is highly influenced by its electrical conductivity (σ). In this study, tomato was ohmically heated by using five different voltage gradients (6–14 V/cm). Measurements were made from 26 to 96°C and showed a linear increase in σ values with increasing temperature. The voltage gradient was statistically significant on the heating time (P < 0.05). The ohmic heating system performance coefficients were in the range of 0.716-0.905. The pH varied from 4.20 to 4.51, over the voltage gradient range studied.
Keywords: Ohmic heating; Electrical conductivity; Tomato paste; pH; System performance
Conventional heating processes essentially consist of heat-transfer mechanisms of conduction, convection and radiation. The internal resistance by conduction results in very heterogonous treatment and the notable loss of product quality [1-4]. To overcome these problems, alternative technologies utilizing electrical energy directly in the food processing have attracted interest in the food industry in recent decades.
Ohmic heating is a food processing operation in which heat is internally generated within foods by the passage of alternating electric current [5]. The applicability of ohmic heating is dependent on the electrical conductivity of the product [6,7]. The electrical conductivity of foods affects with temperature, applied voltage, concentration of the electrolytes, food particle size and type of pretreatment [7-10]. Ohmic heating is an alternative heating system for pumpable foods [6,10,11]. It can be used as a continuous in-line heater for cooking and sterilization of viscous liquids and mixtures containing particulate food products.
Ohmic heating yields better products, clearly superior in quality than those processed by conventional heating [11-13]. Its advantages compared to conventional heating also include the more uniform and faster heating, higher yield and higher retention of nutritional value of food [14-17]. This is mainly due to its ability to heat materials rapidly and uniformly leading to a less aggressive thermal treatment.
Tomato is the world’s most commercially produced vegetable. Tomatoes are excellent sources of vitamin A, B6, C, thiamin, niacin, phosphorus, potassium, and manganese [18,19]. Besides, they are high in sugar and dietary fiber, low in saturated fat, and are important sources of beta-carotene. Since fresh tomatoes quickly perish due to their high moisture content and are a seasonal product, they are processed into floor through a well-established method in some country. The popular tomato products are tomato juice, tomato ketchup, tomato paste, tomato puree, tomato sauce, tomato passata, and tomato chips. Furthermore, its waste can be used to produce methane gas. Also, pH is an important factor in electrode corrosion and electrolytic reactions, influencing the degradation of ascorbic acid in the fluid food.
The objective of this work was to obtain electrical conductivity data for tomato to be heated ohmically in food industry. Effects of voltage gradients on ohmic heating rates, system performance and pH changes of tomato were studied.
Sample preparation
Tomato samples were procured from local vegetable market in Ilam, Iran. The samples were stored at 5±0.5°C before they were used in experiments. After 2 h stabilization at ambient temperature, homogeneous samples (range between 45–60 g) were washed, crushed and mixed in a way that a red less-viscous liquid obtained. The average moisture content of the samples was determined gravimetrically by drying representative samples in a conventional oven at 103±2°C for 8–10 h [20]. The average initial moisture content of the samples was found to be 91± 1% wet basis.
Experimental equipment and procedure
Ohmic heating experiments were conducted in laboratory scale ohmic heating system consisting of a power supply, an isolating variable transformer, power analyzer (Lutron DW-6090) and a microprocessor board (Figure 1). The heating cell has a PTF cylinder with an inner diameter of 2.5 cm, outer diameter of 5 cm, and length of 15 cm and two removable stainless steel electrodes with thickness of 0.2 cm. The distance between two electrodes was 5 cm and the area of the electrode surface was 1.96× 10⁻³m2.

Figure 1: Schematic diagram of the experimental ohmic heating system.
Temperature uniformity was checked during previous heating experiments by measuring the temperatures at different locations in the test cell. Since the temperature variation at different points inside the test cell was ±1.5°C during heating, the ohmic heating process was assumed as uniform. Therefore, only the temperature in the center of the test cell was continuously measured with a K-type thermocouple (connect to PT100 sensor for recorded of data), Teflon coated thermocouple to prevent interference from the electrical field.
The samples were placed in the test cell; the thermocouples were inserted and fitted into geometric center of the sample. The ohmic heater was operated at five voltage inputs: 30, 40, 50, 60, and 70V at 50Hz frequency or voltage gradients: 6, 8, 10, 12, and 14V/cm. A digital balance (A&D GF600, Japan) with accuracy of ± 0.01 g was positioned on the down of the cell for moisture loss determination. All experiments were performed in triplicates.
Electrical conductivity
Electrical conductivity (σ) was determined from the resistance of the sample and the geometry of the cell using the following equation:
 (1)
(1)
where σ is the electrical conductivity (S/m) L is the gap between two electrodes (m); A is the cross-section area of the sample in the heating g cell (m2); I is the current (A); and V is the voltage (V). The ratio of L/A is known as the cell constant (k) of the ohmic heating unit. The cell constant of the ohmic heater was 0.26 cm.
System performance
The Ohmic heating system performance coefficient (SPCs) was defined as:

 (2)
(2)
where Egive is the energy given to the system (J), Etaken is The heat required to heat the sample (J), m is the mass of sample (kg), Cp is the specific heat capacity (3980 J/kg K) [21], and t is the heating time (s).
The energy given to the system will be equal to the energy required to heat the sample plus the energy loss. The energy loss represents the heat required to heat the test cell, the electrodes etc., and the heat loss to the surroundings by natural convection and the portion of the generated heat used for purposes other than heating the liquid, i.e. chemical reaction. The energy loss calculations for the experimental data were performed by using the method in Icier and Ilicali [10].
The heat loss to the surroundings by natural convection was calculated from the following equation:
 (3)
(3)
The average heat transfer coefficient was obtained as follows:
 (4)
(4)
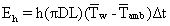
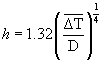
Where h is the heat transfer coefficient (W/m2.K), D is the outer diameter of the cell (m), Tw is the outer wall temperature (°C), Tamb is the ambient temperature (°C), Eh is the heat loss by natural convection (J), and ΔT was the average temperature driving force calculated from the initial and final outer wall temperatures and the ambient temperature. The calculated natural convection heat transfer coefficients were small, roughly 3.6–8.7 W/m2K. The increase in the surface temperature of the test cell at the end of the ohmic heating experiments was between 10°C and 15°C. The heat transfer area was also small. Due to these reasons, the heat loss to the surroundings was very small and could be neglected without any loss in accuracy.
pH measurement
pH was determined using a membrane pH meter (HI 8314, Hanna Instrument, USA).
Electrical conductivity
The changes in electrical conductivity of tomato samples with temperature during ohmic heating at different voltage gradients are given in Figure 2. The effect of voltage gradient on the ohmic heating times was found to be not statistically significant (P > 0.05). For all samples, electrical conductivity increased almost linearly with temperature, as is expected and consistent with literature data [6,8,22-25]. When biological tissue is heated, it’s electrical conductivity increases due to increase in the ionic mobility. This phenomenon occurs because of structural changes in the tissue like cell wall protopectin breakdown, expulsion of non conductive gas bubbles, softening, and lowering in aqueous phase viscosity. Bubbling was observed above 80 °C at especially high voltage gradients. It was observed that electrical conductivities decreased with temperature rise after bubbling started and the heating was stopped when bubbling started. It has been discussed that due to formation of electrolytic hydrogen bubble, fruit juices are acidic [26].In an un-pressurized heater, after occluding of air inside the sample and at constant pressure conditions, the air bubbles will expand when temperature increases [25]. This would mean that bubble volume would increase with temperature. Thus air, which can be roughly considered to be of zero electrical conductivity, will increase in area, tending to reduce the electrical conductivity of the mixture. Icier and Ilicali [6] reported that the increase in the electrical conductivity values with temperature has been explained by reduced drag for the movement of ions. It has been reported that when water is boiling, gas bubbles are formed. This phenomenon appears due to localized high current densities of various oxidation/reduction reactions (e.g. H2 or O2 gas) [27].

Figure 2: The changes in electrical conductivity of tomato with temperature during ohmic heating.
The linear model (Eqnuation 5) by Icier and Ilicali [6,28] was used to fit the electrical conductivity data of tomato samples.
 (5)
(5)
Listed in Table 1, are the m, σ0 and R2 values. High coefficients of determination (R2 > 0.977) indicate the suitability of the linear model for conductivity variation with temperature for all the samples tested. Zell et al. [29] postulated that ohmic heating is most satisfactory for products having values in a range of 0.01–10 S/m, with optimum efficacy in the range 0.1–5 S/m. The values of electrical conductivity are comparable with the reported values of 0.1-1.6 S/m mentioned for apple and sour cherry juices at 20-60 V/cm and 30-75°C [23], 0.4-1.0 S/m for lemon juice at 30-55 V/cm and 20-74°C [8], 0.38-0.78 S m-1 for grape juice at 20-40 V/cm and 20–80°C [22], 0.15-1.15 S/m for orange juice at 20-60 V/cm and 30–60°C [6], 0.51-0.91 S/m for peach puree and 0.61-1.2 S/m for apricot puree at 20-70 V/cm and 20–60°C [28].
| ∇V(V/cm) | m | σ0 | R2 |
|---|---|---|---|
| 6 | 0.0076 | 0.147 | 0.9992 |
| 8 | 0.0075 | 0.179 | 0.9972 |
| 10 | 0.0076 | 0.178 | 0.9771 |
| 12 | 0.0077 | 0.162 | 0.9916 |
| 14 | 0.0081 | 0.159 | 0.9868 |
| General | 0.0077 | 0.165 | 0.9917 |
Table 1: The constants and coefficients of electrical conductivity–temperature relationships of tomato heated ohmically at different voltage gradients.
Heating rate
The effect of voltage gradient on the ohmic heating times was found to be statistically significant. As the voltage gradient increased the heating times to reach the prescribed temperature decreased, as shown in Figure 3. The ohmic heating rates were 0.325, 0.647, 1.495 and 2.031°C/s at voltage gradients 6, 8, 10, 12 and 14 V/cm, respectively. As the temperature increased the current passing through the sample increased. Since the electrical conductivity of the tomato samples increased during ohmic heating, the current also increased at the constant voltage gradient applied. Since the electrical energy per treatment time converting to the heat energy was dependent both on the voltage gradient and the current passing through the sample, the temperature rise at the instant time was higher at higher voltage gradients. However the treatment time decreased due to higher energy generation rate at high voltage gradients, the total energy consumption was comparable for all voltage gradients. When higher voltage gradients were applied, samples showed an ideal range where there was an exponential or linear trend of temperature rise from 26 to 96°C. The time required to heat the tomato samples from 26 to 96°C were 235, 125, 77, 52 and 38 s at 6, 8, 10, 12 and 14 V/cm, respectively. The heating time decreased greatly (approximately 78%) when the voltage gradient increased.

Figure 3: Ohmic heating curves of tomato samples at different voltage gradients.
System performance coefficient (SPC)
The electrical energies given to the system, heat taken by the tomato samples and the system performance coefficients for each voltage gradient are shown in Table 2. The results indicated that the Et and Eg depended strongly on the voltage gradient applied. The electrical energy is decreasing with increasing voltage gradient. One reason might be that the heating time is longer under lower voltage gradient and result in the increase of electrical energy. For the tomato samples the SPCs increased from 0.716 to 0.905 as the voltage gradient decreased, which indicated that 9.5-28.4% of the electrical energy given to the system was not used in heating up the test sample. The obtained values of SPCs from this study lie within in general range 0.47–1 for the liquid samples during ohmic heating [10]. For low voltage gradients, the conversion of electrical energy into heat was larger. Therefore, the system was performing better. The values of SPCs are comparable with the reported values of 0.49 to 1 mentioned for apricot puree at 29.3-60°C and 20-70 V/cm, 0.62 to 1 for peach purees at 8-60°C and 20-70 V/cm [28], 0.54-0.92 for lemon juice at 20-74°C and 30-55 V/cm [8], 0.52- 0.92 for orange juice at 32-60°C and 20-60 V/cm [6]. The relationship between SPCs and voltage gradient can be represented as:
| ∇V(V/cm) | Et (J) | Eg (J) | SPC | t (s) |
|---|---|---|---|---|
| 6 | 10166 | 11231 | 0.905 | 235 |
| 8 | 8330 | 9855 | 0.845 | 125 |
| 10 | 7748 | 9526 | 0.813 | 77 |
| 12 | 7244 | 9738 | 0.744 | 52 |
| 14 | 6750 | 9426 | 0.716 | 38 |
Table 2: System performance coefficients for different voltage gradients applied during ohmic heating.
 (6)
(6)
The difference between the energies given and taken was called energy loss in this study. As the voltage gradient increased, energy losses increased. Similar trends were also observed by Icier and Ilicali [6,28] and Darvishi et al. [8]. Heat transfer area of ohmic cell was small. For this reason, the energy losses to the surrounding by natural convection during ohmic heating were just 0.5–1% of the energies given to the system, and they could be neglected without any loss in accuracy. The energy loss to heat up the test cell was approximately 8.9- 10.3% of the energy given to the system. At low voltage gradients, the difference between the energy given to the system and the energy taken by the tomato samples can be explained partly by these losses. However,at higher voltage gradients the energy losses mentioned above is only a small portion of the total energy losses. The energy losses can be mostly explained by the energies used for the purposes of physical, chemical and electrochemical changes during heating [10,27]. It is rather difficult to comment on the exact nature of this loss. These reactions are not beneficial and further study must be conducted on the effects of them on food. In conclusion, SPCs can be used to determine the system performance of ohmic heaters.
pH
In the light of experimental results shown in Figure 4, there was a slight change in the pH of the tomato samples based on the applied voltage gradient. The range of the tomato samples pH after ohmic treatments was 4.20–4.51. The maximum increase in the pH was 8.7% at 6 V/cm. The pH was decrease with increased the voltage gradient. This behavior was probably due to the residence time of different reactions such as hydrolysis of the tomato samples and corrosion of electrodes that might occur during the ohmic heating. For example, at high voltage gradient, 14 V/cm, the heating rate was high (2.031C/s), therefore the residence time for the sample to heat up from 26 to 96°C was short, thus the change of the pH was limited (1.2%) because the reaction time was short. In comparison, at low voltage gradient, 30V/ cm, the heating rate was 0.325°C/s, which means high residence time at which the change in the pH was maximum (8.7%) because of the longer reaction time. It has been reported that during ohmic heating, hydrolysis and corrosion reactions between the electrodes and the electrolyte solution may occur, where at high electrical power and salt content, a significant loss of buffering capacity was noted [5].

Figure 4: pH changes of tomato samples at different voltage gradients.
1. The electrical conductivity values were in the range of 0.35–0.82 S/m having an increasing trend with increasing temperature.
2. Ohmic heating times are dependent on the voltage gradient used. As the voltage gradient increased form 6 to 14 V/cm, time decreased from 235 to 38 s.
3. The voltage gradient was statistically significant on the ohmic heating rates for both purees (P < 0.05).
4. The system performance coefficients for tomato samples were in the range of 0.716 - 0.905.
5. Bubbling occurred above 80°C especially at higher voltage gradients
6. Results showed that the values of the pH decreased (from 4.51 to 4.20) with increasced voltage gradient.