Journal of Nutrition & Food Sciences
Open Access
ISSN: 2155-9600
ISSN: 2155-9600
Research Article - (2023)Volume 13, Issue 3
Poor nutrition and physical inactivity among students in schools affect students’ life-quality and affect productivity nationally. The purpose of this study is to assess the nutritional knowledge, diet diversity and physical activity of selected secondary school students in Sagamu local government area of Ogun state. A multistage stratified random sampling technique was used to select 401 respondents. Nutritional knowledge, diet diversity and physical activity was assessed using a nutritional knowledge questionnaire, diet diversity questionnaire and physical activity questionnaire for children and adolescents (PAQ-C and PAQ-A) respectively. The data analysis was done using statistical package for social science SPSS, version 23. The statistical analysis involved a descriptive analysis of frequencies, percentages and association between variables. The result showed most of the participants was majorly (99%) adolescents, in which 67.8% were females. Most (75%) of respondent’s mothers are traders, while 57.6% fathers are businessmen. Very few (1%) of the students had poor diet diversity score. The food group mostly eaten by the students was cereal group followed by root and tubers. The least eaten was the meat food group. 55.4% of the respondents had good nutrition knowledge score. Only few (8%) of the respondents had low physical activity score. The students had good nutritional knowledge, good diet diversity and moderate physical activity. Therefore, nutrition education and outdoor physical education should be added to the students curriculum. Parents and students should get involve in home gardening and livestock rearing to improve diet diversity and food security and to encourage parents to give their children more proteinous meal, for children growth and development both intellectually and physically.
Nutritional knowledge; Diet diversity; Physical activity; Secondary school students
Presently, poor nutrition and physical inactivity among students in schools affect students’ life-quality and affect productivity nationally. Poor nutrition can result from failure to eat enough or failure to choose the right kinds of foods, which lead to increased infection. Deficiencies in diet quality have greatest impact on women of reproductive age and vulnerable groups. Also, families with fewer resources will use less money for education, housing and medical care [1]. If poor nutritional status is not well monitored can lead to poor school performance, decrease in intelligence quotient, IQ score, memory lost, learning disabilities, reduced social skills and reduced problem-solving abilities. Assessing the diet diversity level of an individual helps to predict the individual nutritional status. It is needed to assess the rate of proneness of adolescents to hidden hunger or/and under nutrition [2].
It is said that an individual with good physical activity level is having a reduced risk to cardiovascular diseases and obesity but, some children today are obese and having adult diseases, especially in developed countries. The need for assessing nutritional knowledge among students is a necessity because, the need for assessing nutritional knowledge nutritional knowledge will affect one's dietary habits, food choice and health which affects their ability to learn and play normally. This research is also carried out because, it has been established that a positive nutrition knowledge influence healthy food choices; so, there is need to know the association between nutritional knowledge and diet diversity [3].
Dietary diversity is defined as a qualitative measure of food consumption that reflects household access to a variety of foods and is also a proxy for nutrient adequacy of the diet of individuals. It can also be used to know food groups that are of people’s interest. To reflect a quality diet, the number of different food groups consumed is calculated, rather than the number of different food consumed. The indicator can be modified and used as an Individual Dietary Diversity Score (IDDS), which is used as a proxy measure of the nutritional quality of an individual’s diet. This helps measure the impact of a project on household food access. It also serves as an indicator with an early warning system [4].
Physical activity is defined as the movement of the body so as to use energy. It involves walking, climbing stairs, playing football, dancing. For good health, the physical activity should either be moderate or of vigorous intensity. Physical activities that help build muscular strength, endurance and flexibility help to improve ability to perform tasks of daily living. It helps improve bone health, decreases risk of osteoporotic fracture.
Study area
Sagamu is the part of the Yoruba cultural region of Southwestern Nigeria. Sagamu is also Ishagamu or Shagamu is a city located in Ogun state, it is close to Ibu river in Southwestern Nigeria. It is one of the fifty-seven local governments in Ogun state [5].
Study design
The study was a cross sectional survey.
Sample selection
A list of the public secondary schools in Sagamu local government area was obtained from the Teaching Service Commission (TESCOM), Ogun state. Four schools were randomly selected Sagamu high school, Batoro community high school, Soyindo community high school and Remo divisional high school.
Inclusion: Only students in secondary schools were involved, they are either from the junior or senior class.
Exclusion: Everyone who is not a government secondary school student, or is a teacher and not schooling in Sagamu local government area, were excluded.
The subjects (n=401) in this study consist of secondary school students of both senior and junior classes (JSS1, JSS2, JSS3, SS1, SS2, SS3) both male and female. Questionnaires were administered to 4 secondary schools.
Data collection
Questionnaires were used to collect data to determine the sociodemographic factors, nutritional knowledge, diet diversity and physical activity. The total number of students in the 4 schools from junior and senior secondary school is 4700 students (N), which was gotten during the preliminary visit.
Nutritional knowledge
For the purpose of this study, nutritional knowledge refers to having basic knowledge of nutrition about the food we eat, the content and its effects on the body. On a scale of 0 to 10, respondent’s total score less than or equal to 3 is classified as poor; total score of 4 to 6 is good; total score of 7 to 8 is very good; and 9 to 10 is excellent. Therefore, respondents of excellent and very good score are having good nutritional knowledge; respondents of good scores are having average nutritional knowledge; and respondents with poor scores are having poor nutritional knowledge [6].
Diet diversity
Diet diversity questionnaire was based on different food groups taken in a week. The food groups according to FAO 2007 are cereals, legumes, roots and tubers, vegetables, fruits, meat, egg, fish, fats and oil, milk and milk products. On a scale of 0 to 10, the respondents’ total score of 1 to 3 is low; 4 to 5 is moderate and 6 to 10 is high diet diversity score [7].
Physical activity
This is to know the level of activity of the students, using their daily activities in school and at home, knowing what type of exercises they get involve in, the number of times they do exercise in a week and what they do with their leisure period. The physical activity questionnaire was modified from the Physical Activity Questionnaire for older Children (PAQ-C) and Adolescents (PAQ-A) manual. On scale of 1 to 5, respondents with total score of 1 to 1.79 are low; 1.80 to 3.49 is medium; 3.50 to 5.00 is high physical activity. The total score was calculated using the calculations given in the manual [8]. The average score was calculated for the activities for the week, assigning 1 mark for least activity and 5 marks was the highest. Each questions was based on the activities done in the previous week has its own mark assigned to it, except question 9, it is based on anything that prevented the students from doing their normal physical activity or cause reduction in physical activity the previous week so not part of the scoring [9,10].
Data analysis
The data analysis was done using statistical software package for social sciences, SPSS version 23. Statistical analysis involved a descriptive analysis of frequencies and percentages for the variables. The association between some socio-demographic and socio-economic characteristics of the respondents and the variables were also tested.
Socio-demographic and socio-economic characteristics
Table 1 shows that students of age 9 to 11 years who participated were few (8.7%). Students of 12-14 years were 51.9%, 15-17 years were 34.2%, 18-20 years were 4.2% and 21-23 years was 1%. Of the 401 students, 32.1% were males and 67.8% were females. 19% of them were in Jss1, 17.5% in Jss2, 18% in Jss3, 15.7% in SS1, 16% in SS2, 14% in SS3.
| Variables | Frequency | Percent |
|---|---|---|
| Age | ||
| 9-11 | 35 | 8.7 |
| 12-14 | 208 | 51.9 |
| 15-17 | 137 | 34.2 |
| 18-20 | 17 | 4.2 |
| 21-23 | 4 | 1 |
| Total | 401 | 100 |
| Gender | ||
| Male | 129 | 32.1 |
| Female | 272 | 67.8 |
| Total | 401 | 100 |
| Class | ||
| JSS1 | 76 | 19 |
| JSS2 | 70 | 17.5 |
| JSS3 | 72 | 18 |
| SS1 | 63 | 15.7 |
| SS2 | 64 | 16 |
| SS3 | 56 | 14 |
| Total | 401 | 100 |
| Family type | ||
| Nuclear family | 286 | 71.3 |
| Extended family | 110 | 27.4 |
| Single parenting | 5 | 1.2 |
| Total | 401 | 100 |
| Position in family | ||
| First or second child | 223 | 55.6 |
| Third or fourth child | 142 | 35.4 |
| Fifth or sixth child | 30 | 7.5 |
| Others (seventh, ninth) | 6 | 1.5 |
| Total | 401 | 100 |
Table 1: Result of socio-demographic characteristics of the respondents (N=401).
Table 2 shows that 9% of the student's mothers were civil servants, 75.1% were traders, 3.5% were housewives and 11% were artisans and 15% of the student's mothers were secretary in a school, nurse, teacher or deceased.
| Variables | Frequency | Percent |
|---|---|---|
| Mother’s occupation | ||
| Civil servant | 36 | 9 |
| Trader | 301 | 75.1 |
| Housewife | 14 | 3.5 |
| Artisan (hairdresser, tailor, etc.) | 44 | 11 |
| Others (secretary in a school, nurse, teacher, deceased) | 6 | 1.5 |
| Total | 401 | 100 |
| Father's occupation | ||
| Civil servant | 73 | 18.2 |
| Business man | 231 | 57.6 |
| Artisan (plumber, electrician, mechanic, driver, carpenter, etc.) | 71 | 17.7 |
| Others (pastor, scrap dealer, traditional doctor, artist, telecommunication, driver, clergy, farmer, deceased) | 26 | 6.5 |
| Total | 401 | 100 |
| Cost of transport fees from the same amount given to school | ||
| Yes | 177 | 44.1 |
| No | 195 | 48.6 |
| None, no money was given to school | 29 | 7.2 |
| Total | 401 | 100 |
Table 2: Result of socio-economic characteristics of the respondents (N=401).
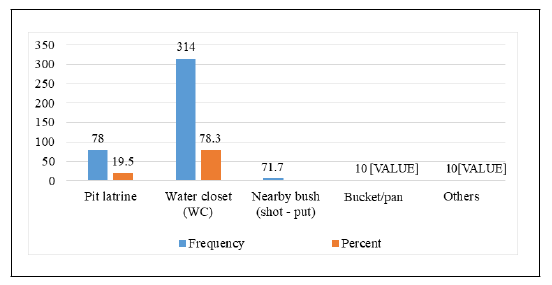
Some (18.2%) of the respondent’s fathers were civil servants, 57.6% were businessmen, 17.7% were artisan and 6.5% fathers were either pastors, scrap dealer, traditional doctor, artist, a telecommunication worker, driver, clergy, farmer or deceased. Most (71.3%) of the respondents were from nuclear family, 27.4% were from the extended family and 1.2% were from single parenting family. In addition, few (19.5%) use pit latrine in their home, 78.3% uses water closet, 1.7% had no toilet so use nearby bush for shot put, 0.2% uses bucket as their own toilet, while 0.2% did not specify (others) (Figure 1).

Figure 1: The chart showing the type of toilet used by the respondents in their homes.
Nutritional knowledge score of the respondents
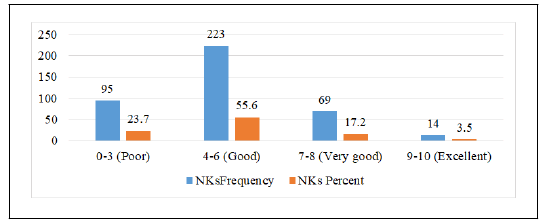
Figure 2 shows that few (23.7%) of the students had poor score of 0 to 3 score out of 10 questions; more than halve (55.4%) of the respondents had good score of 4 to 6 score of 10 score while, Few of the respondents (17.2%) had a very good score of 7 to 8 out of 10 and, very few (3.7%) of the respondents had an excellent score of 9 to 10.

Figure 2: Nutritional knowledge score of the respondents.
Diet diversity score of the respondents
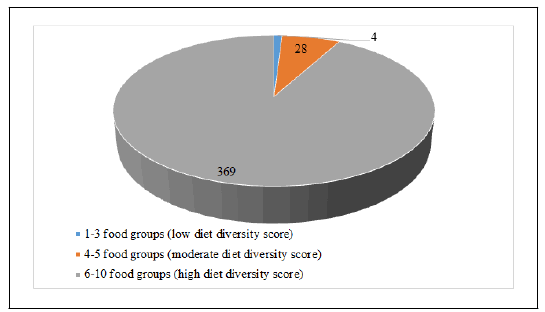
The mean score was 2.91 (6 to 10, high diet diversity score). Figure 3 shows that, of the 401 students very few (1%) of the students had poor diet diversity score of 1 to 3 food groups eaten the previous week. 7% (28 students) had moderate diet diversity score of 4 to 5 food groups. While majority (92%) of the respondents had high diet diversity score of 6 to 10 food groups, the previous week.

Figure 3: Diet diversity score of the respondents.
Physical activity score of the respondents
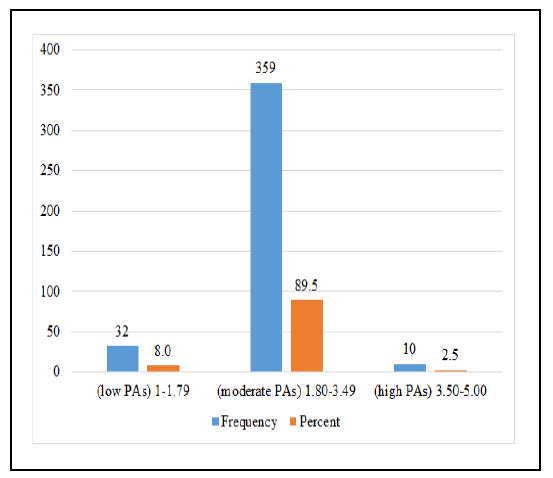
Figure 4 shows that, after the calculation of the physical activity score, majority (89.5%) of the respondents had moderate physical activity for the previous week. Few (8%) had low physical activity, while very few (2.5%) of the respondents had high physical activity score.

Figure 4: Physical activity score chart of the respondents.
Association between the variables and the sociodemographic and socio-economic characteristics
Table 3 shows that there is no significant association between nutritional knowledge score and diet diversity score. There is no association between nutritional knowledge score and physical activity score. Also there is no association between diet diversity score and physical activity score, but there is association between age and nutritional knowledge score; amount given to school from home and physical activity score; and amount given to school from home and nutritional knowledge score. The pearson chi-square correlations between the variable were assessed at P-value ≤ 0.05, N=401.
| S.No. | Compared variables | P-values |
|---|---|---|
| 1 | Nutritional knowledge score and diet diversity score | 0.975 |
| 2 | Nutritional knowledge score and physical activity score | 0.589 |
| 3 | Diet diversity score and physical activity score | 0.83 |
| 4 | Age and diet diversity score | 0.972 |
| 5 | Age and physical activity score | 0.804 |
| 6 | Age and nutritional knowledge score | 0 |
| 7 | Gender and diet diversity score | 0.687 |
| 8 | Gender and physical activity score | 0.538 |
| 9 | Gender and nutritional knowledge score | 0.633 |
| 10 | Amount given to school from home and diet diversity score | 0.802 |
| 11 | Amount given to school from home and physical activity score | 0.003 |
| 12 | Amount given to school from home and nutritional knowledge score | 0.001 |
Table 3: Association between the variables and the socio-demographic and socio-economic characteristics.
The diet diversity of the students for the previous week shows that most the students ate more stable food mostly the cereals. And cereal is the food group with the highest percentage, followed by root and tubers. The least consumed was the meat group. It has been stated that diet diversity is a form of dietary assessment that helps determine the risk of deficiency due to low or excess intakes of essential nutrients for good health [11]. Research has also shown that a mild level of micronutrients malnutrition in children may lead to damage in cognitive development and lower disease resistance. According to FAO 2008, the average diet diversity score is 5 out of 10. The distribution of diet diversity score is 1 to 3 food groups as low, 4 to 5 food groups as moderate and above 6 as high; FAO 1997. It is said that a diet diversity of 3 is poor and when gains or tuber based stable foods dominate and diet lake vegetables, fruits and animal sources of food, he risk for a range of micronutrient deficiencies is high and women of reproductive ages constitute one of the vulnerable groups [12].
Home gardening can be practiced, in which vegetables and pepper, they can have poultry and other livestock for family consumption, this helps improve diet diversity. Also, there is statistically significant association between diet diversity and type of toilet used in the respondent’s home. The type of toilet used in the respondent’s home is a factor of the respondent’s economic status. Zoellner and some other researchers stated that limited literacy is probably a serious limitation for acquiring nutritional knowledge, selecting and implementing a healthy diet, and making other positive choices in relation to health [13,14].
Elmadfa and Meyer revealed that diet diversity helps measure nutrient quality of an individual’s diet. These helps to know if the students have the essential elements needed for growth, development and to be able to cope with their studies. A finding has also revealed the strong relationship between diet diversity and child growth indicators base on the study conducted on South African children. Cereals have shown to be the major food group consumed by the students in Sagamu local government area [15].
From the result, there is significant association between nutritional knowledge score and age. Some findings have also reported that there is a direct correlation between nutrition knowledge and age. Since the government school students are considered to have less assess to nutrition information more efforts should be concentrated on educational programs for secondary school students. In addition, the correlation revealed that nutritional knowledge and class, are not statistically significant associated. Students understand the key concepts behind the food they eat with proper education and good decisions when it comes to their food choices [16].
Girois and some other researchers also stated that though higher nutritional awareness does not necessarily result in practice and behavior. This means that someone may have good nutritional knowledge but does not practice it, which can lead the person to poor nutritional status. Furthermore, from the result the physical activity done mostly by the students is walking, followed by dancing. The least physical activity done was playing basketball and volleyball. One can get active in lots of ways, but walking is one of the easiest way to get involve in physical activity and it is does not involve any expense. It does not need any special skill or equipment. From healthy for good home, it was stated that for every hour of brisk walking, life expectancy for some people may increase by two hours [17].
Some of the students said most of time they do the physical education is done in class and only few times they are allowed to do outside activity like running, jumping and shot put only during their inter-house sport which only takes ones in a session or 2 sessions. From Ojo Adebayo study, it was revealed that the available facilities, equipment at schools were not used by teachers in teaching physical education; which was supported by findings from Awosika, that it might be impossible to get satisfactory results from athletes whose training facilities and equipment are inadequate or substandard.
School is identified as a centre element that helps to ensure that students participate in physical activities well enough and develop healthy lifestyles. Even with this, many school based physical activity opportunities are being eliminated or minimized; that is Physical Education (PE) recess. Low level of physical activity in childhood has shown to contribute to overweight and obesity among adults. Physical activity can help improve physical fitness and reduce the risk of cardiovascular disease in overweight and obese adolescents. Generally, the physical activity of the students during the working days is low but improved on Friday; this may be due to the different school activities. Students have more leisure time to themselves on weekends. This shows the trend in increment in physical activities from Monday to Sunday.
When this survey was conducted the students were having examination. This might have affected their physical activity level the previous week, due to preparation for the examination. In recent years, an extremely high prevalence of being at risk of overweight or obese among adolescents has been reported in the United States and other nations. Another research work has also shown that the prevalence of childhood overweight and obesity are very high and high proportion of children show signs of obesity-associated metabolic complications like the metabolic syndrome, hypertension and has been related to be due to low physical activity.
The correlation between physical activity score and gender is statistically significant associated. A study has also shown that the number of days children engaged in physical activity was higher for boys than girls. In addition to that, another research has also proven that participation in organized sport was also higher for boys of age between 12 and 14 years than girls. If an individual is not well fed nutritionally, the person may not have strength to get involve in physical activities and such individual may be predisposed to hidden hunger which may also lead to poor physical activity and if try to force it might lead to fracture or body pains. Also, another study has also observed positive correlation between nutritional knowledge and diet diversity score, though this study was on cancer patients. Lastly, there is no association between diet diversity score and physical activity score but it has been discovered from some findings that decreased physical activity is associated with increased risk for weight gain even when there is decrease in energy consumption (food).
From the study, it can be concluded that, the students had good diet diversity score, in which majority of them had high diversity score. They had moderate physical activity due to preparation for their examination, though there are other factors that affected the students like sickness, but preparation for their examination was the major constrain they had. Also, boys have participated in physical activity than girls. They had good knowledge about nutrition but some of them had poor nutritional knowledge. Nutrition education should be part of home economics or health education for junior classes and home management for senior classes. Nutrition education can help boost physical activity and diet diversity through provision of the knowledge, improvement of skill and technology.
I express my gratitude to all the respondents, principals and teachers, who made this study successful and my supervisor for her support and guardians.
[Crossref] [Google Scholar] [PubMed]
[Crossref] [Google Scholar] [PubMed]
[Crossref] [Google Scholar] [PubMed]
[Crossref] [Google Scholar] [PubMed]
[Crossref] [Google Scholar] [PubMed]
[Crossref] [Google Scholar] [PubMed]
[Crossref] [Google Scholar] [PubMed]
[Crossref] [Google Scholar] [PubMed]
[Crossref] [Google Scholar] [PubMed]
[Crossref] [Google Scholar] [PubMed]
[Crossref] [Google Scholar] [PubMed]
[Google Scholar] [PubMed]
Citation: Latifat YO, Sanni SA (2023) Nutritional Knowledge, Diet Diversity and Physical Activity of Selected Secondary School Students in Sagamu Local Government Area of Ogun State. J Nutr Food Sci. 13: 894.
Received: 21-Aug-2020, Manuscript No. JNFS-23-22338; Editor assigned: 26-Aug-2020, Pre QC No. JNFS-23-22338 (PQ); Reviewed: 09-Sep-2020, QC No. JNFS-23-22338; Revised: 02-Mar-2023, Manuscript No. JNFS-23-22338 (R); Published: 30-Mar-2023 , DOI: 10.35248/2155-9600.23.13.894
Copyright: © 2023 Latifat YO, et al. This is an open-access article distributed under the terms of the Creative Commons Attribution License, which permits unrestricted use, distribution, and reproduction in any medium, provided the original author and source are credited.