Journal of Nutrition & Food Sciences
Open Access
ISSN: 2155-9600
ISSN: 2155-9600
Research Article - (2012) Volume 0, Issue 0
The study was conducted to improve cocoyam-based recipes ebiripo, ikokore, and ojojo using different blends of cocoyam Colocasia esculenta and cowpea Vigna unguiculata flour in the ratio of 100:0, 80:20, 70:30, 60:40, and 50:50. The proximate mineral composition and sensory qualities of the products were determined using standard analytical procedures. The data obtained were subjected to analysis of variance, and means were separated using Duncan’s multiple range test. The results showed that the developed recipes had significantly p<0.05 higher contents of protein, fat, crude fibre, iron, zinc, sodium, and phosphorus compared with the control recipes 100% cocoyam flour. The protein content was highest in all recipes containing 50:50 cocoyams: cowpea flour ojojo 10.79%, ikokore 10.56%, and ebiripo 10.36%. However, 100 g ikokore had higher iron 2.5 mg, phosphorus 92.5 mg, and zinc 1.92 mg contents than ebiripo and ojojo at 50:50 cocoyam:cowpea flour ratios. The sensory evaluation showed that the 80:20 recipe for ebiripo had significantly p<0.05 higher flavour and overall acceptability scores compared with other
recipes. Ikokore substituted with cowpea flour at 20–40% levels was scored higher for colour, flavour, consistency, taste, and overall acceptability among the blends. The samples of ojojo were not significantly different p>0.05 in sensory qualities. It is concluded that the enrichment of cocoyam-based recipes ojojo, ikokore, and ebiripo with cowpea flour improved the protein, crude fibre, mineral composition, and the acceptability of the foods.
Keywords: Cocoyam-based recipes; Cowpea flour; Development; Nutrition; Protein quality; Sensory evaluation
The cocoyam taro Colocasia esculenta is a well-known food plant that has a long history of cultivation. Its corms are an important source of starch. Cultivars of two species Colocasia esculenta taro and Xanthosoma sagittifolum tannia are generally grown for food. It is consumed in homes, especially during periods preceding the yam harvest, which underscores its importance as a possible substitute for the crop [1,2]. It is used in essentially the same way as yam, although it is not as highly valued.
Taro is a perfect complementary element for all sorts of meals, as it offers vitamins and soluble fibres [3,4].
Cocoyam ranks third in importance after cassava and yam among the root and tuber crops that are cultivated and consumed in rural areas by the elderly in Nigeria. The crop is no longer favoured in urban homes due to poor information about its nutritive values. This widespread ignorance of the nutritive value and diversities of food forms of cocoyam is a major problem for the general acceptability and extensive production of the crop [5].There is a need to improve cocoyam use among consumers.
The main nutrient supplied by cocoyam, as with other roots and tubers, is dietary energy provided by its carbohydrate content. Its protein content is low 1-2%, and as in almost all root crop proteins, sulfur-containing amino acids are limiting. By contrast, cowpea protein is of higher value and can complement the deficiencies of cocoyam. Cowpea is popularly referred to as ‘beans’ in Nigeria and it belongs to the group known as legumes. It is nutritious and provides protein, vitamins, and minerals. Cowpea grain contains about 25% protein, making it extremely valuable for people who cannot afford animal protein foods such as meat and fish [6,7].
The use of cowpea seed as a vegetable provides an inexpensive source of protein in the diet. The plant can be used at all stages of growth as a vegetable crop. The tender green leaves are an important food source in Africa and are prepared as a pot herb, like spinach. The combination of cocoyam-cowpea flour could be used in the industrial production of baked foods, noodles, and weaning foods.
It is well documented in the literature that blends of cocoyam and cowpea flour will improve the nutritive quality of the protein [7,8]. The dietetic value of cocoyam-cowpea blends is enormous in many hospitals, especially in Nigeria.
Dieticians in Africa will find the combination of cocoyam and cowpea highly valuable in the treatment of malnutrition and other chronic diseases that depend on vegetable proteins. The production of this type of blend will increase the consumption of cocoyam and cowpea for better nutritional status of all age groups. Therefore, the objective of this study is to evaluate the nutrients and chemical composition along with sensory qualities of cocoyam-based cowpea flour recipes.
Materials
The cocoyam cormels and cowpea seeds used in this study were purchased from Osiele and Kuto markets, Abeokuta, Ogun State, Nigeria. The food items ikokore, ojojo, and ebiripo were prepared at Food Preparation Laboratory of Nutrition and Dietetics Department, University of Agriculture, Abeokuta.
Preparation of cocoyam flour
The cocoyam cormels were thoroughly washed with water, peeled, and grated into tiny pieces using a manual kitchen grater. They were oven air dried at a temperature of 65°C for 48 hours. After drying, they were milled finely and stored in air-tight polyethylene bags.
Preparation of cowpea flour
Cowpea seeds were cleaned, soaked, and then dehulled. The detached hulls were decanted from the beans. The dehulled beans were then dried at a temperature of 65°C in a hot air oven, milled into flour, packed in an air-tight container, and stored. The cowpea was processed according to the method of Nnanna and Phillips [9].
Preparation of ojojo
Cocoyam flour was used to prepare the control ojojo. Varying composites of the developed flour were used to prepare ojojo with ratios of cocoyam and cowpea flour of 50:50, 60:40, 70:30, and 80:20. Water was added to form a paste of soft consistency. These pastes were mixed with the appropriate ingredients for frying ojojo. A deep spoon was used to drop the mixture into the hot oil, thereby forming ball shapes. The mixture was then deep fried in hot oil until light brown.
Preparatory method for ikokore
The composite flour cocoyam and cowpea was weighed into a bowl and mixed with a small quantity of warm water to obtain a soft and smooth consistency. Salt, ground pepper, and onion were added to taste before thoroughly mixing. A small quantity of palm oil was poured into the pot to prevent it from burning, cent leaves were washed and used as base, and then smoked fish was put on top of the base. The cocoyam mixture was added in small even sizes and put on the smoked fish, warm water was added and allowed to boil for 10 minutes. The dried fish and remaining oil was added and allowed to cook for 20 minutes, and then it was stirred and served.
Preparatory method for ebiripo
The ground ingredients were added to the composite flour. Palm oil with warm water was added to make a mixture of soft and smooth consistency. Salt was added to taste. The mixture was wrapped in local leaves and then steamed for about 30 minutes.
Proximate analysis
Chemical compostion: Moisture Content: Moisture content was determined using Association of Official Analytical Chemist [10]. About 5 g of each sample was weighed into petri dishes of a known weight. It was then dried in the oven at 105 ± 1°C for 4 hours. The samples were cooled in a desiccator and weighed. The moisture content was calculated as follows:
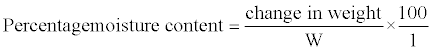
W=Initial weight of food before drying.
Ash Content: Ash content was determined using the AOAC method [10]. About 5 g of each sample was weighed into crucibles in duplicate, and then the sample was ashed in a muffle furnace at 550°C until a light grey ash was observed and a constant weight obtained. The sample was cooled in the desiccator to avoid absorption of moisture and weighed to obtain ash content.
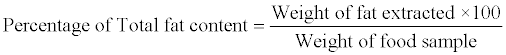
Fat Content: Fat content was determined using the AOAC method [10]. About 10 g of each sample was weighed on a chemical balance and wrapped in a filter paper. It was then placed in an extraction thimble. Extractor was cleaned, dried in an oven, and cooled in the desiccator before weighing. Then, 25 ml of petroleum was measured into the flask and the fat content was extracted with this solvent. After extraction, the solvent was evaporated by drying in the oven. The flask and its contents were then cooled in a desiccator and weighed fat content. The percntage fat content was calculated as follows:
Crude Fibre: Crude fibre was determined using the AOAC method [10]. About 5 g of each sample was weighed into a 500 ml Erlenmeyer flask and 100 ml of TCA digestion reagent was added. It was then brought to boiling and refluxed for exactly 40 minutes counting from the start of boiling. The flask was removed from the heater, cooled a little, and filtered through a 15.0 cm no. 4 Whatman paper. The residue was washed with hot water stirred once with a spatula and transferred to a porcelain dish. The sample was dried overnight at 105°C. After drying, it was transferred to a desiccator and weighed W1 when cool. It was ashed in a muffle furnace at 500°C for 6 hours, allowed to cool, and reweighed W2.
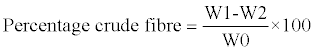
W1=weight of crucible+fiber+ash
W2=weight of crucible+ash
W0=Dry weight of food sample
Protein Content: The protein content determination was carried out using a micro-Kjedhal method [10], which consists of wet digestion, distillation, and titration. The protein content was determined by weighing 3 g of sample into a boiling tube that contained 25 ml concentrated sulfuric acid and one catalyst tablet containing 5 g K2SO4, 0.15 g CuSO4 and 0.15 g TiO2. Tubes were heated at low temperature for digestion to take place. The digest was diluted with 100 ml distilled water, 10 ml of 40% NaOH, and 5 ml Na2S2O3, anti-bumping agent was added, and then the sample was diluted off into 10 ml of boric acid.
The NH4 content in the distillate was determined by titrating with 0.1 N standard HCl using a 25 ml burette. A blank was prepared by omitting the sample. The protein value obtained was multiplied by a conversion factor, and the result was expressed as the amount of crude protein.
% crude protein=Actual titre value–Titre of blank×0.1 N HCl×0.014×Conversion factor×100/Weight of sample.
Total Carbohydrate Content: Using the method of Egounlety and Awoh [11], total carbohydrate was determined by difference between 100 and the total sum of the percentage of fat, moisture, ash, crude fibre, and protein content.
Mineral analysis: The mineral content in each sample was analysed using atomic absorption spectrophotometry (AAS) fitted with a hollow cathode lamp and a fuel-rich flame air-acetylene following the AOAC [10] procedure.
Sensory evaluation: The sensory evaluation of the products was performed using a 9-point hedonic scale ranking 0-8, where 0=extremely dislike and 8=extremely like. The panellists assessed the product for flavour, fluffiness, colour, taste, and overall acceptability [12].
Statistical analysis: Data were analysed using analysis of variance ANOVA and Duncan multiple range test to test significant differences between means p<0.05. Data analysis was done using Statistical Package for Social Science SPSS version 16.0 of SPSS [13].
Proximate analysis
The results of the proximate analysis of the recipes produced from cocoyam flour and cowpea flour are presented in tables 1 to 3.
| Food sample | Moisture % | SD | Protein % | SD | Fat% | SD | Ash% | SD | Crude fibre % | SD | CHO SD |
|---|---|---|---|---|---|---|---|---|---|---|---|
| Control | 54.06b | 0.01 | 2.41e | 0.06 | 12.9d | 0.02 | 2.1d | 0.00 | 2.35d | 0.01 | 28.51a 0.06 |
| 80:20 | 53.58c | 0.24 | 5.66d | 0.04 | 12.9d | 0.08 | 2.53c | 0.07 | 2.74c | 0.03 | 25.23c 0.16 |
| 70:30 | 51.36d | 0.11 | 7.35c | 0.01 | 13.3c | 0.01 | 2.6bc | 0.01 | 2.75bc | 0.03 | 26.28b 0.14 |
| 60:40 | 56.08a | 0.01 | 9.09b | 0.12 | 13.5b | 0.06. | 2.71ab | 0.01 | 2.84ab | 0.02 | 18.54d 0.16 |
| 50:50 | 46.23e | 0.14 | 10.79a | 0.05 | 14.75a | 0.05 | 2.80a | 0.02 | 2.91a | 0.01 | 25.42c 0.14 |
Means along the same column with different superscripts are significantly different P < 0.05 from each other.
Table 1: Proximate Composition of Ojojo and Developed Recipes.
| Food Sample |
Moisture (%) | SD | Protein% | SD | Fat% | SD | Ash% | SD | Crude fiber% | SD | Carbohydrate% | SD |
|---|---|---|---|---|---|---|---|---|---|---|---|---|
| Control | 54.86d | 0.13 | 3.55e | 0.07 | 9.19 | 0.09 | 2.3c | 0.11 | 2.54e | 0.02 | 30.09a | 0.11 |
| 80:20 | 59.47c | 0.25 | 5.90d | 0.13 | 9.41c | 0.01 | 2.78b | 0.03 | 2.81d | 0.01 | 22.42b | 0.29 |
| 70:30 | 64.28a | 0.26 | 7.71c | 0.08 | 9.73b | 0.04 | 2.89b | 0.02 | 2.92c | 0.01 | 15.38c | 0.34 |
| 60:40 | 62.36b | 0.09 | 9.10b | 0.07 | 9.95a | 0.08 | 2.95ab | 0.01 | 3.01b | 0.01 | 15.63c | 0.23 |
| 50:50 | 63.39a | 0.39 | 10.56a | 0.13 | 10.06a | 0.01 | 3.20a | 0.15 | 3.08a | 0.01 | 12.77d | 0.52 |
Means along the same column with different superscripts are significantly different P < 0.05 from each other.
Table 2: Proximate Composition of Ikokore and Developed Recipes.
| Food sample | Moisture % | SD | Protein (g) | SD | Fat (g) | SD | Ash (g) | SD | Crude fibre | SD | CHO* (g) |
SD |
|---|---|---|---|---|---|---|---|---|---|---|---|---|
| Control | 58.38a | 0.07 | 2.83e | 0.03 | 11.85e | 0.06 | 2.16d | 0.06 | 2.32e | 0.00 | 24.77a | 0.11 |
| 80:20 | 55.42b | 0 .15 | 5.66d | 007 | 12.01d | 0.02 | 2.63c | 0.06 | 2.62d | 0.00 | 24.26ab | 0.13 |
| 70:30 | 53.94c | 0.29 | 7.29c | 0.01 | 12.28c | 0.00 | 2.71bc | 0.04 | 2.73c | 0.01 | 23.76b | 0.31 |
| 60:40 | 51.28d | 0.26 | 8.92b | 0.02 | 12.44b | 0.03 | 2.81ab | 0.01 | 2.77b | 0.01 | 24.52a | 0.24 |
| 50:50 | 49.51e | 0.23 | 10.36a | 0.17 | 12.71a | 0.06 | 2.88a | 0.02 | 2.88a | 0.00 | 24.51a | 0.09 |
Means along the same column with different superscripts are significantly different P < 0.05 from each other.
*CHO =Carbohydrate
Table 3: Proximate Composition of Ebiripo and Developed Recipes.
ojojo: The moisture content values for ojojo ranged from 46.23% to 56.08%. The mean protein values were 2.41 for 100% cocoyam, and these increased as the percentage of cowpea flour increased. The blended ratio 50:50 cocoyam:cowpea flour had the highest protein content. The fat content also increased with increasing cowpea flour; ojojo with a 50:50 flour blend had the highest fat content 14.75%.
The mean ash content value for ojojo was 2.1%. The crude fibre contents were 2.35% for 100% cocoyam, 2.74% for 80:20, 2.75% for 70:30, 2.84% for 60:40, and 2.91% for 50:50. The carbohydrate values of ojojo were 28.51% for 100% cocoyam, 25.23% for 80:20, 26.28% for 70:30, 18.54% for 60:40, and 25.42% for 50:50.
ikokore: The mean moisture contents of ikokore were 54.86%, 59.47%, 64.28%, 62.36%, and 63.39% for 100% cocoyam, 80:20, 70:30, 60:40, and 50:50 blends, respectively. The 50:50 cowpea flour was highest for protein 10.56%, fat 10.06%, and ash 3.20%. The carbohydrate contents were highest for 100% cocoyam flour 30.09%, and decreased with increasing percentage of cowpea flour.
ebiripo: The mean moisture content of ebiripo was highest with 100% cocoyam 58.38%. The 50:50 ratio had the highest values for protein 10.36%, fat 12.71%, ash 2.88%, and crude fibre 2.88%, whereas carbohydrate was highest in 100% cocoyam. ebiripo had the highest moisture content followed by ikokore and ojojo, respectively.
The protein content of cocoyam is 1.5%, which is low compared with the protein content of 23.0% in cowpea. The protein content of the recipes developed in this study increased as the percentage of cowpea flour increased. The control sample of ojojo had the lowest percentage of protein 2.41% when compared with the control samples of ikokore and ebiripo, which had protein contents of 3.5% and 2.83%, respectively.
Samples of the recipes developed with 50% cowpea flour substitution were significantly higher P<0.05 in protein 10.79%, 10.56%, and 10.36% for ojojo, ikokore, and ebiripo, respectively than the samples with less than 40% cowpea flour substitution.
The percentage fat content of all the developed recipes differ significantly P<0.05, except the cowpea flour substitution of 40% and 50% for ikokore. The fat content increased with the increase in cowpea flour.
The fibre content of the products ranged from 2.32% to 3.08%. The 50% cowpea flour substitution of ikokore was significantly higher in crude fibre 3.08% at P<0.05, whereas the ebiripo control sample had the lowest crude fibre percentage 2.32%.
The carbohydrate content decreased 30.09% to 12.77% with an increase in the percentage 20% to 50% of cowpea flour Table 1–3. There was no significant difference P>0.05 in the carbohydrate contents of the ebiripo samples. However, the percentage carbohydrate content of ojojo and ikokore samples differs significantly above 20% addition of cowpea flour P=0.05.
Mineral composition
The results of mineral composition of the recipes developed are shown in Tables 4, 5, and 6. The percentage ash contents were greatest in all the 50% cowpea flour substituted recipes i.e., ojojo, ikokore, and ebiripo, although ikokore had the highest percentage ash content of 3.20% when compared with ojojo and ebiripo with 2.8% and 2.88%, respectively.
| Food sample | Calcium SD |
Iron SD |
Potassium SD |
Phosphorus SD |
Sodium SD |
Zinc SD |
||||||
|---|---|---|---|---|---|---|---|---|---|---|---|---|
| Control | 51.7a | 0.11 | 0.70e | 0.20 | 1113.8a | 0.63 | 59.83e | 0.03 | 277.6e | 0.10 | 0.40e | 0.00 |
| 80:20 | 45.36b | 0.03 | 1.0d | 0.00 | 1039.2b | 0.05 | 72.13d | 0.08 | 484.8d | 0.01 | 0.78d | 0.00 |
| 70:30 | 42.1c | 0.03 | 1.10c | 0.00 | 987.8c | 0.05 | 78.30c | 0.05 | 513.4c | 0.02 | 0.95c | 0.00 |
| 60:40 | 39.8d | 0.05 | 1.19b | 0.00 | 834.4d | 0.05 | 83.9b | 0.00 | 801b | 0.19 | 1.2a | 0.00 |
| 50:50 | 35.5e | 0.00 | 1.3a | 0.00 | 795.5e | 0.00 | 91.5a | 0.57 | 1158.8a | 0.01 | 1.17b | 0.00 |
Means along the same column with different superscripts are significantly different from each other P < 0.05.
Table 4: Mineral Composition mg/100 g of Ojojo and Developed Recipes.
| Food sample | Calcium | SD | Iron | SD | Potassium | SD | Phosphorus | SD | Sodium |
SD | Zinc | SD |
|---|---|---|---|---|---|---|---|---|---|---|---|---|
| Control | 54.43a | 0.23 | 0.91e | 0.2 | 1125.5a | 0.26 | 63.4e | 0.11 | 434e | 0.09 | 0.44e | 0.00 |
| 80:20 | 45.56b | 0.06 | 1.2d | 0.05 | 1065.5b | 0.27 | 73.6d | 0.11 | 681.8d | 0.01 | 0.95d | 0.00 |
| 70:30 | 39.8c | 0.01 | 1.70c | 0.00 | 1015.3c | 0.20 | 79.16c | 0.06 | 864.1c | 0.04 | 1.36c | 0.00 |
| 60:40 | 34.71d | 0.00 | 2.15b | 0.02 | 942.08d | 0.01 | 85.8b | 0.00 | 1,172b | 0.08 | 1.74b | 0.00 |
| 50:50 | 32.85e | 0.01 | 2.50a | 0.00 | 897.33e | 0.08 | 92.5a | 0.00 | 1,407.97a | 0.01 | 1.92a | 0.00 |
Means along the same column with different superscripts are significantly different from each other P < 0.05.
Table 5: Mineral Composition mg/100 g of Ikokore and Developed Recipes.
| Food sample | Calcium |
SD | Iron | SD | Potassium |
SD | Phosphorus |
SD | Sodium | SD | Zinc | SD |
|---|---|---|---|---|---|---|---|---|---|---|---|---|
| Control | 56.3a | 0.11 | 0.77e | 0.01 | 1045.3a | 0.96 | 59.83e | 0.44 | 260e | 0.02 | 0.37c | 0.00 |
| 80:20 | 49.4b | 0.05 | 1.00d | 0.00 | 998.7b | 0.11 | 66.6d | 0.11 | 525d | 0.01 | 0.91b | 0.00 |
| 70:30 | 46.06c | 0.03 | 1.13c | 0.00 | 938.8c | 0.00 | 72.80c | 0.00 | 863c | 0.01 | 1.31a | 0.26 |
| 60:40 | 42.8d | 0.05 | 1.2b | 0.00 | 890.7d | 0.11 | 79.83b | 0.06 | 1118b | 0.01 | 1.2ab | 0.00 |
| 50:50 | 39.53e | 0.8 | 1.3a | 0.00 | 810.5e | 1.15 | 85.2a | 0.11 | 1,273a | 0.01 | 1.55a | 0.00 |
Means along the same column with different superscripts are significantly different from each other P < 0.05.
Table 6: Mineral Composition mg/100 g of Ebiripo and Developed Recipes.
For 0-50% cowpea flour substitution, ikokore had the highest value of iron, ranging from 0.91-2.5 mg/100 g, compared with ojojo with 0.70-1.30 mg/100 g and ebiripo with 0.77-1.30 mg/100 g. ikokore had the highest value of phosphorous, ranging from 63.40-92.50 mg/100 g, compared with ojojo with values of 59.83-91.50 mg/100 g and ebiripo with values of 59.83-85.2 mg/100 g. ikokore recorded the highest value of zinc, ranging from 0.44-1.92 mg/100 g, whereas ojojo had values of 0.40-1.17 mg/100 g and ebiripo had values of 0.37-1.55 mg/100 g.
It was observed from the table of results that the values of calcium and potassium in all the control recipes 100% cocoyam flour of ojojo, ikokore, and ebiripo decreased with increasing cowpea flour. For calcium, the recipes of ojojo with 0-50% cowpea flour had the least decrease, ranging from 51.7-35.50 mg/100 g, whereas ebiripo followed with values of 56.30–39.53 mg/100 g, and ikokore was the lowest with values of 54.43-32.85 mg/100 g. For potassium, ikokore had the least decrease of 1,125.50-897.33 mg/100 g, followed by ebiripo with values of 1,045.30-810.50 mg/100 g, and ojojo had the lowest value of 1,113.80- 795.50 mg/100 g.
Sensory evaluation
The results of the sensory evaluation of the recipes produced are shown in Tables 7, 8, and 9.
| Food sample | Colour |
SD | Flavour | SD | Fluffiness |
SD | Taste | SD | Overall acceptability | SD |
|---|---|---|---|---|---|---|---|---|---|---|
| Ojojo | 6.44ab | 0.18 | 6.20a | 0.16 | 6.12ab | 0.13 | 6.12ab | 0.23 | 6.16ab | 0.16 |
| 80:20 | 5.96b | 0.19 | 6.12a | 0.17 | 6.32a | 0.21 | 5.92ab | 0.14 | 5.80b | 0.14 |
| 70:30 | 6.08b | 0.18 | 5.80a | 0.19 | 5.96ab | 0.16 | 6.08ab | 0.20 | 5.88b | 0.19 |
| 60:40 | 6.96a | 0.19 | 6.28a | 0.14 | 6.12ab | 0.12 | 6.48a | 0.25 | 6.64a | 0.22 |
| 50:50 | 5.96b | 0.19 | 5.92a | 0.16 | 5.68b | 0.21 | 5.72b | 0.18 | 5.80b | 0.18 |
Means along the same column with the same superscripts are not significantly different from each other P < 0.05.
Table 7: Effect of Cowpea Flour on the Sensory Characteristics of Ojojo.
| Food sample | Colour | SD | Flavour | SD | Fluffiness | SD | Taste | SD | Overall acceptability | SD |
|---|---|---|---|---|---|---|---|---|---|---|
| Ikokore | 5.32c | 0.17 | 5.48c | 0.15 | 5.56b | 0.19 | 5.36c | 0.22 | 5.20c | 0.22 |
| 80:20 | 6.00b | 0.24 | 5.84bc | 0.19 | 6.32a | 0.21 | 6.12b | 0.19 | 6.20ab | 0.20 |
| 70:30 | 6.28b | 0.18 | 6.12ab | 0.17 | 6.44a | 0.17 | 6.17ab | 0.21 | 6.52a | 0.17 |
| 60:40 | 6.92a | 0.20S | 6.56a | 0.16 | 6.56a | 0.22 | 6.68a | 0.15 | 6.52a | 0.18 |
| 50:50 | 5.88b | 0.16 | 6.00b | 0.18 | 6.04ab | 0.17 | 6.04b | 0.17 | 5.92b | 0.17 |
Means along the same column with different superscripts are significantly different from each other P < 0.05.
Table 8: Effect of Cowpea Flour on the Sensory Characteristics of Ikokore.
| Food sample | Colour | SD | Flavour | SD | Fluffiness | SD | Taste | SD | Overall acceptability | SD |
|---|---|---|---|---|---|---|---|---|---|---|
| Ebiripo | 7.48a | 0.14 | 7.24a | 0.14 | 7.48a | 0.13 | 7.88a | 0.06 | 7.28a | 0.11 |
| 80:20 | 7.00b | 0.14 | 7.24a | 0.14 | 7.04b | 0.12 | 7.32b | 0.15 | 7.52a | 0.12 |
| 70:30 | 5.96c | 0.16 | 5.60b | 0.17 | 5.76c | 0.16 | 6.16c | 0.17 | 6.48b | 0.14 |
| 60:40 | 5.64c | 0.14 | 5.52b | 0.16 | 6.12c | 0.13 | 6.32c | 0.19 | 5.84c | 0.14 |
| 50:50 | 5.20d | 0.13 | 5.52b | 0.12 | 5.04d | 0.19 | 6.40c | 0.22 | 6.04c | 0.21 |
Table 9: Effect of Cowpea Flour on the Sensory Characteristics of Ebiripo.
For ojojo, the control sample had the most acceptable colour with a mean value of 6.44, whereas samples with 20% and 50% cowpea flour substitution had the least acceptable colour with a mean value of 5.96.
Also, samples of ojojo with 40% cowpea flour substitution had the most acceptable flavour with a mean value of 6.28, whereas the sample with the least acceptable flavour was 30% cowpea flour substitution with a mean value of 5.80. The 20% cowpea flour substitution had the most acceptable fluffiness with a mean value of 6.32, whereas the sample with 50% cowpea flour substitution had the least acceptable fluffiness with a mean value of 5.68. Lastly, the sample with 40% cowpea flour substitution had the highest taste acceptability with a mean value of 6.48, whereas the sample with 50% cowpea flour substitution had the least with a mean value of 5.72. In summary, samples of ojojo with 40% cowpea flour substitution had the highest mean value of overall acceptability of 6.64, whereas samples with 20% and 50% had the least overall acceptability with a mean value of 5.80.
For ikokore, the sample with 40% cowpea flour substitution had the most acceptable colour, flavour, fluffiness, and taste with mean values of 6.92, 6.56, 6.56, and 6.68, respectively. The control sample 100% cocoyam had the least acceptable colour, flavour, fluffiness, and taste with mean values of 5.32, 5.48, 5.56, and 5.36, respectively. In summary, samples of ikokore with 40% and 30% cowpea flour substitution had the highest mean value of overall acceptability of 6.52, whereas the control sample 100% cocoyam had the least mean value of overall acceptability of 5.20.
For ebiripo, the control sample had the highest acceptability for colour, flavour, fluffiness, and taste, with mean values of 7.48, 7.24, 7.48, and 7.88, respectively. Samples with 50% cowpea flour substitution had the least acceptability for colour, flavour, and fluffiness with mean values of 5.20, 5.52, and 5.04, respectively. Samples with 30% cowpea flour substitution had the least acceptability for taste with a mean value of 6.16. In summary, the sample with 20% cowpea flour substitution had the most overall acceptability with a mean value of 7.52, whereas samples with 40% cowpea flour substitution had the least overall acceptability with a mean value of 5.84.
Nutrient Content
The moisture content is significantly different in ebiripo than other blends. With cowpea, it’s not a surprise because cocoyam like any other root have a very high content of moisture 71.7% , although the flour is in dry form but in formation of paste and reconstitution in to fresh form allow the ebiripo display its physico-chemical properties.
The physical and mechanical properties of cocoyam including shape, size, geometric mean diameter, viscosity bulk density gelatinization sphericity, color, mass, volume, particle density, surface area and compressive strength and the relationship of between size , surface area and weight have been identified to contribute to water retention [14,15].
The increase in cowpea flour significantly increases the protein for all samples ojojo, ikokore, and ebiripo. The increase may be attributed to cowpea flour since cocoyam is known to have low protein. This result is also similar to Sowoola et al. [16] where a significant increase was also observed in cocoyam /soybean/soy residue blends. [16]. This increase can help the consumer to enrich cocoyam by adding cowpea flour. The ikokore at 50:50 ratio has significantly higher protein than the control because of the maximum cowpea content coupled with other ingredients like fish that has been added to the ikokore recipe have definitely accounted for a higher protein and minerals than others at the same 50:50 ratio. Comparing the protein and moisture content at 50:50 can cause variations in value of protein as well as the cooking procedure.
This expected increase in the protein of the blends is the basis for the enrichment such that the final product will have higher protein content and higher protein quality. Because tubers including cocoyam are low in sulfur amino acids [17,18], the proteins in cowpea flour complement those of cocoyam and thus improve the nutritional quality of traditional recipes. There is a general improvement of fat and crude fibre with increasing ratios of cowpea flour to cocoyam. The importance of fibre in the diet of man cannot be over-emphasised to improve laxation, reduce diverticular disease and obesity, and in its dietetic value for diabetes.
Ash is a non-organic compound reflecting the mineral content of food. Nutritionally, ash aids in the metabolism of other organic compounds such as carbohydrate and fat [19,20]. The percentage ash, which is an indicator of the mineral content of the product, increased with an increase in the percentage of cowpea in all the developed recipes of ojojo, ikokore, and ebiripo. The ash content of ikokore and the high mineral value may be the result of smoked fish which resulted in the value addition for high mineral content especially iron.
Iron, phosphorus, and zinc contents were highest in 50% cowpea flour substituted samples of ikokore, ojojo, and ebiripo. By contrast, calcium and potassium contents decreased with increasing percentage of cowpea flour substitution in all the samples. The high calcium in ebiripo control sample is likely due to the cocoyam flour volume which literature reveal that cocoyam is very high in calcium [17,21]. Through the observation of Sowoola et al. [16], it has been revealed that calcium increased with high volume of cocoyam flour.
Sensory evaluation
ojojo: The control sample 100% cocoyam had the most acceptable colour. However, the sample with 40% cowpea flour substitution was most acceptable in terms of flavour, taste, and overall acceptability. This result also could be attributed to the bean flavour of cowpea. The sample with 20% cowpea flour substitution had the most acceptable texture fluffiness.
ikokore: The sample with 40% cowpea flour substitution had the highest acceptability in all the sensory attributes i.e., colour, flavour, fluffiness, taste, and overall acceptability.
ebiripo: The control sample had the highest acceptability in colour, flavour, fluffiness, and taste. This could be attributed to the incompatibility and blending of cowpea flour characteristics with other ingredients in the preparation of ebiripo. However, the sample with 20% cowpea flour substitution had the highest overall acceptability.
Conclusions
This work has shown that significant improvement in the chemical composition, including protein and micronutrients, is attained through the use of cowpea flour enrichments of cocoyam-based recipes.
The enriched cocoyam-based recipes are higher in protein, fat, crude fibre, and minerals especially iron, zinc, and phosphorus than the pure cocoyam food products.
In the organoleptic assessment, 40% cowpea flour substituted samples of ikokore had the best rating in general acceptability, and 40% cowpea flour substituted samples of ojojo were significantly higher in general acceptability than the other developed recipes, whereas the 50:50 ratio had the highest protein content.
Recommendations
Based on the results of the study, the following recommendations are made:
• Enrichment of cocoyam-based foods should be encouraged.
• Nutritionists should create awareness and educate health workers and the general populace on the nutritive value of cocoyam recipes.
• The bioavailability of the nutrients should be carried out.
• Substitution upto 50% cocoyam and 50% cowpea is recommended for vulnerable groups.