Journal of Nutrition & Food Sciences
Open Access
ISSN: 2155-9600
ISSN: 2155-9600
Research Article - (2025)Volume 15, Issue 3
Medicinal plants have been a crucial source of indigenous medicines for curing diseases and are playing a vital role in pharmaceutical industries. Complete information about the composition of medicinal plants is desirable because these plants play important role in metabolic reactions. The present works aimed the compositional analysis of one of the important anticancer medicinal plant named Otostegia limbata Medicinal Plant (OL-MP). Four major parts of the plant including root, bark, flowers, leaves and soil samples were analyzed using fast and efficient Laser-Induced Breakdown Spectroscopic technique (LIBS). Twelve elements including Ca, Mg, Al, K, Sr, Ba, Fe, Ti, Cr, Mn, Li and Na with different concentrations were detected in soil and various parts of the plant. Plasma temperature and electron number density was estimated using Boltzmann plot method and stark broadening parameter around (10,000 ± 1000K) and (1.31 ± 1.00 × 1017 cm-3). The proposed method accuracy was found to be comparable with high technical complicated lab equipment and the concentrations of detected elements were determined and were found to be below the toxic level. Inclusive analysis based on the innovated non-destructive methodology reveals that it can be used for direct monitoring the toxicity for quality assurance in the homeopathic and pharmaceutical industries.
Medicinal plant; Otostegia limbata; LIBS; Compositional analysis; Anticancer
Medicinal plants have been the crucial source of indigenous medicines used by earlier civilizations and traditional practitioners for curing diseases known at that time and are playing a crucial role in the current era too [1]. For the conservation of traditional cultures, drug development, community healthcare, and biodiversity, the information about medicinal plants and indigenous medicines is very useful. Many of the earlier civilizations and traditional practitioners were aware of many of the medicinal plants which are still used against many diseases [2]. Most of the authentic information about these medicinal plants and indigenous medicines passes from generation to generation after some refining and modifications [3]. The trace elements that medicinal plants contain have a very significant role in metabolic reactions, physiological reactions and in active compound formation. Medicinal plants are also used in therapist treatments since they contain many natural ingredients which are more useful for the human body [4,5]. As medicinal plants have negligible side effects therefore, the homeopathic medicines are preferred than the allopathic or synthetic drugs. Out of a total of about 4, 20000 flowering plants, almost 35000 plants are being used for medicinal purposes [6]. More than 80% of the people in developing countries relies on self-medication through these medicinal plants [7,8]. About 6000 vascular plant species are found in the world [9-11] and among these plant species only 400 to 600 species are being used for medicinal purposes [12].
Lamiaceae is one of the most unique family of flowering plants [13]. Out of its 33 species, only Otostegia limbata (OP-MP) is used as anticancer medicinal plant [14]. OP-MP has long axillary flowers bloom and clusters and bears a pale yellowish color. OPMP is used for the therapy of many diseases, its juice is used to cure ophthalmia and bleeding gums of children while its aqueous leaves extract is used to cure eye inflammations and infections [15,16]. Some derivatives of this plant are used in the therapy of cough and asthma, and it also contains flavonoids which have antiallergic properties. The metabolic extract of OPMP has the ability of radical scavenging or donating a hydrogen through 1,1-diohenyl-2-picrylhydrazyl whose values determine the strength of OP-MP to neutralize free radicals which can be used in cancer treatment [17,18]. OP-MP is considered to be an alternative antibacterial substance which could be developed into strong antibiotics it has a broad spectrum of antibiotic agents and it can be used against the fatal pathogens methicillinresistant S. aureus and vancomycin-resistant E. faecalis [19]. OPMP has hemagglutination activity in all blood groups which indicates the presence of lectins [20]. Lectins are useful for the analysis of histochemistry, glycopeptide and glycoconjugate isolation and characterization and studying cell differentiation. These are also useful in the investigation of cellular membranes and to cure several types of skin cancers.
Different analysis techniques/tests have been utilized to get the information about the medicinal plants including disc diffusion method, Minimum Inhibitory Concentration (MIC) test, Minimum bactericidal concentration tests, Energy Dispersive Spectroscopy (EDS), X-ray Fluorescence spectroscopy (XRF) and laser ablation time of flight mass spectrometry LA-TOFMS and Laser induced breakdown spectroscopy. But most of them are complex, time consuming and difficult to deal with. Only EDS, XRF and LIBS are the non-distractive and fast techniques to get the elemental composition. EDS and XRF have some limitations, elements having low atomic number cannot be detected accurately. Laser-Induced Breakdown Spectroscopy (LIBS) is a fast, sensitive, non-destructive, no proper sample requirements, remote analytical technique with having relatively low detection limit and precise analytical technique for quantitative and qualitative analysis having a lot of applications. The LIBS has become a commercial spectroscopic technique in the pharmaceutical and homeopathic medicine industries. Moreover, this technique can also be used to analyze the nearby soil of the plant very easily which could be helpful to identify the possible sources of the constituents of the plant.
In this contribution, compositional analysis of one of the most important medical plant Otostegia limbata (OL-MP) is performed using Laser Induced Breakdown Spectroscopy (LIBS). To the best of our knowledge, no such study on this plant is previously reported. Four major parts of the plant including root, bark, flowers, leaves and soil was analyzed. Twelve elements including Ca, Mg, Al, K, Sr, Ba, Fe, Ti, Cr, Mn, Li and Na in soil and in different parts of the plant with varying concentrations were detected. It was observed that in the root, the most abundant elements were Fe, K and Na whereas, major part of the bark, leaves and flowers consists of Ca. Not any health hazardous element beyond the safe limit was observed in this anticancer medicinal plant (OL-MP), so its use to cure the various diseases is save. This study also demonstrates the versatility of LIBS techniques for the analysis medicinal plants and it can be utilized in the herbal and homeopathic industries.
Experimental procedure
Samples of different parts of OL-MP including root, leaves, flowers, bark and soil were collected from District Muzaffarabad, Azad Kashmir, Pakistan. For the analysis, these samples were cut into fine pieces, each of diameter 20 mm and 2 mm thickness, put into sunlight for drying before examining them. These samples were then crushed in the form of fine powder. Pellets of these samples were formed using the hydraulic pressure under 30-ton pressure for the 3 hours to form fine and hard pellet. Experimental setup used for the analysis of the OL-MP plant is shown in Figure 1, also discussed in papers. In brief, for ablation a high-power Q-switched Nd: YAG laser having a pulse width of 5 ns and repetition rate of 10 Hz, the energy delivered by this device is 200 mJ at 532 nm and 400 mJ at 1064 nm was utilized. An energy meter (Nova-Quantal France was used to adjust and measure the energy of the laser pulse by adjusting the delay of the Q-switch. A convex lens with a focal length of 20 cm was used to focus a pulse of energy 50-100 mJ on the pellet. The spot size of the laser beam was about 0.10 cm. The capture of the emission spectra and giving a new surface to each shot of the laser was done by positioning the samples on a revolving turntable. The sample was kept at a distance greater than 20 cm which was focal length of the lens used, to avoid the air breakdown in front of the used sample.

Figure 1: Experimental setup LIBS analysis.
To collect the light emitted from plasma plume, an optical fiber having high-OH and core diameter of 600 micro meters, with a collimating lens (0-45° field of view) were positioned normal to this plasma plume. The emitted radiations were measured using a group of four spectrometers with 10 m slit width of each. This group of spectrometers covered the wavelength range from 250 nm to 880 nm. From the actual emission spectrum, the dark signal was deducted using LIBS to adjust it. The emitted radiation spectrum was recognized by system software after it was routed to the spectrometer using optical fiber. The light collected by the detector in the form of panels was saved by it as an intensity data. For the measurement of the emitted plasma, an optical cable was attached to the detector. At last, the emission spectra of each sample were compared with NIST Atomic Data Base.
Emission studies
To determine the major and trace elements in OL-MP, we compared the emission lines of relatively high intensity, detected by each element of the sample with NIST database spectral lines. The emission spectra of these samples ranges from 250 to 950 nm. Figure 2a shows the optical emission spectra of the soil sample in the wavelength range from 265 nm to 305 nm. The spectra showed 42 lines belonging to Fe I while 25 of the lines in this wavelength range were belonging to Fe II. Optical emission lines observed at 279.55 nm, 279.80 nm, 279.07 nm and 280.25 nm are identified as Mg-II, while emission lines observed at 278.14 nm, 278.29 nm and 285.21 nm were identified as Mg-I. Only one spectral line of Si-I was observed at 288.15 nm in this spectral range.
Figure 2b shows the observed spectrum of the soil in the wavelength range from 415 nm to 505 nm. In this wavelength range, 25 of the spectral lines belonged to Ti I while 23 to Fe I. The lines of Ca I were observed at 422.67 nm, 428.30 nm, 428.93 nm, 429.90 nm, 430.25 nm, 430.70 nm, 431.86 nm, 442.54 nm, 443.49 nm, 445.47 nm, 458.14 nm, 457.85 nm, 458.58 nm and 487.81 nm. Two spectral lines at 489.99 nm and 493.40 nm were belonged to Ba II. The spectral lines of Cr I were observed at 425.22 nm and 455.39 nm. Two spectral lines of Sr I were also observed at 448.05 nm and 460.73 nm. The lines at 439.50 nm, 446.84 nm, 450.12 nm, 454.94 nm, 456.37 nm and 457.19 nm were belonged to Ti-II. Spectral line observed at 421.55 nm was identified as Sr-II, spectral line observed at 441.48 nm was identified as Mn I, spectral line observed at 478.30 nm was identified as Si I and spectral line observed at 485.57 nm was identified as KI.

Figure 2: (a) Optical emission spectrum of soil in the wavelength range 265 nm-305 nm, (b) 415 nm-505 nm.
Figure 3 shows the optical emission spectra root, bark, leaves and flowers of OL-MP in the wavelength range from 415 nm to 505 nm, 415 nm to 505 nm, 415 nm to 505 nm and 415 nm to 505 nm. In the first wavelength region (root) it was observed that Ti I and Ca I were abundant. Fourteen lines of Ti I and fourteen spectral lines of Ca I were observed in this wavelength range. The emission lines observed at 420.18 nm, 438.35 nm, 487.14 nm, 489.14 nm and 495.76 nm were identified as Fe I. Two spectral lines of Sr I were observed at 448.05 nm and 460.73 nm. Sr II, Cr I, Ti II, Ba II and Si II have only single lines in this wavelength range at 421.55 nm, 455.39 nm, 454.94 nm, 493.40 nm and 504.10 nm respectively. In the emission spectrum of the bark of the plant in the wavelength range from 415 nm to 505 nm, it was observed that Ti I, Fe I and Ca I were the abundant elements with 9, 10 and 12 observed emission spectral lines. The lines corresponding to the wavelengths of 439.50 nm, 446.84 nm, 456.37 nm and 457.19 nm belonged to Ti II. The lines of Cr I were observed at 425.22 nm, 455.39 nm and 481.07 nm. Sr I had 2 observed lines at 448.05 nm and 460.73 nm. Kr I, Si I, Si II, Ba II and Fe II each have a single spectral line at 427.39 nm, 482.33 nm, 504.10 nm, 493.40 nm and 503.57 nm respectively. Emission spectrum of the leaves of the plant in the wavelength range from 415 nm to 505 nm showed that the Ca I was most abundant element in this wavelength range with 15 spectral lines. Sr I had two spectral lines at 448.04 nm and 460.73 nm. Sr II, Cr I, Fe I and Ba II each have single spectral line at 421.55 nm, 455.39 nm, 487.14 nm and 493.40 nm respectively. Finally the emission spectrum of the flower of the plant in the wavelength range from 415 nm to 505 nm showed that Ca was most abundant element with 13 spectral lines belonged Ca I. The lines observed at 498.17 nm, 499.10 nm, 499.95 nm and 501.41 nm were identified as Ti I. Two emission lines of Fe I were observed at 420.18 nm and 438.35 nm. Only one line of Sr II, Sr I, Ba II and Si II was observed at 421.55 nm, 480.73 nm, 493.40 nm and 504.10 nm respectively.

Figure 3: Optical emission spectrum of root ranging from 415 nm to 505 nm, bark from 415 nm to 505 nm, leaves from 415 nm to 505 nm and flowers from 415 nm to 505 nm.
Plasma temperature
The selection of lines to accord the plasma temperature is very crucial. The lines should be free from self-absorption, optically thin and in the Local Thermal Equilibrium (LTE). By suing the Boltzmann equation the integrated line intensity can be described as follows.
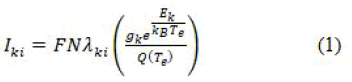
Where, F is an “experimental factor”, N the “number density of neutral or ionized atoms”, Aki the “transition probability”, gk the “degeneracy factor of upper level” k, Ek the “energy of the upper level of transition”, k the “Boltzmann constant”, Te the “excitation temperature” and Q(Te) the “partition function”. The Equation 1 can be modified as below to calculate plasma temperature:
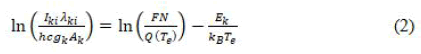
A plot of ln((Iki λki)/(hcgk Ak)) versus the upper levels energies Ek of the observed spectral lines yields a straight line with a slope m=-1/(kBTe) and an intercept as; qs=ln(FN/(Q(Te))). The slope of this straight line is utilized for the deduction of plasma temperature. The temperature is calculated by means of the Boltzmann plot method which is the simplest and accurate method for the estimation of temperature (Table 1).
| Wavelength λ (nm) | Transition | Transition Probability | Ek | gk | |
|---|---|---|---|---|---|
| Upper level | Lower level | × 107 (s -1) | (eV) | ||
| Fe I | |||||
| 438.35 | 3d74P → | 3d74s | 5 | 4.31 | 11 |
| 260.68 | 3d64s4p → | 3d74s | 2.43 | 5.66 | 11 |
| 298.72 | 3d64s4p → | 3d74s | 0.52 | 5.06 | 7 |
| 300.72 | 3d64s4p → | 3d64s2 | 0.27 | 4.2 | 5 |
| 347.63 | 3d64s4d → | 3d64s4p | 2.7 | 7.16 | 7 |
| 372.69 | 3d64s4d → | 3d64s4p | 4.57 | 6.36 | 5 |
| 489.14 | 3d64s5s → | 3d64s4p | 3.08 | 5.38 | 7 |
| Ca I | |||||
| 559.47 | 3p63d4p → | 3p63d4s | 3.8 | 4.73 | 5 |
| 610.27 | 3p64s5s → | 3p64s4p | 0.96 | 3.91 | 3 |
| 387.04 | 3p64s6f → | 3p63d4s | 7.2 | 5.72 | 5 |
| 646.25 | 3p63d4p → | 3p63d4s | 4.7 | 4.44 | 7 |
| 458.58 | 3p63d4s → | 3p64s4f | 2.29 | 5..22 | 9 |
| 558.87 | 3p63d4p → | 3p63d4s | 4.9 | 4.74 | 7 |
| Ti I | |||||
| 451.2753 | 3d34p → | 3d34s | 3.58 | 11 | |
| 465.6043 | 3d34p → | 3d34s | 4.41 | 5 | |
| 466.758 | 3d24s4p → | 3d24s2 | 2.68 | 9 | |
| 477.826 | 3d34p → | 3d34s | 4.83 | 9 | |
| Mn I | |||||
| 259.3721 | 3d54p → | 3d54s | 4.78 | 7 | |
| 403.307 | 3d54s4p → | 3d54s2 | 3.07 | 6 | |
| 403.45 | 3d54s4p → | 3d54s2 | 3.06 | 4 | |
| Mg I | |||||
| 278.1269 | 3s7s → | 3s3p | 7.17 | 1 | |
| 278.2799 | 3p2 → | 3s3p | 7.17 | 3 | |
| 285.1996 | 3s5d → | 3s3p | 4.35 | 3 | |
| 383.194 | 3s3d → | 3s3p | 5.95 | 3 | |
| 518.3249 | 3s4s → | 3s3p | 5.11 | 3 | |
Table 1: Spectroscopic parameters of the emission lines of Fe I, Ca I, Ti I, Mg I and Mn I used to construct the Boltzmann plots.
As number of lines of Fe I, Ca I, Ti I, Mg I and Mn I were present in all the spectra so well separated and optically thin the spectral lines of these elements were used for the measurement of temperature and the spectroscopic data of the lines presented in Table 1 was taken from NIST database. In the laser-induced plasma, self-absorption can occur because of photon absorption. Due to self-absorption in the parameters used in the equation used to find the plasma temperature and the transition probability, the results are given with about 10% error. The estimated plasma temperature of different parts of the plant including root, bark, leaves, flowers and nearby soil was observed in the range 9500 K to 11200 K. Figure 4a shows that the estimated plasma temperatures of soil, root, barq, leaves and flowers using Ca I lines.
The plasma temperatures of the soil, root, barq, leaves and flowers ample using Ca I lines was measured as 10404 K ± 1000 K, 11179 K ± 1000 K, 10583 K ± 1000 K, 10375 K ± 1000 K and 9559 K ± 1000 K respectively. Plasma temperature was estimated using Fe I, Ca I, Ti I, Mg I and Mn I lines. Figure 4b shows estimated plasma temperature soil sample using Fe I, Ca I, Ti I, Mg I and Mn I lines. The plasma temperature of the soil using Fe I, Ca I, Ti I, Mg I and Mn I lines was estimated about 10016 K ± 1000 K, 10404 K ± 1000 K, 10460 K ± 1000 K, 9615 K ± 1000 K and 10676 K ± 1000 K respectively. An average value of the plasma temperature 104234 K ± 1000 K was used for further analysis. Similarly, the plasma temperature of the root, barq, leaves and flowers was calculated using Fe I, Ca I, Ti I, Mg I and Mn I lines and an average value of plasma temperature was utilized for further analysis for all the samples.

Figure 4: (a) Boltzmann plots of soil, root, barq, leaves and flowers using Ca I emission lines;(b) soil sample using Fe I, Ca I, Ti I, Mg I and Mn I emission lines.
Measurement of electron number density
For the measurement of the electron number density isolated and Stark broadened line profiles of Ca I at 616.21 nm and the Stark broadened line profile of the hydrogen Hα at 656.28 nm was utilized. The width ΔλFWHM FWHMs of these lines were determined by de-convoluting the observed line profiles as a Voigt profile, which takes into account the instrumental width, the Doppler width and the Stark broadening. The instrumental width of our spectrometer is about 0.06 ± 0.01 nm whereas, the Doppler width is about 0.005 nm. The Stark width is related to the electron number density as.
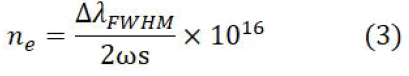
Here, ΔλFWHM is the full width at half maxima and ωs is the Stark broadening parameter, which is slightly wavelength and temperature dependent. Figure 5a shows the Stark broadened line profile of the Ca I line at 621.28 nm for the soil sample. The dots represent the experimental data points and the full line is the Voigt fit, yielding FWHM as (0.11 ± 0.01) nm. The Stark broadening parameter for this line is reported in the literature as 0.00698 nm . The electron number density is calculated using as (1.1 ± 0.01) × 1017 cm-3 which includes the errors associated with the extracted FWHM and that in the Stark broadening parameter.

Figure 5: Stark-broadened profile of (a) Ca I line at 616.21 nm, (b) Hα line at 656.28 nm.
The following equation shows formula for the calculation of electron number density for the soil sample.
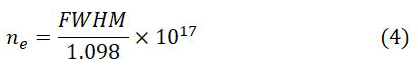
Electron number density for the soil sample was also estimated using Hα line at 656.28 nm as 1.3 ± 0.01 × 1017 cm-3 is the deducted value of electron number density of soil. Figure 5b shows the stark broadened line profile of the Hα line at 656.28 nm, here blue color steric represent the data point and red color line represent the fitting of the data. A good agreement between the number densities derived from the Stark Broadening parameter of Ca I line at 616.21 nm and hydrogen Hα line at 656.54 nm is observed. Average value of the electron number density for the soil sample about 1.2 ± 0.01 × 1017 cm-3 is utilized for further calculations. Similarly, electron number densities were calculated for all the samples using Ca I at 616.21 nm and hydrogen Hα line at 656.54 nm and an average values of number densities were utilized for compositional analysis. To use the plasma for compositional analysis, it is necessary plasma must be optically thin and in Local Thermodynamic Equilibrium (LTE). To check the optically thin condition, the line intensity rations of various emission lines of Ca were compared with the ratio of their transition probabilities for the validation of the condition for the optically thin, the deducted results were agreed within 10% uncertainty. The criteria proposed by McWhirter to check the Local Thermodynamic Equilibrium (LTE), has been also validated for Hα at 656.28 nm line. The relation Ne>1.6 × 10¹² × ΔE3 × T1/2 is used to calculate the lower limit of the electron density. Here, ΔE shows the difference between the upper and the lower energy levels while T indicates the excitation temperature. The calculations from the emission lines of Hα at 656.28 nm revealed the values of the lower limits of electron densities to be (1.06-1.13 ± 0.5) × 1015 cm-3. Evidently, the Hα number densities calculated by using the McWhirter criteria are far below lower than the ones obtained from the Stark broadening parameters, that range from (1.31-1.52 ± 0.5) × 1017 cm-3. So it can be claimed that the plasma is closer to LTE.
Compositional analysis
In order to determine the composition of basic Boltzmann equation is used, which connects the intensities of emission lines to the concentration of the elements. The emission line intensities from the same species are connected by this equation as.
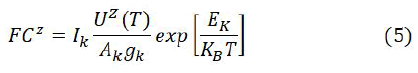
In this equation Ik is the intensity of the line, Cs denotes the concentration of neutral atoms F denotes the ablated mass which is constant for constant efficiency of spectral system. By adjusting the concentration for normality, the factor F can be calculated. The partition functions are collected from the NIST database at average plasma temperature, and above equation is used to determine the concentration of neutral atom Cz. The Saha Boltzmann relation which relates the concentration in two subsequent states Z and Z+1 of a certain atom is used to compute the concentration of the ionized atom C(z+1) if ionic lines are not present for all elements.
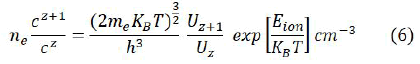
The ratio of concentration of two subsequent charge state Z and Z+1 of a certain element is C(z+1)/Cz obtained from equation (6). To calculate C(Z+1) we substitute value of CZ from equation (5) is used in equation 6 and finally total concentration of an element in the sample is calculated by the sum of its contribution or neutral as well as ionized species. Following relation is used to calculate the percentage composition.
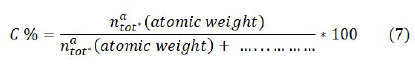
Where, natot is the contribution of an element and C% is the relative percentage of that element in the sample. Adopting the same procedure, elemental composition of soil and different parts of the plant was calculated. Figure 6 presents the relative compositions of detected elements in the soil samples. From this figure, it is clear that the concentration of silicon and calcium is high in the soil (22.8% and 13.5% respectively) whereas, other elements are present with moderate concentration, Mg (1.8%), Al (11.1%), k (4.7%), Sr (6.2%), Ba (9.6%), Fe (4.6%), Ti (4.72%), Cr (7.5%). Manganese (0.4%), lithium (2.9%), and sodium (1.4%). In root concentration of calcium and iron is very high around 34.7% and 18.5% respectively. Mg (4.5%), Al (3.5%), K (9.4%), Sr (2.2%), Ba (5.2%), Si (5.8%), and Cr (4.4%) are present in moderate concentration. Manganese (0.7%), titanium (0.8%), lithium (2.8%) and strontium (2.2%) are present in trace amounts. In bark, the concentration of calcium (24.11%), potassium (19.38%), and iron (16.38%) are relatively higher whereas, other elements are present in moderate concentration. Manganese (0.96%) and lithium titanium (0.88%) are present in trace amounts. The concentration of chromium (6.68%) is high compared to the root of this plant.

Figure 6: Relative compositions of detected elements in the soil samples.
In leaves the concentrations of calcium and barium are around 30.6% and 20.3%. Manganese (0.1%), sodium (1.1%) aluminum (1.2%), lithium (2.1%), and silicon (2.1%) are present in trace amounts. The concentration of barium (20.3%) is high as compared to the root and bark of this plan. All other elements are present in moderate concentration.
In flowers, the concentrations of calcium are high (34.9%) whereas, other elements are present in moderate concentration. Manganese (0.1%), sodium (1.4%), aluminum (1.6%), lithium (3.1%), strontium (2.7%), and silicon (4.3%) are present in trace amounts. In this part, the heavy concentration of heavy metals is lower than in root, bark, and leaves. Figure 7 shows the comparison of relative compositions of detected elements in the soil, root, bark, leaves, and flower of OL-MP. This graph depicts the presence of micro and macro-nutrients/elements in different parts of the plant.

Figure 7: Comparison of relative compositions of detected elements in soil, root, bark, leaves, and flower samples.
Variation of detected elements
Figure 8a-j shows variation of different elements from soil-rootbark- leaves-flowers. This graph shows how different elements travel and accumulate in different parts of the plant. It is clear that the concentration of titanium is higher in flowers as compared to the other parts of the plant. Calcium is present in the higher amount and small amount of manganese are present in all parts of plant. Trace elements Al, Ba, Si, Li and Ti are also present. These elements carried from soil to the different parts of plant as all these elements are also present in the soil as well. It is also observed that calcium has major contribution in the compositions of all parts of the plant. Si is high in the soil because silicon is the major part of clay. Concentration of Li remained same from soil to flower, sodium is high in root and bark so this part of the plant is not recommended for the blood pressure patient. Concentrations of magnesium is less than 10% in all parts of the plant. Aluminum is high in the soil but lower in the leaves and flowers. Potassium is accumulated in the bark of this plant. Concentrations of strontium and chromium is reduced from soil to flower. Concentration of titanium is higher in the flower as compared to the other parts of the sample. Iron is lower in the soil but it is accumulated in the different parts of the plant. Concentration of barium is higher in the leaves as compared to the other parts of the sample. Manganese is present in all parts of the plant in a trace amount.

Figure 8 (a-j): variation of relative compositions of detected elements in soil, root, bark, leaves and flower samples.
From Figure 8a it can be seen that concentration of calcium is higher in flower and root as compared to the other parts of the plant. Concentration of calcium is little bit higher in leaves than bark. Calcium is the most prevalent element in the medicinal plants. It is a vital mineral found primarily in teeth, bones, and nails, with the rest calcium found in body fluids, blood, and nerves. It plays a significant part in the contraction and relaxation of muscles and blood vessels. Both children and adults need it for healthy bones and teeth. It also contributes to the release of hormones and enzymes that have a variety of functions in the body, including the regulation of asthma. It reduces the problems of heart attack, high blood pressure, and osteoporosis in old age. All of the plant samples had higher examined calcium values. Therefore, these plants may be useful in treating bone problems and cell communication that controls muscle contraction and relaxation. From Figure 8b it is clear that the concentration of iron is higher in roots and bark than other parts of the plant. Concentration of iron in flowers and leaves are nearly equal. Iron is a trace mineral that occurs naturally in medicinal plants and is regarded as being important for human health. A large amount of iron present in the blood while bone marrow, muscles, and liver also contain small fraction of iron. It is the primary component of red blood cells involved in the delivery of oxygen, and without iron, oxygen would not bind with hemoglobin, decreasing the production of energy required for life. It is essential for the production of certain hormones, development, growth, and a healthy immune system. According to this study, both the root and bark had significant iron concentrations. Therefore, it might be claimed that using the plant's root and bark will enhance cellular health and the immune system's response. Figure 8c shows that concentration of magnesium is higher in leaves and flowers of the plant. While root and bark contain relatively low concentration of magnesium. In human body magnesium is involved in about 300 enzymatic activities. It functions as a cofactor for numerous important enzymes necessary for energy metabolism and is also required for RNA and DNA synthesis, protein synthesis, muscle contractions, nerve transmission, insulin metabolism, cardiac excitability, and neuromuscular conductions. Its deficiency can cause a number of illnesses, including migraines, cardiovascular disease, stroke, constipation, diabetes, and hypertension. As leaves and flowers has a high quantity of magnesium. So it may be advised to use plant leaves and flowers to treat conditions including diabetes, hypertension, and constipation. Figure 8d shows that the concentration of potassium is higher in bark than other parts of the plant. Flowers and leaves also contain significant amount of potassium. The human body needs potassium, an essential mineral, in order for cells, organs, and tissues to function properly. It is essential for cardiac, digestion, and muscle contraction. Additionally, it keeps the heartbeat regular and lowers blood pressure. The measured potassium values in the current study show that the bark samples have higher potassium levels than the other plant samples. Due to potassium's involvement in maintaining cardiac rhythm, plant bark may be used for heart diseases. Figure 8e shows that the concentration of titanium is highest in flowers than other parts of plant. Titanium's no biological function in the human body has been established. The majority of the titanium does not absorb into the body; therefore, it poses no health risks. Similarly, Figure 8f-j shows that the concentration of Al, Sr, Ba, Mn and Cr is relatively low in all parts of plant compared to other detected elements. Total twelve elements were detected in all parts of the plants with different concentrations. Concentration of calcium is higher in leaves, bark and flowers. The concentration of iron, potassium and sodium is higher in roots. While the concentration of all other detected elements is relatively low as compared to these elements. So, different parts of this anti cancerous OL-MP can be used to cure many diseases.
In the present work, qualitative and quantitative analysis of soil and four major parts of the OL-MP including root, bark, flowers and leaves were performed using laser-induced breakdown spectroscopic technique. Plasma temperature and electron number density using Boltzmann plot method and stark broadening parameter was estimated for preceding calculations of relative compositions. Twelve elements including Ca, Mg, Al, K, Sr, Ba, Fe, Ti, Cr, Mn, Li and Na with different concentrations were detected in the soil and different parts of the plant. It was observed that in the root, the most abundant element was Fe, K and Na whereas, major parts of the bark, leaves and flowers consists of Ca. This study demonstrates that concentrations of detected elements were determined and were found to be below the toxic level. LIBS is non-destructive, fast and accurate technique and inclusive analysis based on this methodology reveals that it can be used for direct monitoring the toxicity for quality assurance in the homeopathic and pharmaceutical industries.
We are grateful to atomic and laser physics department, national centre for physics, Islamabad for providing the experimental facility.
The Authors have no conflict of interest.
[Crossref] [Google Scholar] [PubMed]
[Crossref] [Google Scholar] [PubMed]
[Crossref] [Google Scholar] [PubMed]
[Crossref] [Google Scholar] [PubMed]
[Crossref] [Google Scholar] [PubMed]
[Crossref] [Google Scholar] [PubMed]
[Google Scholar] [PubMed]
Citation: Ahmed N, Khan FW, Saddique M, Taj R, Baig MA (2025) Detection of Nutritional and Trance Elements in Otostegia limbata Medicinal Plant Using Laser Induced Breakdown Spectroscopy. J Nutr Food Sci. 15:079.
Received: 09-Oct-2024, Manuscript No. JNFS-23-27441; Editor assigned: 11-Oct-2024, Pre QC No. JNFS-23-27441 (PQ); Reviewed: 25-Oct-2024, QC No. JNFS-23-27441; Revised: 23-Feb-2025, Manuscript No. JNFS-23-27441 (R); Published: 01-Mar-2025 , DOI: 10.35248/2155-9600.25.15.079
Copyright: © 2025 Ahmed N, et al. This is an open-access article distributed under the terms of the Creative Commons Attribution License, which permits unrestricted use, distribution, and reproduction in any medium, provided the original author and source are credited.