Journal of Nutrition & Food Sciences
Open Access
ISSN: 2155-9600
ISSN: 2155-9600
Research Article - (2018) Volume 8, Issue 2
Malignant tumors exhibit an increase in glucose metabolism when compared to normal tissue. The increased metabolism generates an acidic tumor environment, which promotes local invasion, metastasis, and inhibition of immune surveillance. Oral buffers, e.g. 200 mM ad lib NaHCO3, can neutralize tumor acidity and prevent metastasis and improve immune therapy. Because of these promising results in preclinical cancers, phase I/ II clinical trials were initiated in cancer patients for either amelioration of pain or treatment of pancreatic cancer (GemTABS). In these two trials, NaHCO3 was provided in powdered form under an IND. However, compliance remains poor due to adverse effects including, but not limited to, diarrhea, vomitus, limb edema, and taste. Because of these challenges with buffer therapy in the clinic, we have investigated whether dietary manipulations could achieve the same effect by determining the buffering power of foodstuffs and supplements. From these data we generated a point system, wherein 1 point is equivalent to 1 g NaHCO3. Through endpoint titrations, we developed an analytical formula to relate points to food or supplement protein content (11 points per 100 g protein). Other buffers were more palatable compared to NaHCO3 and showed significant promise for dietary interventions. Hence we propose a mixed food + supplement diet can achieve a similar buffer load to that achieved with NaHCO3 alone.
Keywords: Tumor microenvironment; Buffering capacity; Acidbase; Sodium bicarbonate; pH
The microenvironment of solid tumors is acidic due to high rates of glucose fermentation combined with poor perfusion [1]. The over-production of lactic acid occurs even in the presence of oxygen, as first described by the Warburg almost a century ago. This increased acid load is removed from the cell cytoplasm by various proton transporting systems, such as monocarboxylate transporters, carbonic anhydrases in concert with anion exchangers, or sodium-hydrogen exchangers [2]. The activity of these transporters results in maintenance of a relatively alkaline intracellular pH (pHi) and an acidic extracellular pH (pHe). In solid tumors, pHe values as low as 6.5 have been measured [3]. It is axiomatic that cancer cells must adapt to these acidic conditions in order to survive and thrive, and we have proposed that that this acid generation provides cancer cells competitive advantage over normal surrounding tissue into which they invade [4-6].
Export of acid by solid tumors has been shown to degrade both the extracellular matrix and be toxic to normal tissue in the vicinity of the tumor. This destruction of surrounding tissue and re-modeling of the extracellular matrix provides the conditions necessary for local invasion and metastasis of tumor cells [7]. More recently, we and others have shown in vitro and in vivo that the acid pH of tumors is a potent inhibitor of adaptive and innate immune surveillance. Low pH inhibits effector CD8 T cell functions [8-10], and induces a change in macrophage polarity from anti-inflammatory (M1) to pro-inflammatory (M2) phenotypes [11].
Tumor acidity can be neutralized with oral buffers, reversing some of the sequelae of acidity, including local invasion, metastasis, and immune inhibition. For example, 200 mM ad lib sodium bicarbonate has been shown to neutralize tumor acidity, and inhibit in vivo invasion as well as spontaneous and experimental metastasis in a variety of systems [12-15] and to improve response to checkpoint blockade immune therapy [10]. In one study, it was shown that lysine free base was effective in inhibiting metastases if provided at a pH (10.4) above the amine pKa values, but was ineffective if provided at a pH (8.0) below the amine pKa values, which was interpreted as strong evidence that the effect is buffer-mediated [16]. In a mouse transgenic prostate cancer (TRAMP) system, addition of buffers at the time of weaning significantly delayed the onset of cancers, and prevented development of spontaneous metastases [17]. It is not known whether these effects are due to increased immune surveillance, but the tumors that do arise under buffer treatment are characterized as more benign by both histopathology and by immunocytochemistry. Further, if buffer therapy was initiated after the emergence of spontaneous cancers in this system, metastasis was significantly inhibited [18]. Hence, through a series of consistent studies by us and others, treatment of cancers with buffers, such as sodium bicarbonate (bicarb) is strong evidence in favor of clinical translation. Based on data from mice, and inter-species PK conversion, the target dose in humans would be 0.7 g/kg/d, or about 50 g/d for a 70 kg human [14]. In prior therapeutic trials, 21 grams per day (0.4 g/kg) were administered orally to children with Sickle Cell Anemia for one year without complication [19]. Complications from sodium bicarbonate administration are rare in the dose ranges proposed. Excessive bicarbonate ingestion places patients at risk for a variety of metabolic derangements including metabolic alkalosis, hypokalemia, hypernatremia, and even hypoxia [20]. The associated sodium load can increase blood pressure or cause congestive heart failure. Despite common use of sodium bicarbonate as an antacid and its general tolerability, compliance on previous clinical trials at H Lee Moffitt Cancer Center was low due to GI irritability, poor taste, or ingestion of too many capsules. We reason that dietary intake of highly buffered foods and supplements in addition to bicarbonate could provide a palatable and achievable alternative. As data are not widely available for buffering content of foods and supplements, we undertook to characterize a variety of whole foods, prepared foods, and supplements for their ability to substitute for bicarbonate. The data are expressed as a point scale, wherein 1 point is equivalent to 1 g of bicarbonate and examples are provided wherein the target of 0.7 g/kg/d can be achieved. Not surprisingly, buffer points are generally related to protein content, without regard to the metabolic fate and we have derived an analytical solution to predict buffering points based on protein content.
Sample preparation and Buffering power determination
Food sources were characterized based on hard anion (i.e. Na+ and K+) and protein content with a low concentration of sulfur-containing amino acids (Cys, Met). Food items were purchased directly from local grocery stores. Supplements were either purchased from health food stores, or were generous gifts from Sodexo for the Protein Shakes (Moffitt Food Service, Tampa FL); Dominic D’Agostino for the ketone supplements (Dept. Physiology Univ. South Florida, Tampa FL) and Holger Michels for the BasenPulver® (Pascoe Pharmazeutische Präparate GmbH Schiffenberger Weg 55,35394 Giessen, Germany). Food sources and supplements were purchased and stored in their raw or processed forms at room temperature until pH titrations were performed. Dry foods were finely ground and 1 g of the powder was suspended in 100 mL-deionized H2O (dH2O). For liquids, 100 mL was directly aliquoted and used for titration. Titration was performed using the EasyPlus Titrator (Mettler Toledo). Starting pH was documented and 10-100 uL increments of 1 N KOH were added to increase mixture solution to pH 10. Endpoint titration was accomplished with 1 NHCl until the final solution pH reached 4.00. During titration the solution was continually stirred using a magnetic stir bar and the EasyPlus Titrator magnetic stirrer.
Taste testing
To determine the palatability of supplements at different pHs, the purpose of this test was to establish the most tolerable alklaline starting pH, as a high pH is required for the buffer-mediated effect of the diet. The test was created using two distinguishable protein shake flavors (Sodexo) resuspended with different concentrations of potassium citrate to adjust pH. Ten individuals participated in this single-blind taste test. Each participant was given ten 15 mL samples of the shakes (5 of each flavor x 2 flavors), which were randomly distributed.
Supplementation through oral administration has been shown to neutralize the acidic microenvironment surrounding solid tumors. A decrease in the degree of tumor cell metastasis and local invasion to nearby tissues has been observed due to this neutralization effect in animal models [13]. The efforts at translating these to clinical trials were met with difficulty as the trials failed to accrue and achieve target endpoints. The ability to utilize foodstuffs and other supplements was then examined for their potential to provide alternatives to bicarbonate.
We thus proposed a patient-tailored diet based on the buffering power of various foodstuffs and supplements as an adjuvant to buffer therapy. Because the buffering powers of foods are rare in the literature, we commenced to tabulate the buffering capacities of common foodstuffs [16]. Each food item or edible variant (i.e. supplements, powders, etc.) has its own assigned buffering power. To initiate this study we were mindful of the “alkaline tide” phenomenon (Figure 1), wherein gastric acid is produced via carbonic anhydrase, which hydrates CO2 into HCO3- and H+, with subsequent transport of H+, into the gastric lumen via the type I H+K ATPAse, and transport of the HCO3- into the basolateral (blood) compartment via anion exchange. This bicarbonate is subsequently taken up by the pancreas where it alkalinizes pancreatic juice to neutralize gastric acidity. The resting duodenal pH is 4.0-4.4 [21]. Many foodstuffs are in this pH range and hence, their digestion does not result in a net change in acid-base balance. However, if foodstuffs had a higher pH and a large buffering capacity, their digestion would result in a net gain of serum HCO3-, equivalent to that realized with bicarbonate therapy. Thus, we performed endpoint titrations of NaHCO3-, other buffers and supplements, and foodstuffs to a pH of 4.0, and expressed the amount of H+ consumed relative to that of NaHCO3- (Figures 1 and 2). (Sodexo), two amino acids (lysine, arginine), and potassium citrate. Buffering capacity is calculated as the mmol titrant (HCl) required to reduce the pH to 4.0. Note that, while citrate and arginine have identical buffer capacities, citrate is most active between pH 6.5 and 4, whereas arginine has its highest buffering power between 8 and 10. Given the ambiguity of post-prandrial duodenal pH, arginine is therefore a more relevant buffer, if provided in its di-anion form. Because the buffering power of the shakes is predominantly from complex proteins, it has a broader range of buffering powers. Note also that the shakes cannot be compared directly to the supplements, as the serving sizes are different (Figure 2).

Figure 1: The alkaline tide phenomenon: Following nutrient ingestion, a ride in plasma pH is observed as gastric parietal cells secrete both HCl into the stomach and bicarbonate ions (HCO3-) across the basolateral membrane into the plasma. Subsequently, a temporary increase in plasma pH occurs.

Figure 2: Representative acid-base titrations of various food sources: Acid-base titrations were performed on various protein shakes provided by Sodexo, Inc. and supplements (Sigma Aldrich and Fischer). The initial pH was recorded and the titration was run until the solution reached a pH of 4 after addition of 1N HCl.
As buffering power is increased at higher starting pHs, we investigated if there is potential for increasing the initial pH of these shakes. Thus, a single blind taste test was performed to assess taste quality of a variety of protein shakes titrated to different pH levels (see methods). This showed that palatability did not begin to degrade until the pH was above 9.0. Although buffering can thus be improved by titrating suppleements to pH 9.0, for the remainder of this study, we report values based on the native pH of the food or supplement. We had previously generated a table of foodstuffs [16], and this has now been expanded and is provided in Supplemental Table S1. From these data, a point scale was generated, expressing the buffering power relative to that of 1 g of NaHCO3 (Equation 1).
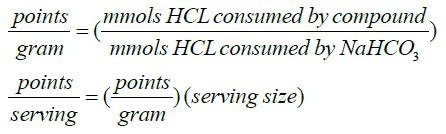 (1)
(1)
The proposed use of a diet based on a point system, wherein the points represent a food’s buffering power when compared to sodium bicarbonate, will allow the body to reach the same buffering effect as sodium bicarbonate alone. Table 1 presents some notable examples of points for Buffers, Supplements, and Foodstuffs, based on serving size. This is not a comprehensive list, however, so we investigated whether there were some guiding principles to infer points. As expected, when analyzing these data, a relationship between buffering capacity (points) and protein content became apparent. As shown in Figure 3, the relationship is not exact, but a linear regression shows that, for the most common foods and supplements, there are 11 ± 0.01 points per 100 grams of protein (r2 = 0.77; p = 9.6 x 10⁻⁷). Thus, in a therapeutic setting, 11 g of bicarbonate can be eliminated for every 100 g of protein ingested. It is also important to consider not only the direct effects of buffering, but also the metabolic fate of the protein. It is well known that sulfur in proteins (cysteine, methionine) is oxidized to sulfuric acid, which adds to the acid load [22]. Thus, sulfur-free (e.g. whey protein, pollock, turkey breast) or low sulfur proteins (e.g. nuts, peanuts, black beans, peanuts, cheese, soy) are often categorized as “non-acidifying” whereas high sulfur proteins (i.e. sesame and safflower flour, beef, and bison) are “acidifying”. A searchable list can be found at the USDA website: https://ndb.nal.usda.gov/ndb/. Using another metric, the pH of proteins is increased in the presence of hard cations, such as potassium, K+. Hence high protein foods with high K+ (e.g. black beans and soybeans, yellowtail and bluefish, whey, chicken, swiss, and provolone cheese) also have inherently higher buffering capacities.
| Start pH | Serv. size (g) | Pro (g)/ serv. | Points/ serv. | Start pH | Serv. size (g) | Pro (g)/ serv. | Points/ serv. | ||
|---|---|---|---|---|---|---|---|---|---|
| Buffers | Supplements - Powder | ||||||||
| Bicarbonate | 8.22 | 1 | 0 | 1 | VEGA One Shake | 7.55 | 38 | 20 | 3.1 |
| Tums | 9.72 | 1 | 0 | 6.1 | Solgar Whey to Go | 6.65 | 34 | 20 | 2.7 |
| Potassium Citrate | 8.06 | 1 | 0 | 0.4 | Blubonnet Protein | 6.38 | 33 | 26 | 2.8 |
| L-Lysine (free base) | 9.52 | 1 | 0 | 0.5 | BioChem Whey Protein | 6.51 | 25 | 22 | 2.2 |
| Basenpulver | 8.66 | 8 | 0 | 12.9 | Raw Fit Protein | 6.96 | 42 | 26 | 2.1 |
| Supplements - Liquid | Kegenix Prime-Lemon Twist | 5.03 | 40.8 | 1 | 5.1 | ||||
| Ensure Vanilla Shake | 6.68 | 237 | 9 | 5.2 | KETO//OS-Orange Dream | 5.56 | 22.3 | 1 | 3.8 |
| Chocolate Shake | 6.35 | 354 | 9 | 4.2 | KETO//OS Max-Maui Punch | 5.27 | 18.4 | 0 | 2.4 |
| Orange Surprise Shake | 4.55 | 354 | 9 | 1.6 | Foodstuffs-Solid | ||||
| Foodstuffs - Liquid | Lentils | 6.69 | 100 | 9 | 7.2 | ||||
| Low Fat Milk | 6.64 | 236 | 8 | 1.4 | Quinoa | 6.47 | 185 | 8 | 3.2 |
| Whole Milk | 6.63 | 236 | 7.3 | 1.0 | Tuna | 5.92 | 85 | 25 | 1.7 |
| Greek Plain Yogurt | 4 | 200 | 20 | 0.6 | White chicken breast | 6.05 | 86 | 27 | 1.1 |
| Beer | 4.48 | 354 | 1.6 | 0.1 | Swiss Cheese | 5.83 | 28.3 | 8 | 0.7 |
| Orange Juice | 4.11 | 243 | 0 | 0 | Cantaloupe | 6.71 | 280 | 2.3 | 0.4 |
| Red wine | 3.62 | 147 | 0.1 | -0.1 | Watermelon | 5.41 | 280 | 1.7 | 0.3 |
| Soda | 3.6 | 368 | 0 | -0.1 | Egg (whole, fresh) | 7.31 | 55 | 6 | 0.4 |
| Apple Juice | 3.75 | 243 | 0 | -0.2 | Carrots | 6.33 | 100 | 0.9 | 0.2 |
| White wine | 3.42 | 147 | 0.1 | -0.3 | Banana | 4.78 | 118 | 1.3 | 0.2 |
| Brussel Sprout | 6.7 | 88 | 3 | 0.2 | |||||
| Nectarine | 4.03 | 142 | 1.4 | 0 |
Table 1: Buffer Points for Selected Items: Food sources and supplements were selected based upon hard anion and protein content (low sulfur concentration). The initial pH value recorded before acid-base titration, serving size of source (grams), protein content of source (grams), and calculated buffer points per serving are listed.

Figure 3: Relating buffering capacity and protein content: The buffering capacity, as measured in points per gram of the most common nutritional sources and the protein content in milligrams per gram of the same nutritional source in question were analyzed using the linear regression model. The relationship between these variables strongly approximates that there are 11 ± 0.01 points per 100 grams of protein (r2 = 0.77; p = 9.6 x 10⁻⁷).
The point system
Sodium bicarbonate remains the standard for buffer therapy due to its innate ability as a highly active buffer. As mentioned previously, bicarbonate alone is inadequate as a buffer therapy. For this reason, the buffer points-based diet was created, wherein 1 point is equivalent to 1 g of bicarbonate. Supplementation of an alkalizing diet is expected to generate the same compensated metabolic alkalosis observed in bicarbonate-only supplementation. We reason that 50 points/day is thus equivalent to 50 g of bicarbonate/day. Based on Table 2, an achievable diet to consume 50 g/d is feasible through a mixture of foodstuffs and supplements.
| grams | points | total pts | calories | Total cals | |
|---|---|---|---|---|---|
| 2 eggs | 110 | 1 | 1 | 157 | 157 |
| 1 cup Nonfat Milk | 245 | 3.4 | 4.4 | 83 | 240 |
| 3 slices Bacon | 24.3 | 1.7 | 6.1 | 132 | 372 |
| Basenpulver | 8.0 | 13 | 19.1 | 0 | 372 |
| VegaOne Protein Shake | 38.0 | 3 | 22.1 | 137 | 509 |
| Tums x 3 | 7.77 | 4.2 | 26.3 | 30 | 539 |
| Tuna | 165 | 1.1 | 27.4 | 304 | 843 |
| Yogurt | 245 | 0.7 | 28.1 | 234 | 1077 |
| Tumsx3 | 7.77 | 4.2 | 32.3 | 30 | 1107 |
| White Chicken Breast | 125 | 1.10 | 33.4 | 206 | 1313 |
| Quinoa | 100 | 3.7 | 37.1 | 374 | 1687 |
| VegaOne Protein Shake |
38.0 | 3 | 40.1 | 137 | 1824 |
| Basenpulver | 8.0 | 13 | 53.1 | 0 | 1824 |
Table 2: Example Buffer Diet: An example alkalizing buffer diet is given with a total daily caloric intake of 1824 calories. The example diet serves as a guide to reach 50 buffer points as needed per day for a 70-kilogram adult. 50 buffer points equates to 50 grams of sodium bicarbonate with regards to the compensated metabolic alkalosis effect observed in vivo with sodium bicarbonate supplementation.
Because of taste, GI, and edema, none of the trials of oral NaHCO3 were able to successfully dose escalate. Hence, we conclude that sodium bicarbonate buffer monotherapy is not clinically viable. It is possible that, if it were coupled to another treatment with the intent of increasing effectiveness, that patients might be motivated to follow through on buffer therapy. Such possibilities include immune checkpoint blockade, wherein buffer therapy in mice increased response rates up to 3-fold [10] or weakly basic chemotherapeutics as described in previous work [23-26].
Nonetheless, even with a buffer therapy, western diets are typically characterized as “acidifying”, which would counteract the beneficial effects of buffer therapy. The proposed diet to mitigate this insufficiency aims to utilize buffering food sources containing high protein content (with low sulfur concentration) and hard anions (K+) as well as other supplements (such as flavored CaCO3 or Basenpulver®) with the ultimate goal of reaching the same buffering effect provided by sodium bicarbonate. Protein sources with sulfur-containing amino acids (cysteine & methionine) are metabolized via oxidation to sulfuric acid. This oxidation to sulfuric acid increases acidity content resulting in a net decrease in buffering power value [22]. From this, we hypothesize that a diet consisting of high protein intake with a low ratio of sulfur-containing amino acids will result in an additive affect to the overall buffer power value. Specifically, a diet utilizing protein sources as low as 10 g protein per 100 g of food source is recommended if the food source contains low sulfur content. However, if the protein source contains sulfur in the form of methionine or cysteine, it is advised that consumption of protein content within food sources be raised to 15 g protein per 100 g of food source or higher. The reasoning behind this protein content cutoff is to prevent a reduction of the desired net compensated metabolic alkalosis effect, which would occur due to metabolism of high ratios of sulfur containing protein sources. Notably, diets cannot be sulfur free. Methionine is an essential amino acid, meaning is cannot be synthesized by humans, and the USDA recommended daily allowance is 1.2 g/d. Sulfur is also required with a daily intake of 0.8 g/d sufficient for normal needs.
A common metric used to measure the acidity generated by food sources is to quantify the potential renal acid load, or PRAL, of a given source. The PRAL of foods is predicted based upon the hard anion, cation, and protein composition of the source. Based on urine pH measurements in previous studies, the protein/K+ ratio was used as an indicator to provide a net-acid producing effect [27]. However, these measurements were based upon protein sources with high sulfur concentrations, which contribute to overall acid production when metabolized. Urine pH and PRAL of food sources is different from the goal of the buffer diet. The buffer diet is used to induce compensated metabolic alkalosis through the use of net-alkali generating sources to buffer the tumor pH while leaving systemic pH values unchanged. In compensated metabolic alkalosis, blood bicarbonate levels will increase based on the rate of bicarbonate reabsorption in the kidneys as H+ is excreted [28] and this will increase the pH of the extracellular environment surrounding tumors [29].
In understanding the buffering power from these food sources, it is imperative to discuss a few pH metabolic regulatory mechanisms that occur during digestion. The alkaline tide is a postprandial physiological response leading to a temporary increase in plasma pH. The resultant increase in pH occurs through parietal cell secretion of bicarbonate ions (hydration of CO2) across the basolateral membrane into the blood, during hydrochloric acid secretion into the stomach [30]. The low pH of the stomach remains ~2.0 for optimal enzymatic activity of pepsin [31]. The proximal duodenal pH fluctuates between 4.0-4.5 depending on the presence or absence of food, whereas the distal duodenal pH remains between 5.0-6.0 [32]. It is important to note that the pancreas plays a role in acid-base balance through intraluminal secretion of bicarbonate into the proximal duodenum via the common bile duct [33]. The pH gradient established between the distal and proximal portions of the duodenum can be as high as 2 pH units. The buffering power of each food source was assessed based on the amount of protons consumed to reach 4.0 (proximal duodenal pH). The buffer diet serves to generate a net-alkalizing effect. The influx of alkali generating sources into the stomach is a net accumulation of base via acid depletion. The body compensates for this base accumulation through physiological process resulting in compensation of the metabolic alkalosis and thus a buffer diet serves to achieve and maintain a steady state of compensated metabolic alkalosis.
Notably, the average starting pH for the protein supplements was 6.58 (range = 4.55-7.55). The starting pH for foodstuffs with positive buffering was 6.03 (range = 4.78-7.31). In practice, the pH of prepared foods could be increased up to 9.0 with addition of alkali, with no discernable reduction in taste. Thus, supplements can be developed that have a palatable starting alkaline pH to maximize the buffering power value of the food sources which would serve as an adjuvant for buffer therapy.