Journal of Nutrition & Food Sciences
Open Access
ISSN: 2155-9600
ISSN: 2155-9600
Research Article - (2016) Volume 6, Issue 4
Purpose: More people suffer and die from malnutrition than foodborne illness. Therefore, it is important that models that predict the risk of foodborne illness provide reliable predictions so that safe food that could benefit public health by combating malnutrition is not labelled as unsafe. In the current study, a process risk model (PRM) for Salmonella and chicken parts was developed and validated and shown to provide reliable predictions of the risk of foodborne illness.
Materials and method: The PRM was developed in an Excel spreadsheet and was simulated with @Risk. It consisted of four unit operations (pathogen events): 1) Preparation (contamination); 2) Cooking (death); 3) Serving (cross-contamination); and 4) Consumption (dose-response). Data for model development were acquired by whole sample enrichment, real-time polymerase chain reaction (WSE-qPCR).
Results: Salmonella prevalence on raw chicken parts at meal preparation as determined by WSE-qPCR was 15.6% (25/160) whereas incidence of Salmonella cross-contamination of cooked chicken during serving was 12.5% (5/40). Six serotypes of Salmonella were isolated with most (83%; 25/30) being high risk serotypes Typhimurium and Typhimurium var 5-. Mean number of Salmonella on raw chicken parts was 0.36 log (range: 0-0.93 log) whereas mean number of Salmonella that cross-contaminated cooked chicken was 0.36 log (range: 0.13-0.67 log). Predictions of the PRM were validated against outbreak data. Sensitivity and scenario analyses indicated that the primary risk scenario for salmonellosis was cross-contamination of cooked chicken with a high risk serotype of Salmonella during serving.
Conclusion: Reduction of high risk Salmonella o n chicken during production and processing and consumer education to reduce the incidence of cross-contamination during serving are interventions that could reduce this important risk to public health.
Keywords: Chicken parts; Process risk model; Salmonella ; Serotype; Whole sample enrichment; Polymerase chain reaction
Salmonella are gram-negative, rod-shaped bacteria that are facultative anaerobes and are found in soil, water, insects, plants, animals, and humans. They cause disease in both animals and humans [1,2]. Based on differences in somatic O and flagellar H antigens there are over 2,500 serotypes of Salmonella [3,4]. However, most cases of human salmonellosis are attributed to a small group of Salmonella serotypes [5].
Human feeding trials indicate that there are differences in virulence among Salmonella serotypes [6,7]. For example, the dose of Salmonella that causes 50% of healthy male subjects to become ill is 5.93 log for serotype Anatum I and 9.67 log for serotype Pullorum I [8]. In addition, growth of Salmonella on chicken meat during temperature abuse, an important risk factor, differs among serotypes [9,10]. However, from a regulatory perspective, differences in risk among Salmonella serotypes are not considered when the safety of chicken is evaluated.
Although the number of Salmonella on chicken is usually low (<30 per carcass) [11-15] and chicken is often cooked thoroughly before consumption [16,17], chicken is considered an important source of human salmonellosis [18,19]. Perhaps it is because Salmonella on raw chicken can contaminate utensils used to serve cooked chicken and other ready-to-eat (RTE) food resulting in cross-contamination [12,20-25], consumer exposure, and salmonellosis.
Process risk models (PRM) predict consumer exposure and response to pathogens on and in food produced by specific scenarios [26-30]. This emerging technology holds great promise for improving our ability to identify batches of food that pose a higher risk of foodborne illness outbreaks. In addition, PRM can be used to identify risk factors that can be targeted to mitigate this risk to public health [26,30].
More people suffer and die from malnutrition than foodborne illness. Thus, it is important that PRM provide reliable predictions of risk so that safe food is not labelled as unsafe. Unnecessary condemnation of safe food harms public health by increasing suffering and death from malnutrition.
Although PRM exist for Salmonella and chicken [27-29,31], there are no PRM for Salmonella and chicken parts. In addition, existing PRM for Salmonella do not consider differences in risk among serotypes in their assessment of chicken safety. Consequently, the present study was undertaken to develop a PRM for Salmonella and chicken parts that considers differences in risk among serotypes in its prediction of salmonellosis outbreaks.
A novel aspect of this study was that contamination and crosscontamination data for development of the PRM were obtained by whole sample enrichment, real-time polymerase chain reaction (WSEqPCR). This method has been used to enumerate Salmonella on chicken parts [12], pork [32], eggs [33], and feed [34] and Campylobacter on chicken [35]. The lower limit of detection of WSEqPCR is one Salmonella cell per chicken part [12].
Salmonella enterica serotypes Typhimurium var 5- and Kentucky, which were isolated from chicken parts in Oscar [25], were used to develop the standard curve for enumeration of Salmonella by whole sample enrichment, real-time polymerase chain reaction (WSE-qPCR). Stock cultures of these two serotypes were maintained at -80°C in brain heart infusion broth (BBL™, Becton, Dickinson, and Company, Sparks, MD, USA) that contained 15% (volume/volume) glycerol (Sigma Chemical Company, St. Louis, MO, USA).
Source of chickens
Whole, ready-to-cook broiler chickens (n=26) packaged in flow pack wrappers and of the same brand and processing plant were obtained from a local retail store (Princess Anne, MD, USA) between May 15, 2012 and February 26, 2013. They weighed 1,995 ± 193 g (mean ± SD). After purchase they were transported to the laboratory (ca. 15 min) and stored for ca. 6 h at 4°C before harvesting of chicken parts.
Harvesting of raw chicken parts
A sterilized knife and cutting board were used to harvest two wings, two boneless breasts, two thighs, and two drumsticks from each whole raw chicken; the remaining portion (shell) was discarded. The unwashed cutting board, knife, and latex gloves were then used to partition a cooked chicken breast into two parts, which were then used to swab the cutting board. This was done to acquire data for crosscontamination of cooked chicken with Salmonella from utensils used to process the whole raw chicken into parts under a worst-case scenario. However, this worst-case scenario was not simulated as explained below.
The current study consisted of 26 whole raw chickens from which 208 raw chicken parts (52 wings, 52 breasts, 52 thighs, and 52 drumsticks) were harvested. Forty-eight of these raw chicken parts (12 of each type) were inoculated with Salmonella and used for standard curve development by WSE-qPCR. The remaining 160 raw chicken parts (40 of each type) were used to acquire data (initial contamination) by WSE-qPCR for model development.
Cooked chicken
Chicken breast fillets (n=26) were purchased from a local retail store, transported to the laboratory, individually wrapped in aluminum foil, and then cooked in a tabletop autoclave (BioClave, Biomega Research Products, Edison, NJ, USA) for 15 min at 121°C. They were stored at 6°C until used in experiments. A total of 52 cooked chicken parts were used: 12 were inoculated with Salmonella for standard curve development by WSE-qPCR whereas 40 were used to acquire data (cross-contamination) by WSE-qPCR for model development.
Inoculum culture
Five μl of stock culture of Salmonella Typhimurium var 5- or Salmonella Kentucky were added to 9 ml of buffered peptone water (BPW; Difco™, Becton Dickinson) in a 16 × 125 mm glass dilution tube with cap. Inoculated BPW was incubated for 72 h at 22°C and 0 rpm to obtain stationary phase cells for inoculation of chicken parts in the standard curve experiments.
The concentrations of Salmonella Typhimurium var 5- (8.73 ± 0.03 log/ml; mean ±SD; n=3) or Salmonella Kentucky (8.69 ± 0.02 log/ml; mean ±SD; n=3) in the 72-h cultures were determined by spiral plating (Whitley Automated Spiral Plater, Microbiology International, Frederick, MD, USA) 50 μl of the 10-5 and 10-6 dilutions in BPW onto xylose lysine tergitol 4 (XLT4) agar (Difco™, Becton Dickinson). Spiral plates were incubated for 24 h at 40°C before automated counting of colonies (ProtoCol Automated Colony Counter, Microbiology International).
Concentrations of Salmonella in the 72 h cultures were used to calculate the doses inoculated onto chicken parts in standard curve experiments. One exception was the lowest dose (5 μl of the 10-7 dilution). Here, the dose inoculated was based on results of a drop plate assay, which is described below.
Inoculation of chicken parts
Stationary phase cultures of Salmonella Typhimurium var 5- or Kentucky were serially diluted (1:10) in BPW. Chicken parts were inoculated with 5 μl of the 10-3, 10-4, 10-5, 10-6, or 10-7 dilutions. Inoculated chicken parts were held at ca. 22°C for 30 min to allow attachment of Salmonella before transfer to 177×304 mm plastic stomacher bags (Seward, London, UK).
In the first two runs of the standard curve experiment, where a run consisted of eight raw chicken parts (two wings, two boneless breasts, two thighs, and two drumsticks) and two cooked chicken breast parts, with either serotype, the 10-3, 10-4, 10-5, and 10-6 dilutions were inoculated once per type of raw chicken part whereas the 10-7 dilution was only inoculated onto the cooked chicken parts. In the third run with each serotype, the 10-7 dilution was inoculated onto all chicken parts (raw and cooked).
Before inoculation, the cooked chicken parts were used to swab the unwashed cutting board used to harvest raw chicken parts from the whole chicken. Therefore, the cooked chicken parts were contaminated with native microflora from the raw chicken. Consequently, Salmonella inoculated onto cooked chicken parts in standard curve experiments experienced similar microbial competition as Salmonella inoculated onto raw chicken parts.
Within and across runs of the standard curve experiment there was no replication of the serotype by dose by type of chicken part combination except for the lowest dose and cooked chicken. However, type of chicken part does not affect CT values or other similar metrics used in these types of standard curve experiments [12,25,36].
To determine the number of Salmonella inoculated when 5 μl of the 10-7 dilution (ca. 1.7 log/ml or 0.25 cells per 5 μl) of the cultures was used, the inoculation procedure was simulated by dropping a series of 13, 5 μl drops onto XLT4 agar during each run (n=6) of the standard curve experiment. After incubation of drop plates for 16 h at 40°C, the number of colonies per drop was manually counted.
Incubation of chicken parts
In all runs, 400 ml of cold (6°C) BPW was added to chicken parts followed by incubation in two stages: 1) 12 h at 6°C and 0 rpm; and 2) 10 h at 40°C and 80 rpm. Programmable, refrigerated, orbital shaking incubators (Innova 42, New Brunswick, Edison, NJ, USA) were used that allowed stage two to begin at night so that samples could be collected the next day during normal working hours.
Sample collection
After incubation of chicken parts, one ml of whole sample enrichment (WSE) was collected into a 1.5 ml micro-centrifuge tube (sample A) and a one ml sample of WSE was collected into a dilution tube with nine ml of BPW (sample B). Samples A were used for Salmonella enumeration by real-time polymerase chain reaction (qPCR) whereas samples B were used for cultural isolation of Salmonella .
Salmonella enumeration
An AOAC International-approved qPCR kit (iQ-Check Salmonella II, Bio-Rad, Hercules, CA, USA) was used to analyze samples A for Salmonella [37]. Sample preparation and qPCR, which included internal standards and positive and negative controls, were performed as described in Oscar [12]. A cycle threshold (CT) value, which was the qPCR cycle where Salmonella was first detected, was obtained for positive samples.
The samples for qPCR were collected after incubation of chicken parts in 400 ml of BPW for 12 h at 6°C and 10 h at 40°C. The lower limit of detection of the qPCR assay is ca. 1,000 cells of Salmonella per ml. Dead cells of Salmonella on the chicken part do not multiply during WSE. Thus, there would have to be about 400,000 dead cells of Salmonella (1,000 cell/ml*400 ml) on the chicken part for them to be detected by qPCR. Thus, it was unlikely that dead cells were detected by WSE-qPCR, which is a growth-based assay.
Endogenous Salmonella , if present, on Salmonella -inoculated chicken parts would decrease the CT value, shift the standard curve downward, and cause an underestimation of Salmonella number. To alleviate this possibility, the maximum CT value for each inoculated dose of Salmonella were identified and used to develop the standard curve:
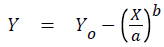
where Y was the predicted CT value at dose X (log/part), Yo was the maximum CT value at zero log per part, a was a regression coefficient, and b was a shape parameter.
Standard curve fitting was accomplished with Prism (version 6, GraphPad Software, San Diego, CA, USA). The interpolation function of Prism was used to convert CT values into log number of Salmonella per chicken part. Alternatively, a horizontal straight line can be drawn from the Y-axis (CT) to the standard curve and then a vertical line can be drawn from the point of intersection of those lines to the X-axis (log/part) to convert the CT value into the log number of Salmonella per part.
Salmonella isolation
Salmonella were isolated from chicken parts as described in [12]. In brief, samples B were preenriched in BPW for 24 h at 40°C followed by selective enrichment in Rappaport Vassiliadis R10 (RV; Difco™, BD) broth for 24 h at 42°C followed by selective plating onto XLT4 agar for 24 h at 40°C. Isolates (one per chicken part) were confirmed as Salmonella by an AOAC International-approved lateral flow assay (Reveal 2.0 Salmonella , Neogen, Lansing, MI, USA) and then were identified by serotyping by a Salmonella Reference Laboratory (National Veterinary Services Laboratory, U.S. Department of Agriculture, Ames, IA, USA).
Chicken parts from the same whole chicken can be contaminated with multiple serotypes of Salmonella [38]. However, only one isolate was characterized per chicken part due to cost and to simplify sample processing and tracking.
Process risk model (PRM)
A published PRM for Salmonella and whole chickens that was validated against epidemiological data [27] was modified and used to predict the risk of salmonellosis (cases/100,000) from chicken parts. The original PRM had five unit operations (pathogen events): 1) Retail (contamination); 2) Transport (growth); 3) Cooking (death); 4) Serving (cross-contamination); and 5) Consumption (dose-response). However, because WSE-qPCR was applied after transport in the present study, the modified PRM (Figure 1) only had four unit operations (pathogen events): 1) Preparation (contamination); 2) Cooking (death); 3) Serving (cross-contamination); and 4) Consumption (dose-response).

Figure 1: Process risk model (PRM) for Salmonella and chicken parts. Results for a single chicken part are shown.
A rare events modeling approach used in previous studies [26,27,39-41] was used to simulate pathogen events. In brief, a discrete distribution for incidence of the pathogen event was linked to a pert distribution for extent of the pathogen event and only when the pathogen event occurred was the output from the pert distribution used to calculate results (Table 1).
| Node | Unit Operation | Pathogen Event | Column | Cell Address | Scenario | Formula |
|---|---|---|---|---|---|---|
| 1 | Preparation | Contamination | Output | D2 | A,B,C,D | IF(E2=0,0,Round(Power(10,F2),0)) |
| Incidence | E2 | A,C | RiskDiscrete({0,1,2},{135,4,21}) | |||
| B,D | RiskDiscrete({0,1,2},{135,21,4}) | |||||
| E | RiskDiscrete({0,1,2},{0,4,21}) | |||||
| Extent | F2 | A,B,C,D | RiskPert(0,0.36,0.93) | |||
| Serotype | G2 | A,B,C,D | IF(D2=0,0,E2) | |||
| 2 | Cooking | Death | Output | D3 | A,B,C,D | Round(Power(10,F3)*D2,0) |
| Extent | F3 | A,B,C,D | RiskPert(-96,-8.1,-0.83) | |||
| Serotype | G3 | A,B,C,D | IF(D3=0,0,E2) | |||
| 3 | Serving | Cross-contamination | Output | D4 | A,B,C,D | IF(E4=0,0,Round(Power(10,F4),0)) |
| Incidence | E4 | A | RiskDiscrete({0,1,2},{138,1,4}) | |||
| B | RiskDiscrete({0,1,2},{138,4,1}) | |||||
| C | RiskDiscrete({0,1,2},{230,1,4}) | |||||
| D | RiskDiscrete({0,1,2},{230,4,1}) | |||||
| E | RiskDiscrete({0,1,2},{0,1,4}) | |||||
| Extent | F4 | A,B,C,D | RiskPert(0.13,0.36,0.67) | |||
| Serotype | G4 | A,B,C,D | IF(D3=0,E4,E2) | |||
| 4 | Consumption | Dose | Output | D5 | A,B,C,D | Sum(D3:D4) |
| Illness Dose | Output | D6 | A,B,C,D | ROUND(POWER(10,IF(G4=2,F6,F7)),0) | ||
| Extent | F6 | A,B,C,D | RiskPert(0,2,6) | |||
| Response | Output | D7 | A,B,C,D | RiskOutput()+IF(D5 |
||
| E | RiskOutput()+IF(D5>D6,1,D5/D6) | |||||
| Extent | F7 | A,B,C,D | RiskPert(1,3,7) |
Table 1: Formula used in the process risk model for Salmonella and chicken parts: five scenarios.
In the rare events modeling method [26,27,39-41], the center point of the pert distribution is defined using either the mean or median value of the input data. Consequently, the pert distribution resembles a normal distribution or a log normal distribution that is skewed to the right or left depending on the distance between the center point and the minimum and maximum values. The pert distribution (minimum, mean, maximum) is a user-friendly distribution that can be easily defined. Consequently, it was used throughout to facilitate future use of the PRM by the chicken industry.
In the original PRM [27], fractions of Salmonella were converted to whole numbers by rounding down whereas in the modified version of the PRM (Figure 1) fractions of Salmonella were converted to whole numbers by rounding to the nearest whole number (Table 1). This resulted in slightly more Salmonella surviving cooking and slightly greater Salmonella contamination and cross-contamination of chicken parts because fractions greater than 0.5 were rounded up instead of down. Fractions ≤ 0.5 were not rounded up because this would result in no reduction of Salmonella prevalence during cooking, which is not what occurs [27].
To simulate differences in risk among Salmonella serotypes and to convert the original PRM for whole chickens [27] to chicken parts, a few modifications were made. First, although it would have been possible to simulate individual serotypes, differences in risk among Salmonella serotypes were modeled by assigning them to one of two groups: normal risk or high risk. This was done to simplify presentation of results. For purposes of this study, it was assumed that the top five human clinical isolates of Salmonella in the United States in 2012 [5], which were serotypes Enteritidis, Typhimurium/ Typhimurium var 5-, Newport, Javiana, and 4,[5],12:i:-, were high risk whereas all others were normal risk.
The second modification was that data (Tables 2 and 3) acquired by WSE-qPCR for chicken parts were used to define discrete and pert distributions (Table 1) in nodes 1 and 3 (Figure 1). The third modification was that the effect of serotype was simulated in nodes 1 and 3 by using discrete distributions with three rather than two outcomes where 0 was none, 1 was normal risk, and 2 was high risk (Table 1). Specifically, the discrete distribution for initial contamination of raw chicken parts (n=160) in node 1 was: none=135, normal risk=4 (Table 2), and high risk=21 (Table 2) whereas the discrete distribution for cross-contamination of cooked chicken (n=40) in node 3 after adjustment for consumer behavior, as explained below, was: none=138 (adjusted from 35); normal risk=1 (Table 3); and high risk=4 (Table 3).
| Date | Chicken | Part | Side | Weight (g) | Serotype | Risk | CT | Log | Antilog |
|---|---|---|---|---|---|---|---|---|---|
| 06-05-2012 | 1 | Wing | Left | 86 | Typhimuriumvar 5- | High | 28.18 | 0.912 | 8 |
| 06-05-2012 | 1 | Thigh | Left | 147 | Typhimuriumvar 5- | High | 32.65 | 0.247 | 2 |
| 06-05-2012 | 1 | Wing | Right | 86 | Typhimuriumvar 5- | High | 31.05 | 0.435 | 3 |
| 06-05-2012 | 1 | Breast | Right | 269 | Typhimurium | High | 31.89 | 0.329 | 2 |
| 06-05-2012 | 1 | Thigh | Right | 163 | Typhimuriumvar 5- | High | 29.18 | 0.726 | 5 |
| 06-05-2012 | 1 | Drumstick | Right | 118 | Typhimurium | High | 33.66 | 0.156 | 1 |
| 06-12-2012 | 2 | Thigh | Left | 161 | Typhimurium | High | 32.31 | 0.282 | 2 |
| 06-12-2012 | 2 | Breast | Right | 225 | Typhimuriumvar 5- | High | 28.21 | 0.906 | 8 |
| 07-10-2012 | 5 | Breast | Left | 285 | Typhimurium | High | 35.59 | 0.041 | 1 |
| 9/18/2012 | 10 | Breast | Left | 278 | Typhimuriumvar 5- | High | 37.05 | 0.004 | 1 |
| 9/18/2012 | 10 | Thigh | Left | 136 | Typhimuriumvar 5- | High | 34.78 | 0.08 | 1 |
| 11/27/2012 | 12 | Wing | Left | 85 | Thompson | Normal | 30.95 | 0.449 | 3 |
| 11/27/2012 | 12 | Breast | Left | 280 | Thompson | Normal | 31.88 | 0.33 | 2 |
| 11/27/2012 | 12 | Drumstick | Left | 109 | Typhimuriumvar 5- | High | 35.19 | 0.059 | 1 |
| 11/27/2012 | 12 | Breast | Right | 282 | Typhimuriumvar 5- | High | 31.39 | 0.39 | 2 |
| 11/27/2012 | 12 | Drumstick | Right | 113 | Typhimuriumvar 5- | High | 35.63 | 0.04 | 1 |
| 12-04-2012 | 13 | Wing | Left | 92 | Typhimuriumvar 5- | High | 37.09 | 0.003 | 1 |
| 12-04-2012 | 13 | Wing | Right | 92 | Typhimuriumvar 5- | High | 28.1 | 0.928 | 8 |
| 12-04-2012 | 13 | Breast | Right | 262 | Typhimuriumvar 5- | High | 30.2 | 0.558 | 4 |
| 12-11-2012 | 14 | Breast | Left | 302 | Typhimuriumvar 5- | High | 32.26 | 0.288 | 2 |
| 12-11-2012 | 14 | Drumstick | Left | 96 | 4,12:Nonmotile | Normal | 32.46 | 0.266 | 2 |
| 1/15/2013 | 16 | Wing | Left | 87 | 8,20:-:z6 | Normal | 28.51 | 0.848 | 7 |
| 1/15/2013 | 16 | Breast | Left | 279 | Typhimuriumvar 5- | High | 31.07 | 0.432 | 3 |
| 1/15/2013 | 16 | Breast | Right | 251 | Typhimuriumvar 5- | High | 32 | 0.317 | 2 |
| 1/29/2013 | 17 | Breast | Left | 222 | Typhimuriumvar 5- | High | 37.63 | 0 | 1 |
Table 2: Distribution of Salmonella contamination on raw chicken parts at preparation: natural contamination.
| Date | Chicken | Weight (g) | Serotype | Risk | CT | Log | Antilog |
|---|---|---|---|---|---|---|---|
| 06-05-2012 | 1 | 134 | Typhimurium | High | 30.11 | 0.572 | 4 |
| 7/19/2012 | 6 | 73 | Typhimuriumvar 5- | High | 32.74 | 0.238 | 2 |
| 11/27/2012 | 12 | 65 | Typhimuriumvar 5- | High | 33.48 | 0.17 | 1 |
| 12-04-2012 | 13 | 67 | 6,7:k:- | Normal | 29.52 | 0.667 | 5 |
| 12-04-2012 | 13 | 72 | Typhimuriumvar 5- | High | 34.02 | 0.129 | 1 |
Table 3: Distribution of Salmonella cross-contamination of cooked chicken breast parts during serving.
The pert distribution for cooking (death) (Table 1) was not modified from the original PRM [27]. A thermal inactivation model for Salmonella and chicken [42] and temperature data for cooked poultry [43] were used together to obtain the minimum, mean, and maximum log reduction values for this pert distribution (Table 1). No discrete distribution was used to simulate cooking because it was assumed that cooking was not a rare event. In other words, it occurred 100% of the time.
Incidence of cross-contamination during serving was adjusted away from the worst-case scenario by accounting for how often consumers actually use unwashed utensils to serve ready-to-eat (RTE) food. In the original PRM [27] it was assumed that consumers used unwashed utensils 28% of the time to serve RTE food. This assumption was based on published consumer surveys that are summarized in Oscar [27]. These surveys indicate that consumers use unwashed utensils 17-33% of the time to serve RTE food. Thus, the incidence of crosscontamination was adjusted by this amount. For example, if the WSEqPCR data indicated that the incidence of cross-contamination was 10% for the worst-case scenario, then the adjusted incidence of crosscontamination was 2.8%=10%*28%.
The consumption (dose-response) node in the original PRM [27] was modified as follows: the existing pert distribution for illness dose (1, 3, 7 log), which was based on a summary of published studies in [27], was assigned to the normal risk Salmonella serotypes and then a new pert distribution for illness dose (0, 2, 6 log), which was shifted down 1 log, was used to simulate the high risk serotypes (Table 1). Second, in the original PRM [27], dose-response was a probability of illness from 0 to 1 and was equal to the ratio of dose consumed to illness dose. In the current PRM, dose-response was a discrete event: Illness or no illness. Thus, if the dose consumed was greater than or equal to the illness dose an illness occurred; otherwise, no illness occurred (Table 1).
Simulation of the process risk model
The PRM for Salmonella and chicken parts was simulated with @Risk (version 6.3.1, Palisade Corp., Ithaca, NY, USA) settings of Latin Hypercube sampling, Mersenne Twister, 100,000 iterations (iteration=one chicken part=one serving=one consumer), and 500 simulations. The number of iterations per simulation (100,000) was based on a desire to make a direct prediction of the risk of salmonellosis per 100,000 consumers, which is a common public health metric used in the United States. Although the scenario simulated in the original version of the PRM [27] was consistent with epidemiological data, it is not expected nor necessary that the scenario simulated with the modified version of the PRM be consistent with epidemiological data because it simulates a single batch of chicken and not all batches of chicken, which would be used in epidemiological investigations. Rather, the current PRM is more likely, as shown later, to provide predictions that are consistent with outbreak data. In other words, the current PRM is designed to predict the risk and extent of an outbreak from a single batch of chicken.
A different random number generator seed (RNGS) was used for each of the 500 simulations of the PRM. The RNGS were randomly selected by @Risk. This was done to assess the variability and uncertainty of the PRM predictions of risk due to the rare, random, variable, and uncertain nature of pathogen events in the risk pathway. Results (cases per 100,000 chicken parts) of these simulations (n=500) were fitted to an array of probability distributions using the BestFit program within @Risk. The Chi-square statistic was used to identify the best-fitting distribution.
Sensitivity analysis of Scenario A was used to identify risk factors using Spearman’s rank correlation coefficients (ρ). Three additional ‘what if ’ scenarios (B to D; Table 1) were simulated to verify the sensitivity analysis. Scenarios were compared by one-way analysis of variance (ANOVA) using Prism and when a significant effect (P<0.05) was observed, means were compared using Tukey’s multiple comparison test at P<0.05.
To compare predictions to outbreak data, the average dose consumed and attack rates were obtained from simulation of the PRM and then they were graphically compared to outbreak data summarized in Teunis et al [44]. Attack rate was calculated as the number of cases of salmonellosis divided by the number of exposures per 100,000 chicken parts.
The average number of Salmonella Typhimurium var 5- in the 10-7 dilution of the 72-h culture was 0.28 cells per 5 μl drop (frequency distribution: 30=0 cells per drop, 8=1 cell per drop, and 1=3 cells per drop). Likewise, the average number of Salmonella Kentucky in the 10-7 dilution of the 72-h culture was 0.28 cells per 5 μl drop (frequency distribution: 29=0 cells per drop, 9=1 cell per drop, and 1=2 cells per drop). Thus, about one out of four inoculations with the 10-7 dilution of the 72-h culture should have resulted in addition of one cell of Salmonella to a chicken part.
Standard curve
In the third run of the standard curve experiment with Salmonella Typhimurium var 5- all ten chicken parts inoculated with 5 μl of the 10-7 dilution tested positive for Salmonella . This result indicated that chicken parts in this run had endogenous Salmonella because only two or three should have tested positive for Salmonella and not all ten. In contrast, in the first two runs of the standard curve experiment with Salmonella Typhimurium var 5- only one of four cooked chicken parts inoculated with 5 μl of the 10-7 dilution tested positive for Salmonella , which was consistent with the drop plate results.
As explained above, the standard curve (Figure 2) was developed with maximum CT values.

Figure 2: Standard curve for enumeration of Salmonella on chicken parts by whole sample enrichment, real-time polymerase chain reaction (WSE-qPCR).
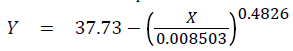
where Yo was fixed at 37.73 during curve-fitting, a was 0.008503 with a standard error of 0.003819 and a 95% confidence interval from -0.003651 to 0.02066, and b was 0.4826 with a standard error of 0.03862 and a 95% confidence interval from 0.3597 to 0.6055 and R2 (coefficient of determination) was 0.9954 and the standard deviation of the residuals was 0.5607 and n was 5.
As it turned out, all maximum CT values used to develop the standard curve were obtained from the first run with Salmonella Kentucky and were: 37.73 at zero log/part (cooked chicken breast); 31.03 at 0.37 log/part (left thigh); 26.89 at 1.37 log/part (left drumstick); 22.43 at 2.37 log/part (left wing); and 19.61 (left breast) at 3.37 log/part. The CT for Salmonella Kentucky were higher than CT for Salmonella Typhimurium var 5- (Figure 2) indicating slower growth of Salmonella Kentucky during WSE.
Raw chicken parts
Nine of 20 (45%) naturally-contaminated whole raw chickens examined had one or more parts that were contaminated with Salmonella at preparation (Table 2). The number of contaminated raw parts per chicken ranged from one to six of eight possible. Although only one isolated Salmonella colony on XLT4 per chicken part was serotyped, results indicated that whole raw chickens could be contaminated with more than one serotype as parts from chickens 1, 2, 12, 14, and 16 were contaminated with two different serotypes (Table 2).
Prevalence of Salmonella contamination of raw chicken parts (Table 2) was 15% (6/40) for wings, 28% (11/40) for breasts, 10% (4/40) for thighs, 10% (4/40) for drumsticks, and for all raw chicken parts combined was 15.6% (25/160). Predominant serotypes were Typhimurium var 5- (68%; 17/25) and Typhimurium (16%; 4/25). Prevalence of high risk serotypes was 84% (21/25) whereas prevalence of normal risk serotypes was 16% (4/25).
The CT from WSE-qPCR (Table 2) of raw chicken parts ranged from 28.10 to 37.63 with a mean ± SD of 32.36 ± 2.87. The number of Salmonella on raw chicken parts (minimum, mean, maximum) was 0.00, 0.60, 0.93 log for wings; 0.00, 0.33, 0.91 log for breasts; 0.08, 0.33, 0.73 log for thighs; 0.04, 0.13, 0.27 log for drumsticks; and for all raw chicken parts combined was 0.00, 0.36, 0.93 log per part, which were the values used to define the pert distribution for extent of Salmonella contamination of raw chicken parts at preparation (Table 1).
Cooked chicken
Incidence of cross-contamination of cooked chicken with Salmonella from utensils used to process raw chicken (Table 3) under a worst-case scenario was 12.5% (5/40). The main serotype was Typhimurium var 5- (60%; 3/5). The CT from WSE-qPCR for cooked chicken parts ranged from 29.52 to 34.02 with a mean ±SD of 31.97 ± 2.03. The number of Salmonella (minimum, mean, maximum) that cross-contaminated cooked chicken was 0.13, 0.36, 0.67 log per part, which were the values used to define the pert distribution for extent of Salmonella cross-contamination of cooked chicken during serving (Table 1).
Prevalence of high risk serotypes was 80% (4/5) whereas prevalence of normal risk serotypes was 20% (1/5). Overall (raw chicken parts plus cooked chicken parts), prevalence of high risk serotypes was 83% (25/30) whereas prevalence of normal risk serotypes was 17% (5/30).
Process risk model
Figure 1 shows simulation results for a single chicken part from Scenario A (Table 1) where 83% of Salmonella serotypes were high risk. The chicken part simulated was not contaminated with Salmonella at preparation. However, during serving it was crosscontaminated with 3 cells of a high risk serotype. The illness dose for the consumption event was 47, which was higher than the dose consumed, which was 3 cells of a high risk serotype. Consequently, no illness resulted from consumption of this chicken part.
When 100,000 iterations of Scenario A (Table 1) were simulated 500 times using different RNGS, the cases of salmonellosis ranged from 44 to 93 per 100,000 chicken parts or consumers and were found to be normally distributed with a mean ±SD of 68.4 ± 8.2 (Figure 3). Sensitivity analysis (Figure 4) from one simulation of scenario A indicated that the inputs that had the most influence on the output (salmonellosis) were incidence of cross-contamination during serving and illness dose from the pert distribution for high risk serotypes. Thus, the primary risk scenario for salmonellosis was crosscontamination of cooked chicken part with a high risk serotype of Salmonella during serving.

Figure 3: Distribution of the cases of salmonellosis for Scenario A as predicted by the process risk model for Salmonella and chicken parts.

Figure 4: Sensitivity analysis of the simulation results for Scenario A as determined by the process risk model for Salmonella and chicken parts.
To verify results of the sensitivity analysis for Scenario A, three other scenarios (B, C, and D) were simulated (Table 1). In scenario B, prevalence of normal and high risk serotypes were reversed in nodes 1 (preparation) and 3 (serving). In Scenario C, incidence of crosscontamination was reduced from 3.5% (12.5%*28%) to 2.1% (12.5%*17%) by assuming that consumers used unwashed utensils 17% of the time rather than 28% of the time to serve cooked chicken. In scenario D, changes implemented in scenarios B and C were combined.
Results of these simulations (Figure 5) indicated that the risk of salmonellosis differed (P<0.05) among all four scenarios and was Scenario A>C>B>D. These results confirmed the sensitivity analysis for scenario A that cross-contamination of cooked chicken with a high risk serotype during serving was the primary risk scenario because reducing the proportion of high risk serotypes (Scenarios B and D) and(or) incidence of cross-contamination (Scenarios C and D) significantly reduced the risk of salmonellosis.

Figure 5: Risk of salmonellosis predicted by the process risk model for Scenarios A to D. Bars are median values, error bars show minimum and maximum values, and insets below X-axis labels are mean ±standard deviation.
To validate the PRM predictions, they were compared to outbreak data. To accomplish this validation, the first step was to determine the number of exposures per 100,000 chicken parts for each scenario. The number of exposures was found to be 3,501 for scenarios A and B and 2,133 for scenarios C and D. The lower number of exposures for scenarios C and D was due to the lower incidence of crosscontamination during serving. Next, the average dose consumed in each scenario was determined and found to be 0.39 log. The next step was to calculate the median attack rate: median number of cases/ number of exposures per 100,000 parts. These values were 0.020 (69/3,501) for Scenario A, 0.005 (17/3,501) for Scenario B, 0.019 (41/2,133) for Scenario C, 0.005 (10/2,133) for Scenario D. The higher attack rates in Scenarios A and C were due to a higher prevalence of high risk serotypes. Finally, the mean dose consumed/attack rates were compared (Figure 6) with published mean dose consumed/attack rates for salmonellosis outbreaks summarized in Teunis et al [44]. These comparisons show that predictions of the PRM are consistent with outbreak data reported in the scientific literature.

Figure 6: Comparison of median attack rates for Scenarios A to D of the process risk model for Salmonella and chicken parts with outbreak data summarized in Teunis et al. [44].
Many more people suffer and die from malnutrition than foodborne illness. Thus, it is important to develop PRM that provide reliable predictions of the risk of foodborne illness so that the safety of food is reliably predicted with the goal of maximizing public health by ensuring both the consumption and safety of food. This involves using the appropriate modeling methods as well acquiring data for model development with the best available methods.
The rinse aliquot (RA) method is used by the chicken industry in the United States to acquire data for Salmonella contamination of chicken carcasses and parts. However, a number of studies [45-47] have shown that the RA method underestimates Salmonella prevalence when compared to WSE. For example, when they were directly compared at retail, Salmonella prevalence for whole chickens was 38% for WSE and 13% for RA [46]. For a more detailed comparison of these two methods see [12]. Consequently, to obtain a better prediction of risk, data obtained by WSE-qPCR rather than data obtained by RA were used to develop the current PRM for Salmonella and chicken parts.
During incubation with shaking in the present study, Salmonella were released from chicken parts into a standard volume (400 ml) of BPW where they grew to high numbers at 40°C and were detected by qPCR and a CT value was obtained. Because WSE was sampled while Salmonella were in the exponential phase of growth (10 h at 40°C), there was a mathematical relationship between CT and initial log number of Salmonella inoculated onto chicken parts. The resulting standard curve (Figure 2) was used to determine the number of Salmonella on naturally-contaminated chicken parts. The lower limit of detection of this WSE-qPCR method was one Salmonella cell per chicken part, which is in agreement with results of a previous study [12] that used the same method and source of samples.
In addition to the initial number of Salmonella inoculated onto chicken parts, previous history of Salmonella , growth condition during WSE, Salmonella serotype, microbial competition (number and type), and endogenous Salmonella on chicken parts can affect Salmonella growth and CT obtained by WSE-qPCR for standard curve development and thus, enumeration of Salmonella by this method. To minimize potential effects of previous history and growth condition during WSE on CT and enumeration of Salmonella by WSE-qPCR, all chicken parts were exposed to a standard previous history (12 h at 6°C and 0 rpm) and to a standard growth condition (10 h at 40°C and 80 rpm), respectively, during a two-stage incubation process carried out in programmable, refrigerated, orbital shaking incubators.
Individual strains of Salmonella Typhimurium var 5- and Salmonella Kentucky were used for standard curve development by WSE-qPCR. Salmonella Typhimurium var 5- was used because it was the predominant serotype isolated from chicken parts in the present study whereas Salmonella Kentucky was used because it grows slower on chicken than other serotypes of Salmonella [10]. Slower growth would result in higher CT and a more fail-safe standard curve. In fact, maximum CT for each inoculated dose, which were used to develop the standard curve (Figure 2), were all obtained with Salmonella Kentucky.
Beckers et al. [48] found that when meat was incubated in BPW at 37°C, maximum population density of Salmonella varied from 3 to 7 log per ml because of differences in number and types of competing microorganisms among replicate samples. Thus, microbial competition can affect growth of Salmonella during WSE in BPW and by inference CT obtained by WSE-qPCR. The maximum CT within an inoculated dose would represent the sample that was most inhibited by microbial competition; assuming that all other factors were equal.
Presence of endogenous Salmonella would decrease CT for samples inoculated with Salmonella with a greater influence at lower doses. Thus, using maximum CT per dose of Salmonella inoculated onto chicken parts to develop the standard curve for enumeration was done to bias effects of Salmonella serotype, microbial competition, and endogenous Salmonella in the fail-safe direction for enumeration of Salmonella on chicken parts by WSE-qPCR. The end result was a failsafe standard curve that provided a slight over-estimation of the number of Salmonella on chicken parts as all CT for naturallycontaminated chicken parts in this study were in the range from 28.10 to 37.63, which corresponded to a level of Salmonella that was less than 1 log per part. Had the over-estimation been larger, another method of standard curve development would have been used. For example, a stochastic standard curve based on the best-fit curve ± 95% prediction interval as done in an analogous manner for models that predict variability and uncertainty of growth of Salmonella on chicken meat and meat products with native microflora [49-51].
Process risk models predict consumer exposure and response to pathogens on and in food produced by specific scenarios [26,28,30]. The current PRM predicted consumer exposure and response to Salmonella on chicken parts harvested from whole broiler chickens that were purchased from a local retail store and were from a single brand and processing plant. Data for all types of raw chicken parts (wings, breasts, thighs, and drumsticks) were combined and used to define input distributions (discrete and pert) for Salmonella contamination at preparation. This was done because there were an insufficient number of Salmonella positive samples for the risk of salmonellosis from each type of chicken part to be accurately assessed individually.
Sensitivity analysis for Scenario A indicated that survival of Salmonella during cooking was a rare event that did not contribute significantly to the risk of salmonellosis, which is in agreement with other PRM for Salmonella and chicken [27,29] or turkey products [28]. Rather, cross-contamination of cooked chicken with a high risk and not a normal risk serotype of Salmonella during serving was the primary risk scenario leading to salmonellosis in the present study. Thus, reduction of prevalence and number of high risk Salmonella serotypes on chicken during commercial production and processing [5,52] as well as an effective consumer education program [53] to lower incidence of cross-contamination during serving would be effective strategies for mitigating this risk to public health. This conclusion was supported by results from the simulation of three additional scenarios in which the percentage of high risk Salmonella serotypes was reduced and(or) incidence of cross-contamination during serving was reduced. In all three scenarios, risk of salmonellosis was significantly reduced (Figure 5); thus, validating the importance of these risk factors.
Chickens examined in this study were packaged in flow pack wrappers that contained a considerable amount of chicken drip that contaminated the cutting board, knife, and latex gloves after opening the package and harvesting the chicken parts. Although the chicken drip was not directly analyzed for Salmonella , it was likely an important source of Salmonella cross-contamination of cooked chicken in this study.
Cross-contamination is usually investigated by inoculating a high dose (e.g. 6 log) of Salmonella onto chicken and then measuring the proportion of inoculated Salmonella cells that are transferred to other surfaces and food [20-24]. In fact, results from these types of transfer studies were used to model cross-contamination during serving in the original version of the PRM [27] used in this study. However, in the real world, Salmonella are not present in high numbers on chicken (e.g. Table 2) and thus, the aforementioned cross-contamination studies [20-24] and resulting transfer models may not actually provide an accurate picture of Salmonella cross-contamination in the kitchen. In fact, some studies, including this one, have studied pathogen crosscontamination in a more realistic manner using naturallycontaminated chicken [25,54-56]. In the present study, incidence of cross-contamination under a worst-case scenario was 12.5% and the number of Salmonella that cross-contaminated cooked chicken was low (range: 0.13 to 0.67 log). These results are similar to those of previous studies [12,25] using similar methods.
Consumer surveys indicate that 17 to 33% of consumers use unwashed utensils to serve RTE food like cooked chicken [16,17,57]. In the original version of the PRM [27], incidence of cross-contamination was set at 28% based on these consumer surveys. In the current study, the observed incidence of cross-contamination of 12.5% obtained under a worst-case scenario was adjusted in Scenarios A and B to 3.5% (12.5%*28%) by assuming that consumers used unwashed utensils 28% of the time. This was accomplished in the PRM by increasing the number of cooked chicken parts that tested negative for Salmonella from the observed number of 35 to 138 (Table 1). Likewise, the observed incidence of 12.5% was adjusted to 2.1% (12.5%*17%) in Scenarios C and D by assuming that consumers used unwashed utensils 17% of the time. This was accomplished by increasing the number of cooked chicken parts that tested negative for Salmonella from 35 to 230 (Table 1). Thus, the worst-case scenario, which facilitated acquisition of data for cross-contamination by WSE-qPCR, was not simulated in the current study. Rather, more realistic crosscontamination scenarios were simulated by adjusting the discrete distribution for this pathogen event using data from surveys of consumer food handling behavior.
Dose-response in PRM [29,30,58,59] is usually simulated as a probabilistic event using dose-response models that are sigmoidshaped (e.g. exponential model) and whose output is a value from 0 to 1. However, when a consumer ingests a pathogen dose, their response is not a probability of getting ill. Rather, they either become ill or they do not. In addition, when the food is contaminated by two or more serotypes of Salmonella with different virulence the dose-response curve is nonsigmoid in shape [8,60]. Therefore, in this and previous studies [8,26], dose-response from consumption of an individual chicken serving was simulated as a discrete event: no illness or illness.
During simulation of the current PRM, an illness dose was randomly assigned to each chicken part. Illness dose is the outcome of a variable, uncertain, and random interaction among the three components of the disease triangle; namely, the pathogen, food, and host. In assigning an illness dose to each chicken part, no assumption was made about the mechanism for a specific illness dose other than that it represented a normal or high risk serotype of Salmonella . Rather, it was recognized that many combinations of food, pathogen, and host factors could be responsible for a particular illness dose. In other words, the same illness dose could occur by different mechanisms. For example, an illness dose of 100 could be due to a high risk serotype, normal risk meal, and normal risk consumer or it could be due to a normal risk serotype, normal risk meal, and high risk consumer.
Results of the present study and previous studies [12,38] indicate that chicken parts from a single chicken or batch of chickens can be contaminated with multiple serotypes of Salmonella . Oscar [8] used human feeding trial data for 13 strains of Salmonella to develop and validate a dose-response model that predicts the risk of salmonellosis as a function strain prevalence and virulence. He showed that when two or more strains of Salmonella that differ in virulence are simulated together the resulting dose-response curve was nonsigmoid in shape. A similar result was reported by Latimer et al. [60]. Thus, a sigmoidshaped dose-response model was not used in the present study. Rather, a method similar to that of Oscar [8] was used to model dose-response as a function of serotype prevalence and virulence.
Variability and uncertainty are important components of a PRM. Variability is the genuine distribution of values for an input parameter whereas uncertainty is the lack of knowledge of the genuine distribution of values for an input parameter. Uncertainty can be reduced by collection of more data. However, it is not possible to quantify a lack of knowledge. Nonetheless, there is great interest in separating variability and uncertainty in PRM.
To address this issue, Nauta [61] introduced the parameters αx to represent the proportion of variation of input parameter x due to uncertainty and 1-αx to represent the proportion of variation of input parameter x due to variability. He demonstrated how these parameters could be used within a second-order Monte Carlo simulation to separate variability and uncertainty in a model for growth rate of Bacillus cereus in pasteurized milk. Based on these results, he concluded that it was important to separate variability and uncertainty to arrive at a reliable prediction of risk in a PRM. However, this conclusion is based on contrived data, subjective assumptions, and a model for growth rate and not a PRM and thus, is unproven. Therefore, publication of a PRM should not require separation of variability and uncertainty.
A potentially more important issue in PRM than separating variability and uncertainty for a reliable prediction of risk may be how the risk pathway is simulated. It seems that to get a reliable prediction of risk from a PRM it may be important to simulate both contaminated and non-contaminated servings and to simulate dose-response as a discrete event. Simulating only contaminated servings and simulating dose-response as a probabilistic event [30,62], which is not what occurs in the real world, may result in an unreliable prediction of risk that results in the wrong food safety decision.
To test this possibility, the present PRM was used to simulate Scenario E (Table 1) in which incidence of pathogen events were set to 100% so that only contaminated servings were simulated. In addition, the dose-response was changed from discrete to probabilistic and results were adjusted after simulation for prevalence. The average dose consumed in Scenario E was the same as Scenario A where it was 0.39 log. However, the risk of salmonellosis (cases/100,000) for Scenario E was 273 ± 1 (Figure 7) as compared to 68 ± 8 for Scenario A (Figure 3).

Figure 7: Distribution of the cases of salmonellosis for Scenario E as predicted by the process risk model for Salmonella and chicken parts.
Thus, simulating only contaminated servings and using a probabilistic dose-response method resulted in an over-estimation of risk and an under-estimation of the variability and uncertainty of risk. It also over-estimated the number and importance of risk factors (Figure 8).

Figure 8: Sensitivity analysis of the simulation results for Scenario E as determined by the process risk model for Salmonella and chicken parts.
The reason for the over-estimation of risk in Scenario E was that the worst-case scenario at each step in the risk pathway always happened to a contaminated serving whereas in Scenario A the worst-case scenario at each step in the risk pathway did not happen or happened only on rare occasion to a contaminated serving. Likewise, the underestimation of the variability and uncertainty of risk in Scenario E occurred because each consumption event resulted in exposure and response whereas in Scenario A exposure and response was a rare event. Thus, simulating only contaminated servings and using a probabilistic rather than a discrete method for dose-response resulted in an over-estimation of risk and an under-estimation of the variability and uncertainty of the risk. Unreliable predictions from a PRM can harm public health by labeling safe food as unsafe or unsafe food as safe.
In the present study, a PRM for Salmonella and chicken parts was developed that contained four unit operations and associated pathogen events. It was designed to simulate what happens in the real world. Consequently, both contaminated and non-contaminated servings were simulated together using a rare events modeling method to predict exposure. When a consumer is exposed to a foodborne pathogen, their response is not a probability of getting ill; rather, they either become ill or they do not. Therefore, in the present study, a method was used that predicted dose-response as a discrete event: no illness or illness.
Variability and uncertainty of pathogen events in the current PRM were modeled together because as discussed above there is not a reliable method for quantifying and separating them. Nonetheless, 500 simulations, each with a different RNGS to initiate them, were used to characterize the variability and uncertainty of the PRM predictions due to the rare, random, variable, and uncertain nature of pathogen events in the risk pathway. The PRM predictions were successfully and appropriately validated against outbreak data because they represented a single batch of chicken. Had the PRM predicted risk associated with all batches of chicken, it could be appropriately validated against epidemiological data.
A novel aspect of this study was that a PRM for Salmonella and chicken parts was developed for the first time using prevalence, enumeration, and serotype data obtained by WSE-qPCR, a newer method that has been shown to outperform the standard RA method used in the chicken industry to acquire data for Salmonella contamination. Thus, PRM predictions were improved over previous studies by using a better method of data collection and because they allowed prediction of the risk of salmonellosis as a function of serotype prevalence and virulence.
Simulation of the PRM for Salmonella and chicken parts indicated that the primary risk scenario was cross-contamination of cooked chicken with a high risk serotype of Salmonella during serving. This result was obtained by sensitivity analysis and was confirmed by scenario analysis. Thus, reduction of the prevalence of high risk serotypes of Salmonella on chicken during production and processing and a consumer education program that reduces the incidence of cross-contamination during serving are potential interventions that could help reduce this important risk to public health.
The PRM can be adapted and used to identify higher risk batches of chicken at the processing plant before distribution to consumers as illustrated in [41]. Predictions of the PRM, which simulated contaminated and non-contaminated servings and used a discrete dose-response method, were shown to be consistent with outbreak data and were shown to be more reliable than when it only simulated contaminated servings and used a probabilistic dose-response method. Thus, future users of the PRM can be confident in the predictions that it provides. The goal of the PRM is to maximize the public health benefit of food by ensuring both its consumption and safety.