Advances in dairy Research
Open Access
ISSN: 2329-888X
ISSN: 2329-888X
Research Article - (2019)Volume 7, Issue 3
The objectives of this study were to compare physicochemical, rheological and sensory characteristics of rice powder added Camembert cheeses (RPACC) with those of non-supplemented control Camembert cheese (NSCCC) during 4 weeks ripening period. The viable lactobacillus bacteria (LAB) counts after 4 weeks ripening in NSCCC, 1%, 3% and 5% RPAC cheeses were: 1.0 × 10⁸ ± 0.12, 1.3 × 10⁸ ± 0.26, 1.02 × 10⁸ ± 0.15 and 1.02 × 10⁸ ± 0.17 CFU/ml, respectively, indicating that 1% RPACC cheese had the highest viable LAB counts among all RPACC and NSCCC. The level of water soluble nitrogen was also the highest (115.69 μg/g) in 1% RPACC among all cheese groups at 4 weeks aging. Organic acids in all treatment groups decreased as ripening period advanced. Protein degradation occurred most significantly in low molecular weight peptides at 2 weeks ripening in NSCCC and all RPACC cheeses. Compared to three treatment groups (NSCCC, 3 and 5% RPACC), the 1% RPACC contained the lowest unpleasant flavor components among all tested groups, which include goaty, soapy, waxy, musty, rancid, and sour flavors. In textural characteristics, there were substantial drops in hardness (g), gumminess (g) and chewiness (g) at 2 weeks ripening, while hardness and gumminess of NSCCC values were highest throughout the experiment. The 1% RPACC showed the lowest hardness among all treatment groups. At 3-4 weeks ripening, NSCCC showed the lowest cohesiveness, gumminess and chewiness among all treatment groups. With respect to sensory properties, the NSCCC showed higher sensory scores than 1% RPACC and some traits of 3 and 5% RPACC. This suggests that the NSCCC had higher characteristic sensory values of Camembert compared to 1% RPACC, attributable to the dilution effect of the rice powder addition to the RPACC cheeses. The milder Camembert cheese flavor in 1% RPACC may be sought by certain ethnic groups, who are not familiar with the Camembert cheese flavor.
Camembert cheese; Rice powder addition; Physicochemical; Texture; Sensory properties
Camembert cheese (CC) is a moist, soft, creamy, surface-ripened cow milk cheese [1]. It was first made in the late 18th century at Camembert, Normandy, in northern France. It is similar to Brie, which is native to the Brie region of France. It is produced by fermenting Penicillium camemberti or Penicillium candium, which is very quickly ripened because it is high moisture content and the rapid growth of surface mold [2]. Especially, the strong activity of the mold protease and lipase are rapidly transformed the insoluble casein into water soluble nitrogen.
The consumption of Camembert cheese has been recently increased in Korea. The dairy companies started to produce CC owing to its high popularity in the country. According to a survey of milk and dairy production by the Dairy Statistics Yearbook in 2018, the annual consumption of cheeses in Korea was about 159,000 tons, which is about 12.95% higher than the previous year [3].
Rice has been a staple food for thousands of years in the Southeast Asian region, especially in China, Korea and Japan. Rice is a plant belonging to potted plants and rice paddies and about 20 species are known around the world. Among them, rice grows in japonica rice grown in temperate regions of Korea, China and Japan [4]. The Korean-style meal, which is made up of rice as a staple, can be used as a side dish for a variety of rations together with rice. It has excellent nutritional values and is a food culture that has developed and passed on various scientific and excellent recipes such as fermentation and storage technology. However, due to the introduction of western style foods, recognition of the traditional Korean food culture has shown a decrease in rice consumption and rice processed foods in modern Asian societies.
Studies using rice showed that fermented beverages of rice fermented with Leuconostoc mensentroide 310-12 [5], fermentation characteristics of lactic acid bacteria by adding rice powder [6]). In the ripened cheese, various food ingredients or functional ingredients can be added to make green tea [7], fish meat [8], chitosan [9], chlorella [10], and tomato powder [11].
Although cheese consumption has been gradually increased, the acceptability of Camembert cheese is not high among certain ethnic groups including Koreans due to its unfamiliar and strong cheese taste. The production of a mild flavored CC would be desirable in order to enhance the consumption of CC in non-traditional cheese consuming countries. For this end, it is desirable to investigate the possibility of supplementing rice powder into CC to produce a milder flavor product, which would be suitable for the taste of Korean consumers.
Few studies have been conducted on the effect of addition of rice powder to natural cheeses, especially in CC. Therefore, objectives of this study were to: (1) manufacture the rice powder added Camembert cheeses (RPACC; 1, 3, 5% rice powder) and non-supplemented control Camembert cheese (NSCCC), and (2) compare physicochemical, textural and sensory characteristics of RPACC with those of NSCCC during 0, 2 and 4 weeks aging periods.
Raw milk
The experimental raw cow milk was obtained from the milking herd of Holstein-Friesian breed at the Animal Resources Research Center, Chungnam National University located at Cheongyang, Chungnam, South Korea.
Starter culture
Starter cultures used were the DVS (Direct Vat Set) cultures composed of Lactococcus cremoris, Lactococcus diacetylactics, Lactococcus lactics, Leuconostoc mensenteroides (CH-N11, Chr-Hansen Co., Denmark). The Penicillium candidum mold (Chr-Hansen Co., Denmark) was inoculated on the surface of the experimental Camembert cheeses.
Preparation of rice powder
The rice (Nong Hyup, Daejeon, Korea) was soaked in distilled water for 24 hours, ground for 3 minutes with a blender (MX2000, Braun® Co., Kronberg, Germany), shaken for 10 minutes on a standard mesh of 600 μm sieve to get fine powder.
Ripening of cheeses
The RPACC was prepared by the Scott [12] method (Figure 1). The amount of added rice powder was 0%, 1.0%, 3.0% and 5.0%, respectively. Initially, the control CC and RPACC were ripened for 1 week in the ripening room (12°C, RH 95%), and then secondary ripening was carried out at 4°C for 2-4 weeks.
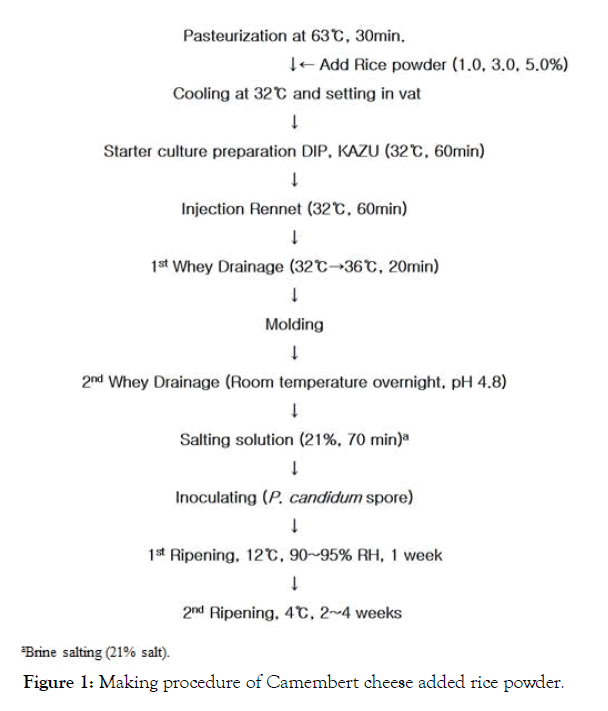
Figure 1: Making procedure of Camembert cheese added rice powder.
pH
The pH of cheese samples were determined weekly using the methods [9] and [13]. A 10 g cheese sample and 20 ml sterilized water were homogenized using a homogenizer (ULTRA TURRAX T25, Janke & Kunkel, IKA-Labortechnik, Staufeny, Germany) for 5 min at 20,000 rpm, and then the pH of a sample was measured weekly for 4 weeks using a pH meter (S-20K, Mettler Toredo Co., Bedford, MA, USA).
Viable cell count
Cheese samples were taken weekly, mixed with sterilized water at 1:2 ratio as was done for pH. The number of viable cell counts was determined by the method [14], using a standard plate count agar (DifcoTM, Becton, Dickinson and Company Sparks, MD, USA) and BCP agar (Eiken Chmical Co., Ltd. Shimotsuga-gun, Tochigi, Japan).
Water soluble nitrogen (WSN)
Changes in WSN were measured to estimate the extent of protein degradation during the cheese-ripening period [15]. The cheese samples were homogenized with a homogenizer (ULTRA TURRAX T25, Janke & Kunkel, IKA Labortechnik, Staufeny, Germany) with sterilized water and cheese at a ratio of 4:1 (sterilized water 80 mL: cheese 20 g) and centrifuged at 4,000 rpm (Mega 17R, Hanil Science Industrial,Daejeon, Korea). After centrifugation for 30 min., the supernatant was filtered through Whatman No.2, and 2.5 mL of reagent A (12% trichloroacetic acid) and 0.5 mL of distilled water were added to supernatant [16]. The mixture was allowed to stand at room temperature for 20 minutes, filtered the supernatant through Whatman No. 42 (GE Healthcare Life Sciences, Buckinghamshire, UK) and decanted 2.5 mL. Five mL of reagent B (500mL of Distilled water+75 g of sodium carbonate+10 g of sodium hexametaphosphate) and 1.5 mL of reagent C (50 mL of phenol regent+100 ml of distilled water) were successively added to 2.5 mL of the filtrate. After the color development, WSN content was measured at the absorbance of 570 nm using a UV-spectrophotometer (UV-1700,Shimadzu Co., Tokyo, Japan), and the concentration was calculated according to the linear equation using tyrosine as a standard.
Protein, lactose and organic acid assays
A 2:1 ratio of sterilized water and cheese sample were homogenized, and centrifuged at 6,000 rpm for 10 min using a centrifuge (Mega 17R, Hanil Science Industrial, Daejeon, Korea). The supernatant was collected and filtered using 0.2 ㎛ membrane filter. Protein was determined by HPLC system (600E Multisolvent Delivery System, Waters Associates, Milford, MA, USA), and amino acid and glucose conversion were also analyzed. Twenty μl samples were injected to the 7725 injector (Rheodyne, Milford, MA, USA), and the detector used was a 2487 UV detector (Waters Associate, Milford, MA, USA) for protein and organic acid analyses. Sugar content was analyzed using Refractive Index Detector (2410 RI Detector, Waters Associates, City, State, Milford, MA, USA). Columns used were: Vydac218TPTM C18 (Grace Division Discovery Science, Deerfield, IL, USA), and SUPERCOGEL C-610H (38 cm × 7.8 mm, SUPELCO, Bellefone, PA, USA). The temperature was set at 40°C using a Waters Column Heater Module (serial # F98 CHM095M, Milford, MA, USA). The mobile phase was subjected to organic acid and glucose conversion test at a flow rate of 0.5 mL/ min using 0.1% phosphoric acid and water (TEDIA Company Inc., Fairfield, OH, USA). Protein analysis was performed using 0.1% TFA (Trifluoroacetic acid). And the B mobile phase was analyzed with 0.1% TFA + Acetonitrile at a flow rate of 1.0 mL/min for 40 minutes. The standard reagents used for the experiments was purchased from Sigma-Aldrich Co. (Darmstadt, Germany).
Fatty acid analysis
Fat extraction: Five grams of cheese sample were mixed with 25 mL ether for fat extraction, and shaken for 3 hours at 30°C/200 rpm [17]. The supernatant of fat extract was decanted, and concentrated using nitrogen gas to a volume of 1/16.
Fatty acid determination: Changes in fatty acid profiles during cheese maturation were determined using a gas chromatograph [17]. Volatile concentrates were analyzed with HP 6890 GC (Agilent Tech, Santa Clara, CA, USA), using HP-5MS (30 m × 0.25 mm id × 0.25 μm, Agilent Tech, Santa Clara, CA, USA) column. The sample extract was injected to the GC injector and heated to 190°C at a rate of 6°C/min and then held at 190°C for 10 minutes. The carrier gas was N at a rate of 35 mL/min.
Texture analysis
The change in physical properties of cheese samples was evaluated by Texture Profile Analysis (TPA) using a texture analyzer (Model TA-XT2i, Stable Micro Systems, Surrey, England) [18,19]. The hardness, cohesiveness, springiness, gumminess and chewiness were measured by a force-time curve obtained where a 4 mm compression plate was mounted and probed twice in succession. The operating condition of TA, XT2i texture analyzer is shown in Table 1.
| Measurement | Condition |
|---|---|
| Probe | Stainless steel rod (diameter 4mm) |
| Pre-test speed | 5.0 ㎜/s |
| Test speed | 1.0 ㎜/s |
| Post-test speed | 5.0 ㎜/s |
| Distance | 20.0 ㎜/s |
| Time | 5.00 sec |
| Strain | 0.7 |
| Force | Grams |
Table 1: Operating condition of TA (XT2i texture analyzer).
Sensory evaluation
Sensory properties of all experimental cheese samples were evaluated according to the methods [20]. The 7 hedonic scores used were: 7; very strong, 6; strong, 5; a little strong, 4; fair, 3; a little weak, 2; weak, 1; very week. Intensities of flavor characteristics were investigated for salty, bitterness, sweetness and sourness. The sensory panel was composed of 40 untrained panelists of students and faculty at Chungnam National University, Daejeon, Korea.
Statistical Analysis
All experimental data were analyzed for ANOVA, least square means and Duncan’s Multiple Mean Comparison using SAS program (SAS 9.3 Institute Inco, Cray, NC, USA). The significance level between treatment means was P<0.05.
Structural changes in cheeses
Figure 2 exhibits the structural changes occurred in four treatment groups of the experimental Camembert cheeses after 4 weeks ripening, All three rice powder added groups showed certain extents of apparent structural deterioration of cheese texture compared to control cheese (CC), indicating that there were apparent protein and fat degradation occurred in the experimental cheeses especially in rice powder supplemented groups.
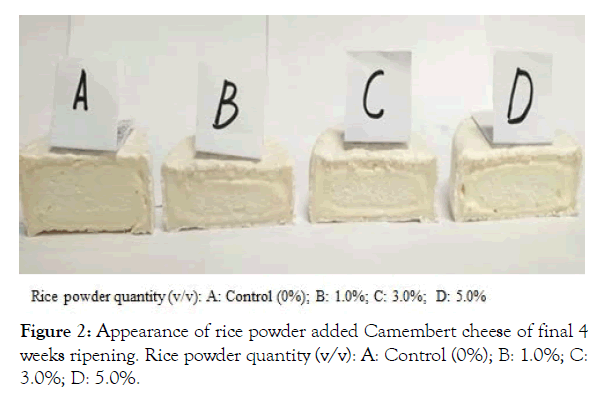
Figure 2: Appearance of rice powder added Camembert cheese of final 4 weeks ripening. Rice powder quantity (v/v): A: Control (0%); B: 1.0%; C: 3.0%; D: 5.0%.
Changes in cheese pH
Changes in pH of the experimental NSCCC and RPACC during 4 weeks ripening period are shown in Figure 3. The initial pH at 0 week was 4.9, which was slightly decreased to the pH range of 4.6- 4.8 for control (0%) and 1.0%, 3.0% and 5.0% rice powder added groups during 1 week ripening. The pH values for the rice powder added cheeses after 2 wk, 3 wk and 4 week ripening were: 5.8, 6.0-6.3, 7.3-7.5, respectively. The pHs of control cheese (NSCCC) at the corresponding periods were: 5.4, 5.7, 6.8, respectively, indicating that the pHs of control cheese were lower than those of RPACs over entire ripening period.
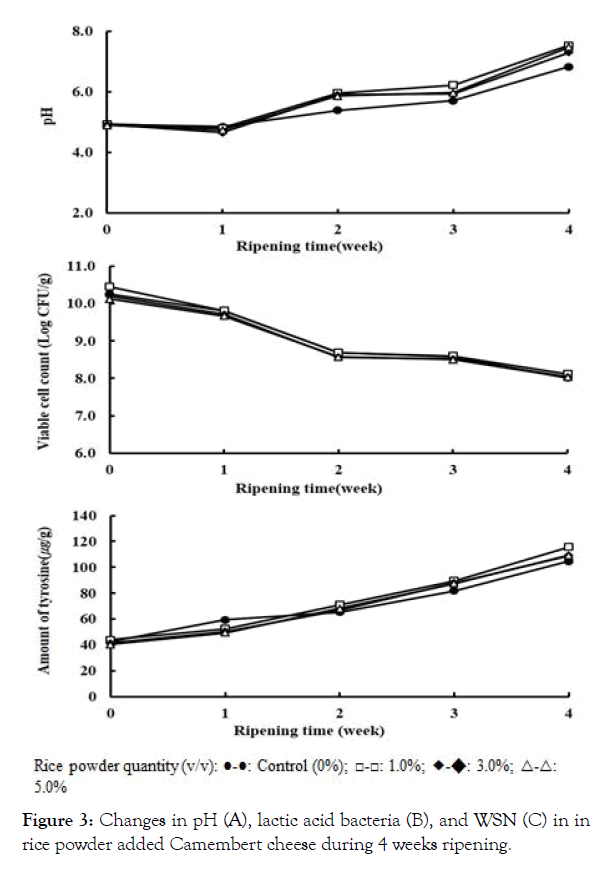
Figure 3: Changes in pH (A), lactic acid bacteria (B), and WSN (C) in in rice powder added Camembert cheese during 4 weeks ripening.
These outcomes of our study on Camembert cheese were in agreement with the previous several reports. Lee. reported that the pH of the RPACC rapidly increased 7.4 after 45 days ripening [21]. In addition, Schlesser also observed that the pH of the Camembert cheese rapidly increased from 4.5 to 6.4 after 50 days ripening [22]. This phenomenon suggests that the assimilation of lactic acid and deamination of amino acids by the mold. Especially, the pH of 1.0% RPAC increased more than 3.0% and 5.0% RPAC, which may indicate the beneficial effect of rice powder addition on fermentation by the starter culture bacteria. Our results showed that 1.0% addition was the most suitable amount of rice powder to the Camembert cheese for the lactic acid bacteria and the mold growth.
Changes in viable cell count
Figure 3 displays the changes in viable lactic acid bacteria (LAB) of NSCCC and RPACC during 4 weeks ripening. The general trend of the number of LAB revealed that there was a similar decrease in LAB in both NSCCC and RPACC treated samples. The initial range of LAB counts for both control and rice powder added CC were 10.1 ~ 10.4 log CFU/g. The LAB counts for NSCCC and 1.0, 3.0, 5.0% RPACC treated samples at 2 weeks ripening were 8.69 log CFU/g, 8.68, 8.56 and 8.57 log CFU/g, respectively.
The subsequent changes in viable LAB counts at the final 4 weeks aging was reduced to 8.1 ~ 8.2 log CFU/g for all control and treatment cheese samples. As observed in changes in pH values of the experimental Camembert cheeses, the highest survival of viable LAB counts were found in 1% RPACC group. These outcomes may be accountable for the depletion of lactose and starch from rice by the mold and lactic acid bacteria.
Changes in water soluble nitrogen (WSN)
The changes in water soluble nitrogen compounds of NSCCC and RPACC during 0 ~ 4 weeks ripening are shown in Figure 3. Proteolysis and protein degradation occurs during ripening of cheese and dairy products with concomitant effects of increased storage time and storage temperature [23,24]. An increase in WSN of a cheese indicates protein degradation in the cheese products. In the first week, the amount of WSN more rapidly increased in the NSCCC than in the RPACCs. However, 1.0% RPACC was slightly higher rate than that of other RPACC during 2 ~ 4 weeks ripening period, which was 115.69 μg/g at 4 weeks of final ripening. These results suggest that the chymotrypsin (rennet) and the starter culture may have hydrolyzed the casein and rice protein during ripening. The solubility of casein might have been decreased the amount of insoluble nitrogen and increased the amount of soluble nitrogen. The WSN of 1.0% RPACC was higher than those of other RPACCs, indicating that 1.0% rice powder may be the proper amount of supplementary ingredient for enhancing the ripening RPACC. Schlesser reported that the amount of acid soluble nitrogen increases about 50% the progress of ripening 50 days in Camembert cheese [22].
Production of hydrolysis of lactose, organic acid and protein
Changes in carbohydrates of RPACC during 0-4 weeks ripening are shown in Figure 4. The descending order of concentrations of carbohydrates of NSCC and RPACC were:lactose>glucose (exception 1%) >galactose at 0 week ripening. Lactose, glucose, and galactose gradually decreased throughout 4 weeks ripening period. Lactose, glucose, and galactose were hydrolyzed and utilized by lactic acid bacteria and mold, where these carbohydrates were almost disappeared after 4 weeks ripening.
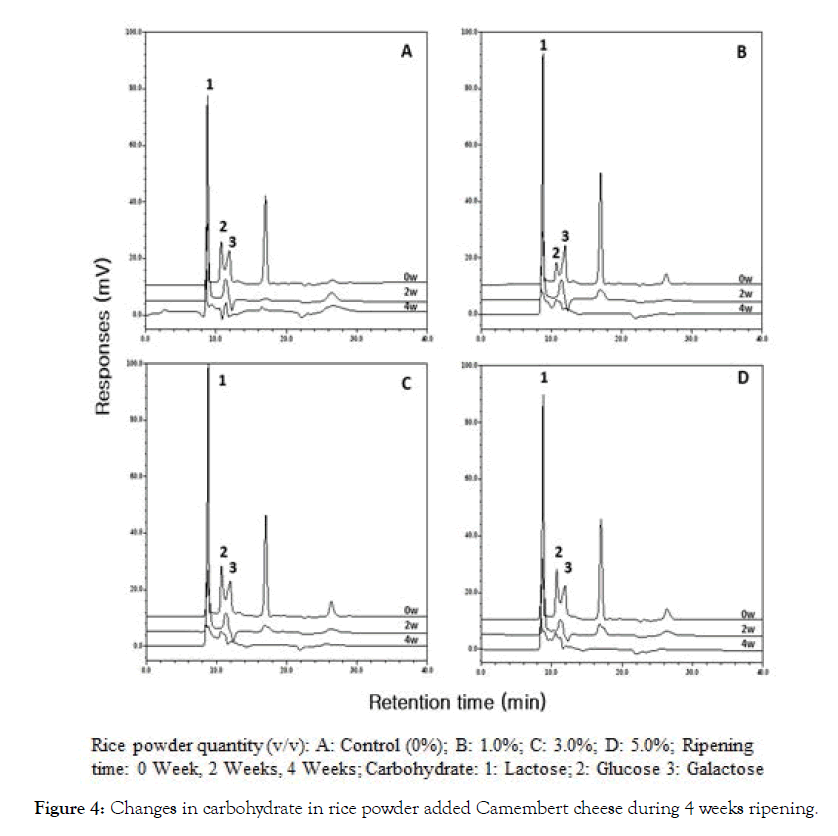
Figure 4: Changes in carbohydrate in rice powder added Camembert cheese during 4 weeks ripening.
Changes in organic acids of NSCCC and RPACs during 0 ~ 4 weeks ripening are shown in Figure 5. Organic acids levels at 0 week of NSCCC and RPACC in the order of concentrations were: lactic acid > oxalic acid > citric acid > propionic acid > butyric acid. Lactic acid was produced a small amount at 1.0, 3.0, 5.0% RPACC, and then NSCCC propionic acid and butyric acid were produced only at 2 weeks ripening for 1% RPACC. At 4 weeks ripening, only oxalic acid was found in a significant amount, suggesting that organic acids were significantly decreased over the 4 weeks ripening period. Our results are in agreement with Shin where they observed that all organic acids were continuously decreased during ripening in Emmental cheese [25].
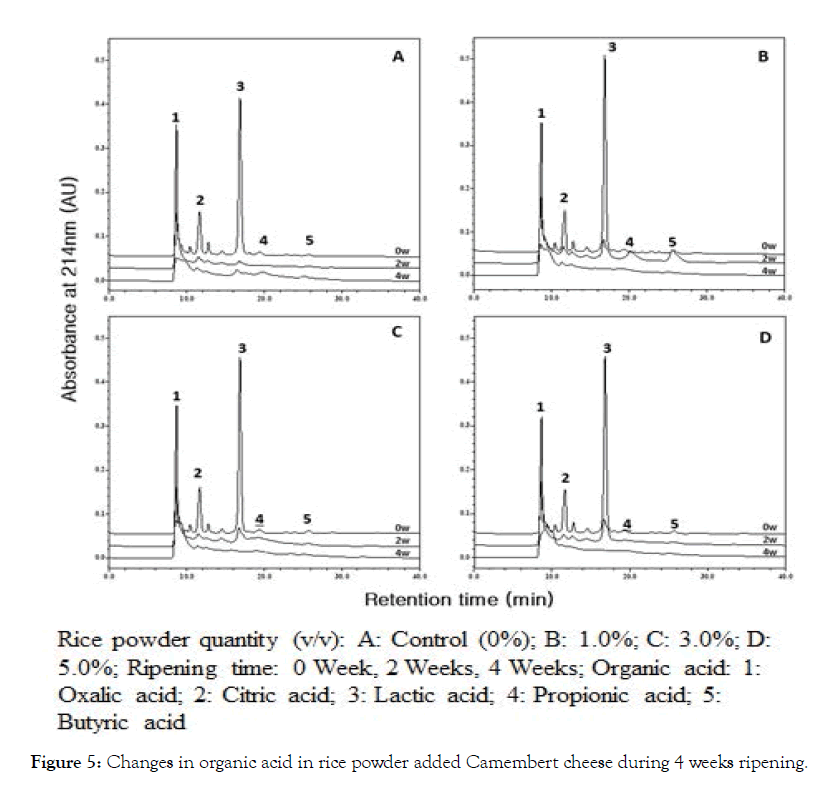
Figure 5: Changes in organic acid in rice powder added Camembert cheese during 4 weeks ripening.
The hydrolysis of protein in NSCCC and RPACC during 0 ~ 4 weeks ripening are also displayed in Figure 6. Changes in casein contents were dramatically decreased in NSCCC and RPACC during 0 ~ 4 weeks ripening. The degradation of both α-casein and β-casein was proceeded in sequential manner during 4 weeks ripening. As shown in Figure 6, first step of ripening procedure is splitting off big peptides from the proteins by rennet (not bitter peptides). The separation of peptides by HPLC in initial NSCCC was observed at retention time 17-22 min. The shapes of peaks are simple, broad and dull, while they represented retention time at 18- 19 min in 5% RPACC. As shown in Figure 6, small peptides (bitter peptides) by starter culture and rennet were generated more than control (0 week) ripening. The separation of peptides by HPLC at 2 weeks ripening was confirmed at retention time 17-22 min. The shapes of peaks were separated sharply 2 peaks. One sharp and small peak appeared at retention time 18-18.5 min and another large and sharp peak occurred at retention time 19-22.5 min. As shown in Figure 6, savory peptides and amino acids by starter and non-starter peptidases generated much more than 0 and 2 weeks ripening. The shapes of peaks were appeared much more sharp single peaks generated at over retention time 8-22 min. Elevation of protein degradation in the NSCCC and RPACC during 4 weeks ripening due to solubilization of casein, elevation of pH or both by metabolites produced by lactic acid bacteria, fungi and plasmin, may have resulted in the decomposition of casein.
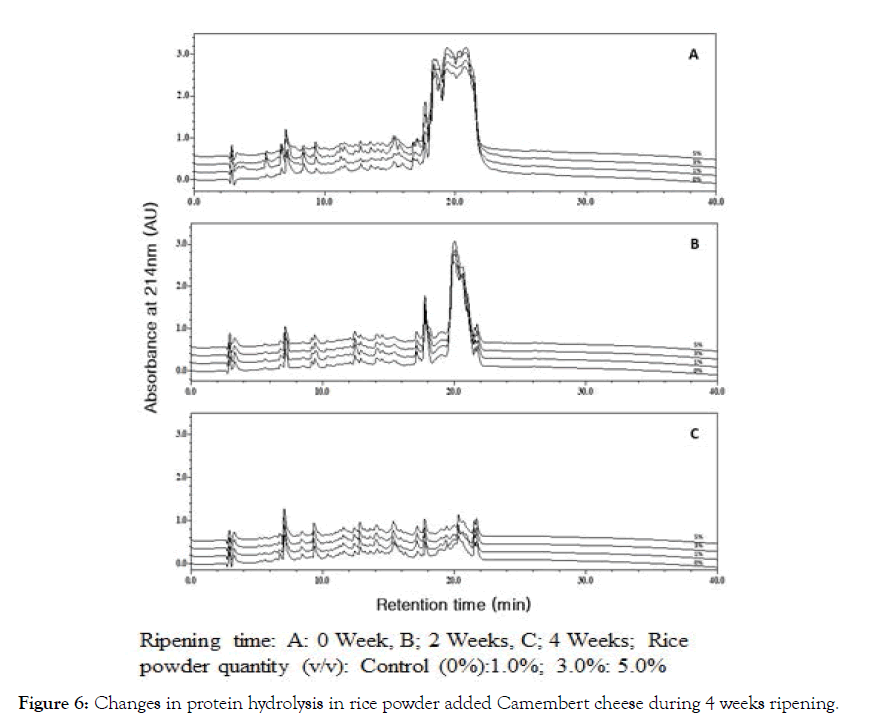
Figure 6: Changes in protein hydrolysis in rice powder added Camembert cheese during 4 weeks ripening.
Changes in fatty acids
Changes in fatty acids in NSCCC and RPACC during 0 ~ 4 weeks ripening are shown in Figure 7 and Table 2 [26]. Changes of fatty acids of 0 week ripening in the NSCCC and RPACC (1%, 3%, 5%) showed similar patterns of fatty acid concentrations in descending order, as hexadecanoic acid (palmitic acid)>octadecanoic acid (stearic acid)>tetradecanoic acid (myristic acid)>dodecanoic acid (lauric acid). However, the opposite pattern was revealed after 4 weeks ripening in the NSCCC and RPACC (1%, 3%, 5%) as octadecanoic acid (stearic acid)>hexadecanoic acid (palmitic acid) >tetradecanoic acid (myristic acid) >dodecanoic acid (lauric acid). It was noted that hexadecanoic acid (palmitic acid) was especially lower in the RPACC (1%, 3%, 5%) than NSCCC, suggesting that unpleasant flavor (goaty, soapy, waxy, musty, rancid, sour) in RPACC groups may have been converted to a milder flavor and taste compared to NSCCC group. The taste of RPACC is thought to be dominated by dodecanoic acid (lauric acid), tetradecanoic acid (myristic acid), hexadecanoic acid (palmitic acid) and octadecanoic acid (stearic acid). Camembert cheese has been found to be a major source of the flavor of fatty acids, including dodecanoic acid (lauric acid), tetradecanoic acid (myristic acid), hexadecanoic acid (palmitic acid) and octadecanoic acid (stearic acid). These results resemble the data reported by Molimard and Spinnler [26] and Sablé and Cottenceau [27]. The proper amount of rice powder added Camembert cheese might have reduced the strong and unpleasant flavor, producing possible production of fragrant cheese. Lipolysis may have caused the production of some strong flavor compounds during ripening of the cheeses. Fatty acids have direct impacts on flavor and release the precursors of other flavor compounds. Lipolysis is particularly important in soft cheeses such as Camembert, where free fatty acids can be generated up to 10% of the total fatty acids present [28].
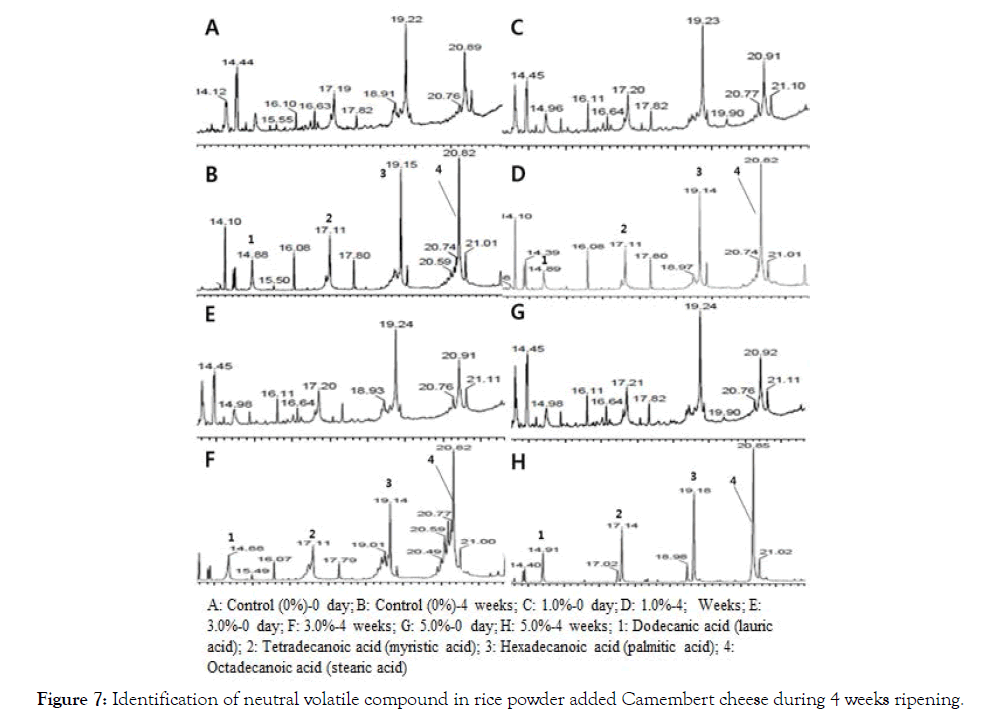
Figure 7: Identification of neutral volatile compound in rice powder added Camembert cheese during 4 weeks ripening.
| Peak No. | Compounds | Retention time (min) | Flavor note |
|---|---|---|---|
| 1 | Lauric Acid | 14.89 | Fatty, Rancid |
| 2 | Myristic Acid | 17.11 | Unknown |
| 3 | Palmitic Acid | 19.15 | Waxy, Pungent, Blue Cheese |
| 4 | Stearic Acid | 21.02 | Unpleasant, Oily, Goaty, Soapy, |
| Waxy, Musty, Rancid, Fruity, | |||
| Sour, Sweaty |
Table 2: Flavor notes of some fatty acids encountered in Camembert cheese.
Changes in texture
Textural properties of NSCCC and RPACC were compared among different treatment groups during 0-4 weeks ripening period (Table 3). With respect to hardness of the experimental Camembert cheeses, substantial and most significant decreases were occurred between 1 week to 2-4 weeks aging. The differences in hardness between 1 week and 2-4 weeks aging were substantially high. The hardness of NSCCC for 0, 1, 2, 3, and 4 weeks were: 1852.7, 1490.1, 61.55, 59.54, 57.21, respectively. These radical changes in hardness values appeared to be caused by the possible decomposition of cheese proteins (caseins) and starch of rice powder which might have strong proteolytic enzymes secreted by the fungus at the beginning of the 2 weeks ripening period. In addition to the enzymes released by the fungus, there are many other proteolytic enzymes present in the cheeses such as indigenous enzymes of milk, coagulating enzymes (rennet), microbial proteinases, enzymes from starter culture bacteria, etc. cause ripening of cheeses during storage [23], Similar results have been reported by several previous researchers [17,21,23,24,29], where hardness decreased with ripening of different cheeses.
| Period (week) | Treatment | Hardness(g) | Springiness | Cohesiveness | Gumminess(g) | Chewiness(g) |
|---|---|---|---|---|---|---|
| 0 | Control | 1852.68a | 0.9970a | 0.644a | 1193.83a | 1190.56a |
| 1% | 1448.83b | 0.9955ab | 0.549b | 859.78b | 854.72b | |
| 3% | 1381.05b | 0.9914b | 0.571b | 793.34c | 783.25b | |
| 5% | 1345.37b | 0.9903ab | 0.554b | 768.58c | 804.02b | |
| 1 | Control | 1490.14a | 1.005a | 0.621NS | 914.70a | 955.64NS |
| 1% | 1258.23b | 0.981b | 0.607 | 878.20b | 953.93 | |
| 3% | 1240.58bc | 0.960c | 0.562 | 869.69b | 956.2 | |
| 5% | 1234.51c | 0.956c | 0.631 | 863.00b | 948.36 | |
| 2 | Control | 61.55a | 0.990a | 0.539a | 33.05a | 32.75a |
| 1% | 43.47c | 0.957a | 0.413b | 18.42c | 18.11c | |
| 3% | 46.90bc | 0.981b | 0.448b | 20.83bc | 19.96bc | |
| 5% | 56.59b | 0.982a | 0.440b | 24.90b | 24.57b | |
| 3 | Control | 59.54a | 1.008a | 0.365c | 21.70b | 21.87b |
| 1% | 47.71b | 0.974a | 0.545a | 25.99a | 25.31a | |
| 3% | 50.93b | 0.994b | 0.427b | 21.77b | 21.64b | |
| 5% | 51.20b | 0.992b | 0.420b | 23.37ab | 23.18ab | |
| 4 | Control | 57.21NS | 0.983NS | 0.386b | 22.09NS | 21.70NS |
| 1% | 48.81a | 0.959a | 0.490a | 23.97a | 23.10a | |
| 3% | 49.80a | 0.974a | 0.488a | 24.84a | 23.65a | |
| 5% | 51.98a | 0.974a | 0.472a | 24.74a | 24.20a |
Mean ± S.D (n=20). Means in each column with different superscripts differ significantly (p<0.05)
a-d : Menas with different superscripts in the same row are significantly different (p<0.05)
NS : Not Significant Different
Table 3: Changes of texture in rice powder added Camembert cheese during 4 weeks ripening.
The textural property trends of gumminess and chewiness are similar to those of hardness, where the values of gumminess and chewiness up to one week ripening were substantially higher than those of 2 to 4 weeks aging periods in both control and rice powder added cheeses (Table 3). For only the 2 weeks of ripening period, the control cheeses showed higher gumminess and chewiness values than those of 3 and 4 weeks aging periods. Although there were some variations between control and RPACC cheeses in different ripening periods, both springiness and cohesiveness traits did not show significant differences among ripening periods (0 to 4 weeks), indicating that springiness and cohesiveness were not significantly affected by the rice powder treatments and ripening periods (Table 3).
Sensory evaluation
Sensory scores of NSCC and RPACC are shown in Table 4. Flavor, bitterness, salty and taste intensity were the lowest scores in the 1% rice powder added cheese among all tested experimental Camembert cheeses, 3.15 ± 1.39, 3.20 ± 1.21, 4.25 ± 1.47 and 4.10 ± 1.48 respectively. The NSCCC showed higher sensory scores than 1% RPACC and some of 3 and 5% RPACC, suggesting that the NSCCC had higher characteristic sensory values of Camembert cheese compared to 1% RPACC, due to the dilution effect of the original Camembert flavor. The present study on sensory characteristics was focused on examining a possibility of production of the milder flavor Camembert cheese, where certain ethnic people in different countries, which are not familiar with the Camembert cheese flavor and looking for alternative milder flavored cheeses.
| Sensory | Treatment | |||
|---|---|---|---|---|
| Control | 1% | 3% | 5% | |
| Texture | 4.35 ± 1.15b | 3.80 ± 1.33a | 3.85 ± 1.15ab | 3.75 ± 1.48ab |
| Flavor | 4.80 ± 1.40b | 3.15 ± 1.39a | 3.95 ± 1.66ab | 3.85 ± 1.31ab |
| Bitterness | 3.35 ± 1.56NS | 3.20 ± 1.21a | 3.40 ± 1.50a | 3.85 ± 1.56 ab |
| Salty | 4.30 ± 1.10NS | 4.25 ± 1.47a | 4.40 ± 1.34a | 4.35 ± 1.24a |
| Taste intensity | 4.30 ± 1.00ab | 4.10 ± 1.48a | 4.15 ± 1.42a | 4.40 ± 1.53b |
Mean ± S.D (n=20). Means in each column with different superscripts differ significantly (p<0.05)
a-d : Menas with different superscripts in the same row are significantly different (p<0.05)
NS : Not Significant Different
Table 4: Sensory characteristics of rice powder added Camembert cheese at 4 weeks ripening.
Results of the present studies indicated that the 1% rice RPACC displayed highest viable cell counts and favorable physicochemical, textural and sensory properties among all control and rice powder added experimental Camembert cheeses. However, the NSCCC revealed greater sensory values than 1% RPACC and some 3% and 5% RPACC, indicating that the NSCCC clearly showed higher characteristic Camembert flavor values than those of 1% RPACC.
This outcome also suggests that the addition of rice powder to the Camembert cheese such as 1% RPACC can alter the original flavor of Camembert cheese. The results of our study confirmed that the production of a milder flavored Camembert cheese may be possible by addition of rice powder to the cheese milk, for those who prefer to have milder flavor cheeses.
This study was supported by research funds by Institute of Agricultural Science, College of Agriculture & Life sciences, Chungnam National University in 2017 (1870-01).
Citation: Nam SM, Nam JH, Bae CH, Renchinkhand G, Park YW (2019) Physicochemical Properties of Rice Powder Added Camembert Cheese During 4 Weeks Ripening. Adv Dairy Res. 7:229. doi: 10.35248/2329-888X.19.7.229
Received: 10-Sep-2019 Accepted: 15-Oct-2019 Published: 22-Oct-2019 , DOI: 10.35248/2329-888X.19.7.229
Copyright: © 2019 Nam SM, et al. This is an open access article distributed under the term of the Creative Commons Attribution License, which permits unrestricted use, distribution, and reproduction in any medium, provided the original work is properly cited.