Advances in dairy Research
Open Access
ISSN: 2329-888X
ISSN: 2329-888X
Research Article - (2018) Volume 6, Issue 2
One of the main cellular functions of mammary epithelial cells (MEC) is the vast production of lipids to provide the new born with the energy and bioactive molecules that are essential for its development and survival. Milk lipids are secreted in a structure termed milk fat globule (MFG) which buds from the MEC, enveloped with the cellular bilayer membrane. MFG membrane composition changes as a function of lactation stage, nutrition and MFG size. In addition, MFG size differs at different stages of lactation and in response to nutritional treatments. Therefore, it is hypothesized that the MEC membrane changes according to metabolic and hormonal signals in the animal's body, and that these changes are associated with milk lipid production and secretion and MFG size. The aim of this work was to find a suitable model for studying lipogenic activity and its relation to membrane composition in the mammary gland. Two in vitro models were compared: mammary gland tissue culture ('explants') and primary culture of MEC. Prolactin treatment increased fat concentration in the explants. In addition, conjugated linoleic acid decreased fat content, but only in the presence of prolactin. Despite these interesting results, the model was not reproducible. Cells of the primary MEC culture showed cytokeratin-18 mRNA and protein expression, which validated the culture's epithelial content. In addition, this model was prolactin-sensitive, as reflected by induction of α-lactalbumin expression in response to prolactin administration. Oleic acid induced the formation of large lipid droplets, and methionine addition to the oleic acid treatment further increased lipid droplet size. In conclusion, primary culture of bovine MEC was found as an appropriate model for studying lipogenic activity with a focus on membrane composition and lipid droplet size in the mammary gland.
Keywords: MEC primary culture; Mammary explant; Phospholipid; Membrane; Milk fat globule
MEC: Mammary Epithelial Cells; MFG: Milk Fat Globule; ER: Endoplasmic Reticulum; t-10,c-12 CLA: trans-10, cis-12 Conjugated Linoleic Acid; PE: Phosphatidylethanolamine; PC: Phosphatidylcholine; PS: Phosphatidylserine; SM: Sphingomyelin; PEMT: Phosphatidylethanolamine N-methyltransferase; SAM: SAdenosyl Methionine.
Plasma membrane composition is of major importance in the regulation of diverse cellular functions. The major constituent of the plasma membrane is phospholipids, which can be divided to glycerophospholipids and sphingolipids (in this manuscript, both will be defined as phospholipids). While glycerophospholipids are formed by the esterification of two fatty acids to glycerol backbone, sphingolipids are formed by amide bond between one fatty acid and sphingosine backbone. The predominant phospholipids in animal membranes are phosphatidylinositol, phosphatidylethanolamine (PE), phosphatidylcholine (PC), phosphatidylserine (PS) and sphingomyelin (SM). The relevance of the composition of plasma membrane to cellular functions was demonstrated in various cell types. For example, reduced SM concentration in mouse liver, skeletal muscle and adipose cells via knockout of the SM-synthesizing enzyme, sphingomyelin synthase 2, is accompanied by increased insulin sensitivity [1]. Depletion of PE via inhibition of its synthesis in Escherichia coli significantly reduces protein expression and secretion efficiency of alkaline phosphatase [2]. Specific palmitate-containing PC molecules are increased in breast tumors and are associated with cancer progression and patient survival [3]. Moreover, PC synthesis is required for very-low-density lipoprotein (VLDL) secretion in rat hepatocytes [4]. Together, these observations show that membrane composition is of great importance to cellular function, and in particular the lipid-secretion process.
Lipid synthesis and secretion make up one of the main cellular functions of mammary epithelial cells (MEC). Milk fat is secreted in a unique structure termed milk fat globule (MFG). MFG start as intracellular microlipid droplets that are synthesized between the endoplasmic reticulum (ER) leaflets and released into the cytoplasm covered with a single layer of ER membrane [5]. The microlipid droplet then migrates to the apical pole of the cell, where it is secreted into the alveoli lumen enveloped in the plasma membrane bilayer [5]. MFG size is determined prior to or during its secretion by the MEC and therefore, mechanisms contributing to the size regulation of cytoplasmic lipid droplets are relevant to the size properties of the secreted MFG. Eventually, the secreted MFG is covered with a triple layer of polar lipids, proteins and glycoconjugates derived from the cellular ER and plasma membrane. The MFG membrane changes as a function of lactation stage [6,7], nutrition [8,9] and MFG size [10]. Similarly, MFG size differs at different stages of lactation [11] and in response to nutritional treatments [8,9]. Therefore, because the MFG membrane originates from MEC membrane, it is hypothesized that the latter is controlled by metabolic and hormonal signals. Hence the general aim of this research was to study whether membrane composition is associated with lipogenic activity in the mammary gland.
To affect MEC lipogenic activity, we used two factors with known effects on milk fat synthesis: the lactogenic hormone prolactin, and the trans-10, cis-12 isomer of conjugated linoleic acid (t-10,c-12 CLA). Prolactin has an essential role in the proliferative phase of alveologenesis as well as in secretory activation; later, during lactation, prolactin acts on the luminal epithelial cells to maintain milk secretion [12]. While the effect of prolactin on galactopoiesis in ruminants is still under debate [13-16], its importance as a lactogenic hormone in in vitro models of the mammary gland has been better established. Adding prolactin to the medium of mammary gland explants from lactating cows increased DNA synthesis, fatty acid synthesis, casein synthesis and α-casein and β-lactoglobulin mRNA expression [17-19].
The metabolic factor t-10,c-12 CLA, at a dose of 10 g/day administered through abomasal infusion, reduced milk fat yield by 44% without reducing milk yield or milk protein yield. This reduction in fat content was attributed mainly to reduced de-novo synthesis of fatty acids [20], suggesting a direct effect of CLA on lipogenic activity in the mammary gland. In contrast, 45 g/day of the same CLA isomer infused directly into the abomasum significantly decreased milk, protein and lactose yields and lactose concentration, in addition to the milk fat depression [21]. It was speculated that the CLA isomer initiates dry-off mechanisms in the udder. Accordingly, in vitro , MACT cells treated with CLA show reduced cell numbers and increased apoptosis [22].
Several research models are in use for studying different aspects of the bovine mammary gland. In vivo models enable studying the intact gland at different stages of the lactation cycle, including development, lactation and involution. Although these models provide the most natural status of the mammary gland, it is hard to distinguish between the local and systemic factors affecting mammary metabolism and production. Moreover, isolation of a specific pathway or factor responsible for a specific phenotype requires complex genetic manipulations, including mammary-specific knockout, usually executed on murine models [23,24].
In vitro models enable relative isolation of the studied system. For the mammary gland, three basic in vitro models are available: mammary explants, primary culture, and cell lines. The explant model preserves the tissue structure, including cell polarity and the presence of stromal cells. In addition, lipid secretion rates are comparable to in vivo rates, as shown in a rat explant model, greatly exceeding those from mammary cells in primary culture [25]. However, the advantage of primary MEC culture and cell lines over explants is their higher percentage of epithelial cells. Among the variety of immortal bovine MEC lines, BME-UV [26] and MAC-T [27] are widely used. Practically, using a cell line model enable the utilization of the same culture numerous times with no need to renew it. However, this mode differs from the source cells with regard to molecular markers and structural properties. For example, Zavizion et al. [28] showed that the MAC-T cell line contains multinucleated cells in addition to the typical epithelial-like cells. Moreover, Arévalo Turrubiarte et al. [29] determined that MAC-T cells are predominantly of ductal/ myoepithelial origin, according to their cytokeratin expression profile. In contrast, phenotypically, primary culture cells are closer to the source epithelial cells [30,31].
Overall, there is uncertainty regarding which model is most suitable for studying lipogenesis regulation in MEC. We therefore assessed the ability to study prolactin and CLA regulation of lipogenesis and its relation to membrane composition in two in vitro models: primary culture of MEC and mammary gland explants.
Materials
DMEM/F12, RPMI and M-199 media, fetal bovine serum (FBS), penicillin, streptomycin, amphotericin B, L-glutamine solution, trypsin–EDTA solution C, and Trypan blue were purchased from Biological Industries (Beit Haemek, Israel). Bovine insulin, hydrocortisone, ovine prolactin, bovine serum albumin (BSA) solution, hyaluronidase, DNase I, heparin, and t-10 c-12 CLA were purchased from Sigma Aldrich Israel Ltd. (Rehovot, Israel). Collagenase type II was purchased from Worthington Biochemical Corporation (Lakewood, NJ).
Mammary tissue culture ("explants") preparation and experimental procedure
Mammary biopsies were collected from lactating cows in the slaughterhouse, and transferred to the laboratory in RPMI or M-199 medium containing 100 U/ml penicillin, 100 μg/ml streptomycin, 0.25 μg/ml amphotericin B, and1 μg/mL insulin. Tissue were minced with scissors to small pieces (~6 g)-"explants". Explants were placed on an impregnated lens paper floating on basic medium containing M-199 medium supplemented with insulin (1 μg/ml) and cortisol (0.5 μl/ml), and were cultured overnight at 37°C (Figure S1), ~20 explants to 5 ml culture dishes or ~10 explants to 2 ml culture dishes, depending on the specific explant weight. Then explants were cultured in the basic medium supplemented with t-10 c-12 CLA (0, 10 or 100 μM) in the presence or absence of 1 μg/ml prolactin for 72 h. The medium was changed and collected every24 h. Lipids were extracted from explants and medium, and fatty acid composition and concentration was determined by gas chromatography (GC), and membrane composition was determined by high-pressure liquid chromatography (HPLC). Experiments were repeated 5 times.
Primary culture preparation
Primary culture of MEC was isolated from mammary biopsies according to a protocol established in our laboratory [32]. Briefly, udder tissue was collected from cows in a commercial slaughterhouse. After transfer to the laboratory, tissue was minced and digested by shaking with collagenase and hyaluronidase. Cells were washed and grown in plastic culture dishes with growth medium containing DMEM/F12 supplemented with 10% (w/v) FBS, 100 U/ml penicillin, 100 μg/ml streptomycin, 0.25 μg/ml amphotericin B, 1 μg/ml insulin and 0.5 μg/ml hydrocortisone (Figure S2). The routine protocol included tissue collecting from lactating cow; however we also prepared a culture from dry gland. Thus unless indicated differently results are from lactating glands. Study protocols were in compliance with the regulations of the Israeli Ministry of Health.
Primary culture enrichment with epithelial cell
A culture that had high percent of fibroblasts was enriched by selective trypsinization by addition of 0.05% trypsin-EDTA solution to confluent heterogeneous primary culture and incubation for 5-7 min at 37°C, until approximately half of the cells are detached from culture dish. Medium without serum was added to the culture dish and cells that detached in the first trypsinization step float in the medium and removed. The cells that remained attached went through a second step of trypsinization at 37°C until most of the cells were detached. Trypsinization was stopped by the addition of fresh growth medium and the cells detached in this step were collected and seeded for further experiments.
Primary MEC experimental design
Primary MEC were plated at 150,000 cells per 60 mm plastic dish for cellular lipid extraction and RNA extraction, or at 50,000 cells per well in 6-well plates on glass cover slips for Nile red and cytokeratin staining. After overnight incubation, the medium was replaced with DMEM/F12 without serum, containing 0.15% (w/v) free fatty acids– free BSA and insulin (1 μg/ml), hydrocortisone (0.5 μg/ml) and prolactin (1 μg/ml) for 48 h to induce milk lipid and protein synthesis. Treatment medium included free capric acid (C10:0), free oleic acid (C18:1), or oleic acid +L-methionine, all dissolved in DMEM/F12 supplemented with 0.5% (w/v) free fatty acids-free BSA, insulin (1 μg/ ml), hydrocortisone (0.5 μg/ml) and prolactin (1 μg/ml).
Lipid extraction
Total lipids were extracted from explants and their medium and primary MEC. Preparation for extraction included homogenization of explants in saline by ultra-turrax, medium drying with speed-vac or lyophilization and primary cell harvesting. Then lipids were extracted as previously described [33]. Lipid extracts were dissolved in chloroform:methanol (97:3, v/v) and stored at -20°C until injection for HPLC analysis. Fatty acid methyl esters were prepared from lipid extracts by 5% (v/v) methanolic H2SO4 at 65°C for 1 h. Tubes were cooled before adding petroleum ether. After shaking double distilled water was added. Then upper layer was collected, evaporated under nitrogen stream, dissolved in small volume of petroleum ether and stored at -20°C until injection for GC analysis.HPLC analysis
HPLC analysis
HPLC separation of polar and neutral lipids was performed on a silica column (Zorbax RX-SIL, 4.6 × 250 mm, Agilent Technologies) by HPLC (HP 1200, Agilent Technologies, Santa Clara, CA) with an evaporative light-scattering detector (1200 series ELSD, Agilent Technologies). The separation protocol consisted of a gradient of dichloromethane, methanol:ammonium mix (99:1, v/v), and doubledistilled water (detailed in [33]). The separation process was managed by Chem Station software (Agilent Technologies) for the acquisition of data from the ELSD detector. The separated lipids were identified using external standards (Sigma Aldrich). Quantification was performed against external standard curves and expressed as weight % out of membrane (phospholipids and cholesterol) in the explants and as μg/106 live cells in MEC primary culture. Live cell number was determined with a hemocytometer after Trypan blue staining.
GC analysis
Chromatographic analysis was performed with a 6890 N gas chromatograph (Agilent Technologies Wilmington, DE) equipped with a fused-silica (60 m × 0.25 mm i.d., 0.25 μm film) capillary column (DB-23, Agilent Technologies) under the conditions detailed in [34]. Peak identification was based on relative retention times of two external standards. Quantification was performed against C11:0 internal standard.
Reverse transcription (RT)-PCR analysis
To analyze α-lactalbumin and cytokeratin-18 gene expression, RTPCR analysis was performed on RNA isolated from primary mammary cells by EZ-RNA II total RNA isolation kit with BCP, no chloroform (Biological Industries, Beit Haemek, Israel). Total RNA (1 μg) was reverse-transcribed using the EZ-First Strand cDNA synthesis kit for RT-PCR (Biological Industries). Primers used for PCR analysis were synthesized by Sigma (Rehovot, Israel), with the following sequences: cytokeratin -18 gene (NM_001192095.1) F: GGTCCCAGCAGATTGAGGAG R: CCCTCAGGCTGTTCTCCAAG (giving a 165-bp PCR product) (designed by Primer-BLAST software, National Center of Biotechnology Information (NCBI), http:// www.ncbi.nlm.nih.gov/tools/primer-blast/index, based on cDNA sequences published by the NCBI database); α-lactalbumin gene (NM_174378) F: AAAGACGACCAGAACCCTCA R: GCTTTATGGGCCAACCAGTA (143 bp product, [35]). PCR amplification was performed with GoTaq® Green Master Mix (Promega, Madison, WI) and PCR products were run on an agarose gels with TAE buffer. Gels were stained with ethidium bromide and visualized under UV light.
Cytokeratin-18 immunofluorescence staining
In order to determine the percentage of epithelial cells in the culture, cells were double stained for cytokeratin 18 protein expression and for their nuclei. Percent of epithelial cells was calculated as the number of positively stained cytokeratin 18 cells out of total nuclei number.
Cells grown on glass cover slips were fixed with Ethanol:Formaldehyde:Acetic acid solution (20:2:1 v/v/v) for 1 min at ‐ 20°C, and permeabilized with 0.5% Triton X-100 in PBS. Cells were blocked with 2% goat serum + 1% BSA in PBS for 1 h at room temperature. Primary antibody for cytokeratin 18 (Abcam, Cambridge, UK, diluted 1:100 in blocking solution) was added to cells and incubated overnight at 4°C. The secondary antibody, Alexa Fluor 488 goat anti mouse antibody (Abacm, diluted 1:500) was added to cells and incubated in the dark for 1 h at room temperature. Cells were stained for their nuclei with DAPI (1 μg/ml, Sigma).
Nile red staining
Cytoplasmic lipid droplets were stained with Nile red (Sigma). Briefly, cells grown on glass cover slips were rinsed three times with PBS and fixed with 4% paraformaldehyde in PBS for 20 min at room temperature. Then the cover slips were rinsed four times with PBS and stained with Nile red (200 nM, Sigma, St. Louis, MO) for 15 min. Cover slips were then rinsed three times with PBS and stained with DAPI (Sigma) for 5 min. Finally, cover slips were rinsed four times with PBS and mounted with fluorescent mounting medium (Dako, North America Inc., Carpinteria, CA).
Fluorescence microscopy and lipid droplets size measurements
Slides from Nile red and cytokeratin staining were visualized with an Olympus BX40 fluorescence microscope equipped with an Olympus DP73 digital camera using CellSens Entry software (version 1.7, Olympus). Lipid droplet diameter was measured using ImageJ software (version 1.48, NIH, Bethesda, MD). The lipid droplet diameter was marked by the "line" tool and measured by the "Measure" function in the "Analyze" menu. All lipid droplets in the cells were measured. For cell categorization the following specifications were determined - cells with at least one lipid droplet larger than 2.5 μm were designated "large lipid droplets". Cells with droplets with a diameter of less than 2.5 μm were designated "small lipid droplets". Cells with no visualized lipid droplet were designated "no lipid droplets".
All statistical procedures were performed using JMP software version 12.0.1 (SAS Institute, Cary, NC). All reported data are means ± SEM. Comparisons were made by ANOVA, and in the case of more than two treatments it was followed by Tukey-Kramer HSD test. All dependent variables were checked for homogeneous variance by unequal variances in JMP software and if the variance was not homogeneous, a Welch-ANOVA test was performed. The distribution of cell phenotypes based on lipid droplet size categories was compared by chi-square test. Significance probe was set to 0.05.
Prolactin and t-10,c-12 CLA administration to explants
Two factors with a known effect on milk fat synthesis were used to prime the tissue culture: the lactogenic hormone-prolactin, and t-10,c-12 CLA. Compared with control, prolactin increased fat content by 13% (Figure 1A). Fat increase was expressed in all fatty acids groups: saturated, monounsaturated and polyunsaturated fatty acids, as well as in the different lengths of the fatty acids, including palmitic acid (16 carbons) and medium chain (between 8 and 14 carbons) and long chain (>16 carbon atoms) fatty acids (Figure 1B). Fat secretion to the medium was elevated by 15 fold under prolactin treatment, compared with control (Figure 1C). Interestingly, CLA effect on fat secretion was dependent on the presence of prolactin in the medium. In the presence of prolactin, CLA reduced milk fat secretion in a dose response manner (Figure 1C), whereas in the absence of prolactin, CLA had no significant effect on explants fat secretion (Figure 1C). In contrast, CLA did changed membrane composition in the absence of prolactin; explants treated with 100 μM CLA and no prolactin had 14% higher cholesterol content compared with control without CLA (Figure 2A). In the presence of prolactin, 100 μM CLA affected the content of other membrane components: PS percent increased by 44% and SM percent decreased by 32% compared to medium without CLA (Figure 2B).
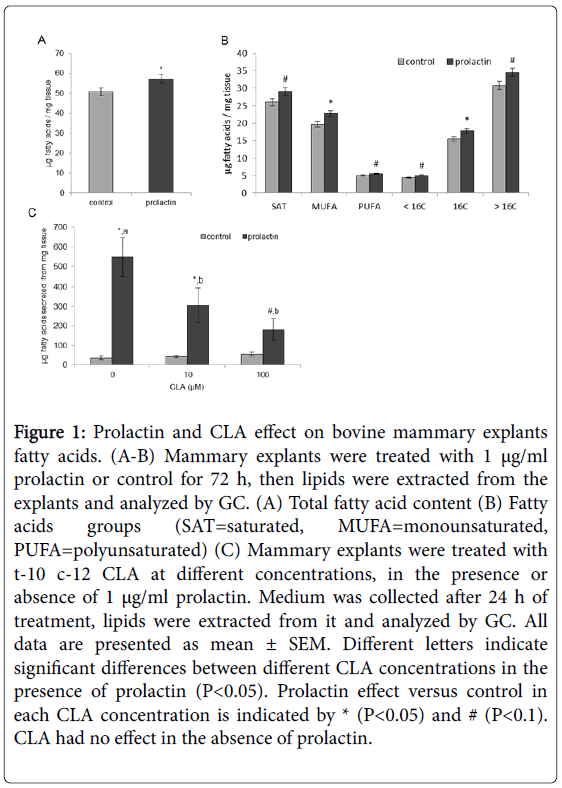
Figure 1: Prolactin and CLA effect on bovine mammary explants fatty acids. (A-B) Mammary explants were treated with 1 μg/ml prolactin or control for 72 h, then lipids were extracted from the explants and analyzed by GC. (A) Total fatty acid content (B) Fatty acids groups (SAT=saturated, MUFA=monounsaturated, PUFA=polyunsaturated) (C) Mammary explants were treated with t-10 c-12 CLA at different concentrations, in the presence or absence of 1 μg/ml prolactin. Medium was collected after 24 h of treatment, lipids were extracted from it and analyzed by GC. All data are presented as mean ± SEM. Different letters indicate significant differences between different CLA concentrations in the presence of prolactin (P<0.05). Prolactin effect versus control in each CLA concentration is indicated by * (P<0.05) and # (P<0.1). CLA had no effect in the absence of prolactin.
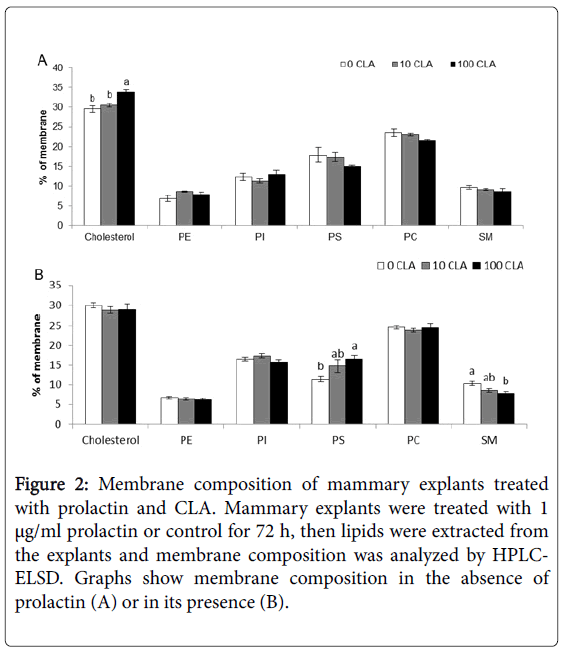
Figure 2: Membrane composition of mammary explants treated with prolactin and CLA. Mammary explants were treated with 1 μg/ml prolactin or control for 72 h, then lipids were extracted from the explants and membrane composition was analyzed by HPLCELSD. Graphs show membrane composition in the absence of prolactin (A) or in its presence (B).
Reproducibility of prolactin and CLA effect on fat secretion and composition in mammary gland explants
When experiments with prolactin and CLA were replicated, the results were not reproducible. For example, in the second replicate, fat secretion was not affected by prolactin (4.2 ± 1.6 vs 7.7 ± 4.2 μg fatty acids secreted from mg tissue in control vs prolactin, respectively, P=0.4), nor by the combined treatment of CLA and prolactin (7.7 ± 4.2 and 12.9 ± 6.2 μg fatty acids secreted from mg tissue in 0 and 100 μM CLA, respectively, P=0.5), or by CLA without prolactin (4.2 ± 1.6 and. 3.3 ± 0.8 μg/ mg tissue in 0 and 100 μM CLA, respectively, P=0.2). Regarding the explant membrane composition, CLA (100 μM) without prolactin did not increased cholesterol content as was in the first experiment; instead it decreased cholesterol percent by 15% and increased PS percent by 33%, in the fourth replicate. In contrast, in the same experiment, CLA did not change membrane composition in the presence of prolactin. Furthermore, in the fifth replicate prolactin did not increase total fatty acids content in explants, instead it tended to decrease it (50.7 ± 1.2 compared to 47.5 ± 1.0 μg fatty acids/mg tissue in control and prolactin, respectively, P<0.07).
Primary culture of MEC increase specificity of the metabolic response of mammary cells to fatty acids
To determine the presence of epithelial cells in the primary culture preparation, a specific marker of epithelial cells, cytokeratin-18 was used [36]. A marked signal of cytokeratin-18 appeared in primary mammary cells isolated from lactating cows after induction with prolactin (Figure S3). In addition cytokeratin-18 signal appeared in primary culture isolated from dry glands, after growing only with insulin and cortisol (without prolactin). In conclusion, cytokeratin signal was maintained in all conditions tested, and confirmed the presence of epithelial cells in our primary culture.
To determine the percentage of epithelial cells in the culture, cells were double stained with anti-cytokeratin 18 antibody and DAPI (Figure S2C). The percentage of epithelial cells varied between 85.1% and 64.1%.
In order to enrich a fibroblast-rich culture with epithelial cells we developed a 2-step trypsin digestion method (based on similar protocols like [37,38]). The cells that detached at the first step were mainly fibroblasts (Figure 3A), while the cells detached at the last step were mainly epithelial (Figure 3B). Thus by eliminating the fibroblast from the culture, we fundamentally enriched the culture with epithelial cells.
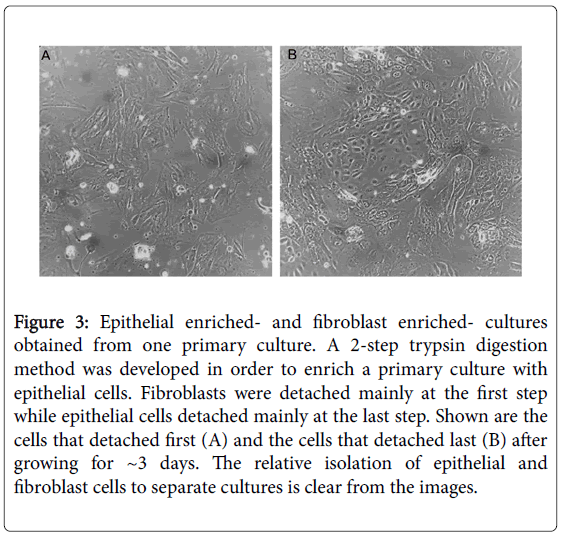
Figure 3: Epithelial enriched- and fibroblast enriched- cultures obtained from one primary culture. A 2-step trypsin digestion method was developed in order to enrich a primary culture with epithelial cells. Fibroblasts were detached mainly at the first step while epithelial cells detached mainly at the last step. Shown are the cells that detached first (A) and the cells that detached last (B) after growing for ~3 days. The relative isolation of epithelial and fibroblast cells to separate cultures is clear from the images.
Prolactin induces α-lactalbumin expression in MEC primary culture
α-lactalbumin is first and foremost a marker for the secretory activation switch in mammary gland [12,39,40]. In the present study, α-lactalbumin gene expression was determined by RT-PCR. MEC isolated from lactating and dry cows and induced with prolactin, showed a signal of α-lactalbumin gene (Figure S4). The signal appeared also in cells treated with prolactin in the presence of free fatty acids (capric and oleic acids, data not shown). α-lactalbumin expression was not detected when prolactin was missing from the culture media (Figure S4), indicating the culture sensitivity to prolactin.
Oleic acid increase lipid droplets size in a dose-dependent manner
Oleic acid is widely used to induce triglycerides and lipid droplets synthesis in various cells and organisms [41-46]. We studied the effect of the concentration of oleic acid in the culture media on lipid droplets formation in primary culture of MEC. Compared with control, 100, 360, and 720 μM oleic acid induced the formation of lipid droplets (Figure 4A-4D). The size of lipid droplets increased in a dosedependent manner, and reached a maximum at the 720 μM, with the appearance of huge lipid droplets with a diameter of over 10 μm (Figure 4D). At this concentration much of the cytoplasm was occupied by lipid droplets, and part of the cells’ nuclei appeared irregular-(Figure 4D, white arrows). At higher oleic acid concentration (1080 μM) only cells' remnants were visualized (Figure 4E). According to these results, we determined that the active range of oleic acid concentration, that maintain normal cellular appearance and cells’ viability, is between 100 and 360 μM which is in accordance with previous studies on COS7 cells [47], Huh-7 cells [43] and NIH-3T3 cells [48].
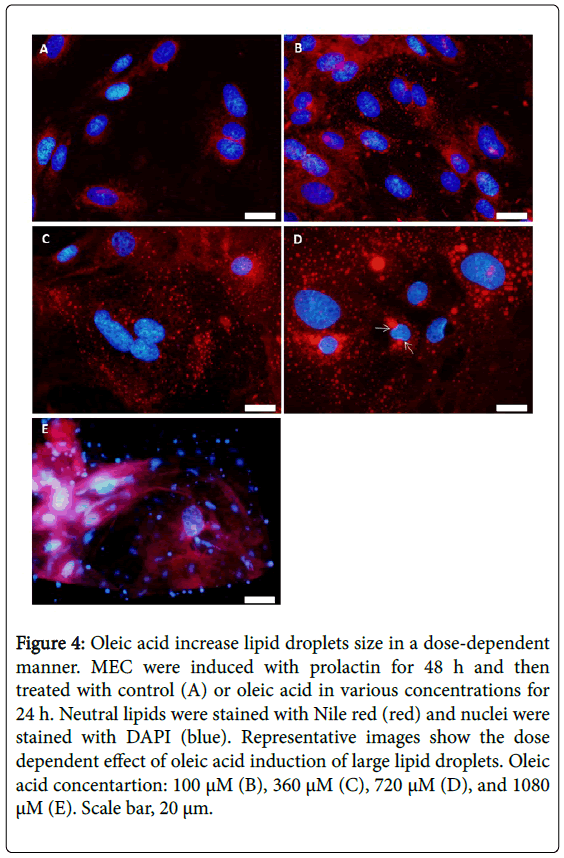
Figure 4: Oleic acid increase lipid droplets size in a dose-dependent manner. MEC were induced with prolactin for 48 h and then treated with control (A) or oleic acid in various concentrations for 24 h. Neutral lipids were stained with Nile red (red) and nuclei were stained with DAPI (blue). Representative images show the dose dependent effect of oleic acid induction of large lipid droplets. Oleic acid concentartion: 100 μM (B), 360 μM (C), 720 μM (D), and 1080 μM (E). Scale bar, 20 μm.
Variations between preparations of primary MEC cultures in their response to oleic acid treatments
The aim of the experiments was to study the variations between primary cultures of MEC from different cows, with regard to their metabolic response to oleic acid. It should be noted that each primary culture is prepared from mammary gland obtained from several animal (n ≥ 3), in order to dilute the individual variations between cows. Nevertheless, the results show that MEC cultures reacted differently when incubated with 100 μM of oleic acid for 24 h (Figure 5). Culture #1 showed a much greater number of large lipid droplets than culture #2. In addition the maximal diameter of lipid droplets differed between cultures; 5.0 and 3.7 μm for culture #1 and #2, respectively. Average diameters of the 3 largest lipid droplets also differed between cultures and were 3.4 ± 0.7 μm and 2.8 ± 0.3 μm in culture #1 and culture #2 respectively. These results suggest that oleic acid concentration should be adjusted for each batch of MEC primary culture, according to the concentration which induces the large lipid droplet phenotype.
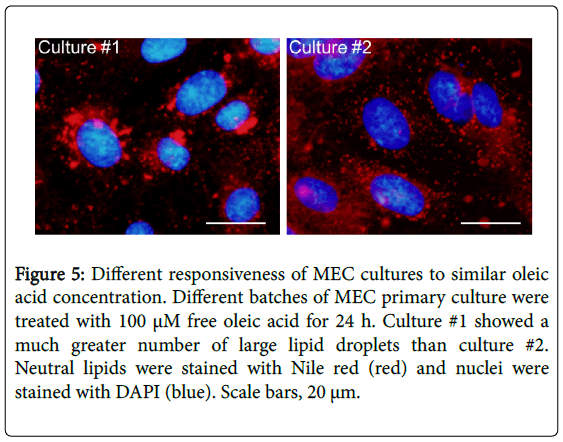
Figure 5: Different responsiveness of MEC cultures to similar oleic acid concentration. Different batches of MEC primary culture were treated with 100 μM free oleic acid for 24 h. Culture #1 showed a much greater number of large lipid droplets than culture #2. Neutral lipids were stained with Nile red (red) and nuclei were stained with DAPI (blue). Scale bars, 20 μm.
Methionine supplementation increased lipid droplets size with marginal effect on membrane phospholipids composition
The aim of the experiments was to study the connection between lipogenic activity to membrane composition in the mammary gland. Here we chose to focus on lipid droplets size as one aspect of the lipogenic activity in the mammary gland. Phosphatidylethanolamine N-methyltransferase (PEMT) use S-adenosyl methionine (SAM) as a substrate to the methylation process required to convert PE to PC. Upon addition of methionine, SAM is produced and become available as a substrate to PEMT [49]. Therefore, in this study we used methionine (200 μM) to induce PC synthesis through the PEMT pathway in cells primed with oleic acid (100 μM). Results show that methionine did not affect cellular triglycerides content (Figure 6A). With regard to membrane composition, methionine decreased PS content by 21%, but did not affect phosphatidylinositol, PE, PC and SM contents (Figure 6B). Triglycerides to phospholipids ratio was increased by 17%, however it was not statistically significant (Figure 6C). Although methionine effect on cellular lipid composition was only marginal, it largely affected lipid droplets size phenotype (Figure 6D). Methionine increased the percent of cells expressing large lipid droplets (>2.5 μm) from 24% in control cells to 41% in the methionine supplemented cells (Figure 6E, P<0.0001). In addition, the number of small (<1 μm) and large (>2.5 μm) lipid droplets was determined. Methionine largely increased the number of large lipid droplets, by 3.7 fold (Figure 6F, P<0.01), but did not affect the number of small lipid droplets (Figure 6G, P=0.6). In conclusion methionine effect was expressed mainly in lipid droplet size phenotype but not in membrane composition.
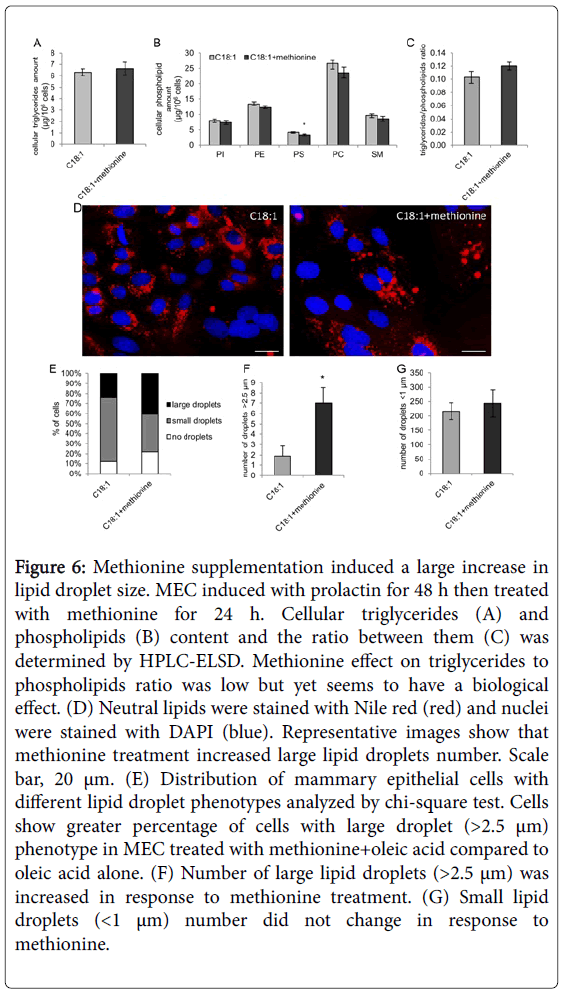
Figure 6: Methionine supplementation induced a large increase in lipid droplet size. MEC induced with prolactin for 48 h then treated with methionine for 24 h. Cellular triglycerides (A) and phospholipids (B) content and the ratio between them (C) was determined by HPLC-ELSD. Methionine effect on triglycerides to phospholipids ratio was low but yet seems to have a biological effect. (D) Neutral lipids were stained with Nile red (red) and nuclei were stained with DAPI (blue). Representative images show that methionine treatment increased large lipid droplets number. Scale bar, 20 μm. (E) Distribution of mammary epithelial cells with different lipid droplet phenotypes analyzed by chi-square test. Cells show greater percentage of cells with large droplet (>2.5 μm) phenotype in MEC treated with methionine+oleic acid compared to oleic acid alone. (F) Number of large lipid droplets (>2.5 μm) was increased in response to methionine treatment. (G) Small lipid droplets (<1 μm) number did not change in response to methionine.
Two main experimental in vitro models of the mammary glandmammary tissue culture (explants), and primary MEC culture-were examined for their suitability to studying the connection between membrane composition and lipogenic activity in the mammary gland.
We found that in the explants, CLA's effect on fat secretion and membrane composition is dependent on the presence of prolactin. This is in accordance with Liu et al. [50], who showed that in BME-UV cells, isocitrate dehydrogenase expression is inhibited by CLA only in the presence of prolactin. Isocitrate dehydrogenase plays a central role in cholesterol and fatty acid synthesis by providing NADPH [50]. Therefore, it is proposed that CLA action opposes that of prolactin, and the hormonal background of CLA should be taken into account.
Different preparations of mammary explants responded differently to prolactin treatment. In ruminants, it has been suggested that prolactin's effect on milk production, specifically on fat synthesis, is dependent on lactation stage. Administration of bromocriptine, a dopamine agonist that inhibits prolactin secretion, reduced milk yield in rats [51] and in women [52], whereas in ruminants the inhibitory effect was significantly greater at the beginning of lactation compared to established lactation [13-16]. The effect of CLA has also been shown to differ in early versus established lactation [53], and these findings imply that the low reproducibility of the results is due to the fact that we could not control lactation stage in our explant preparations. Additional basic factors that were not controlled were the genetic background of the cows, their diet composition and their parity number; all might impact mammary gland cellular composition or epithelial cell function [9,54,55] and hence contribute to the discrepancies between experiments.
In this regard, tissue composition in terms of adipocytes, fibroblasts and epithelial cells differs among explants, contributing to the large variance between preparations. M.
mRNA and protein expression ofcytokeratin-18, a well-accepted MEC marker [57]. PCR amplification and immunocytochemical staining are common methods of cytokeratin detection [30,58,59].
Primary culture of MEC was found to be sensitive to prolactin, as α-lactalbumin signal was detected only in its presence. This phenomenon has been conserved throughout mammalian evolution, as evidenced by a study in rabbit primary mammary cell culture in which α-lactalbumin synthesis and secretion were prolactin-dependent [60]. The association between α-lactalbumin and lactation performance is still not clear. In lactating cows, an increase in the concentration of α-lactalbumin in milk following prolactin injection was not associated with an increase in yields of milk or milk solids (fat, lactose and protein, [61]). On the other hand, α-lactalbumin concentrations in milk and in mammary tissue have been found to decrease with decreasing milk production [13].
After confirming that the primary MEC culture responds in the expected manner to exposure to prolactin, we explored the possibility of studying the association of membrane composition to the cells' lipogenic activity. We focused on intracellular lipid droplet size, as it is the precursor of MFG [5]. Intracellular lipid droplets can fuse with each other and hence grow in size, and it has been suggested that this fusion is regulated by the composition of membrane phospholipids [33,62].
Here, methionine was used as a tool to induce differences in membrane composition and consequently, lipid droplet size. The methionine treatment was administered together with oleic acid, since the latter induces lipid droplet formation in a dose-dependent manner in primary MEC culture, as shown herein. Methionine is the precursor of the PEMT substrate, SAM, and it has been shown to alter the concentration of SAM in perfused liver [49]. In addition, incubation of primary hepatocytes with 100 μM methionine doubled the rate of PEto- PC conversion [63]. In the current study, addition of methionine to the culture media had only a marginal effect on cellular phospholipid concentrations. This might be because the commercial medium used in this study contains methionine as an essential amino acid, in a sufficient level to support cellular function. Nevertheless, methionine treatment changed lipid droplet size, expressed as an approximately fourfold increase in the number of large droplets (Figure 6F). Since membrane composition was not altered, a change in lipid droplet fusion rates was not expected between treatments. Nonetheless, methionine increased the ratio of triglycerides to phospholipids, which we have found to be highly correlated with the secretion of larger MFG in milk [7]. Since membrane synthesis may be a limiting factor in the biosynthesis of lipid droplets [64], a reduced amount of phospholipid compared to triglyceride might explain the increased lipid droplet size under the methionine treatment.
It should be noted that the strategy of methionine addition was not useful for studying the connection between membrane composition and lipogenic activity in MEC. This is because the effective methionine concentration lies within a relatively narrow range, and since methionine is an essential amino acid, treatment without methionine may have devastating effects on basic cellular functions [65].
Primary MEC culture was found to be a suitable model for studying the association between lipogenic activity and membrane composition in MEC. The MEC content was validated, and the culture was found to be sensitive to prolactin. In addition, lipid droplets were biosynthesized abundantly and in different sizes, suggesting that this model can be used to study the role of membrane composition in regulating lipid droplet size in these cells. Use of this tool in future studies on milk lipid biosynthesis should contribute to our understanding of the mechanisms regulating MFG size, and the implications for milk composition and health effects.