Advances in dairy Research
Open Access
ISSN: 2329-888X
ISSN: 2329-888X
Commentary - (2018) Volume 6, Issue 2
Terroir is a term in the United States that has come to be known as “taste of place.” It builds off the idea that a food’s organoleptic properties are defined by the environment, climate, and production practices. The impact of terroir and heat treatment to flavor composition of Oregon cheddar were explored. Milk was sourced from three individual farms, and two commingled sites in different eco-regions of Oregon. Dairy farms were selected with similar herds and similar farm management styles. Collection of milk occurred within a four week period while the Jersey herds were on a pasture-based diet. Cheddar was produced with raw and low-temperature long-time (LTLT) pasteurized milk at Oregon State University. Cheddar was aged at 5°C and two samples per cheese were extracted at five and nine months of aging. Flavor compounds were analysed using Gas-Chromatography Mass-Spectrometry (GCMS). At five and nine months 45 and 30 flavor compounds were identified respectively, consisting of acetates, alcohols, aldehydes, alkanes, alkenes, esters, fatty acids, ketones, lactones, nitrogen compounds, sulphur compounds, and terpenes. Principle component analysis (PCA) was performed. At both time points, samples separated based on milk source location, while the impact of heat treatment was inconclusive. Results suggest that the flavor composition of cheddar is impacted by milk sourcing and suggests that terroir may contribute to the characterization of a Cheddar cheese.
Keywords: Terroir; Pasteurization; GCMS; Commingled; HS-SPME
The concept of terroir has long been used as a strategic marketing tool for artisanal food products. The French term is often associated with products such as wine, coffee beans, olive oil, spirits, and cheese, which encompass the region where they are produced [1-3]. There are many contextual approaches to terroir, including territorial, identity, promotional, legal, and agro-terroir [4]. The unifying concept is that the unique qualities of the product are a result of the physical environment, climate, and production practices. Movements within the U.S. have popularized the phrase “taste of place”. Artisan cheese makers in the U.S. have started to use the term terroir to help define the distinctive characteristics of their products. Unlike terroir in France, in which the region plays the main role, the application of terroir in the United States has expanded to also focus on the individualism of locally produced food products [5], thereby connecting to individual farms rather than regions.
The basis of terroir in cheese begins with the milk that is produced within the environment. The physical features of a region, especially soil and climate, can select for the variety and composition of vegetation that grow there [6] investigated the impact of soil in distinct regions on the sensory characteristics of Comté. The study found that the soil variations between homogenous regions corresponded to the variations in sensory characteristics of the cheese. Climate also has shown to effect milk production. Temperature and seasonal shifts alter the physiology of the animal, resulting in shifts in fat, protein, and fatty acid composition in the milk [7,8]. Furthermore, climate, just like soil, has the ability to influence the pasture flora [9]. examined the impact of two highly similar pastures, which were primarily composed of a single plant species, with the exception of sunshine exposure and orientation, on the composition of Asiago cheese. They found that small disparities in pasture biodiversity were enough to affect the rumen environment and cause differences in aroma composition.
Pasture composition can play an important aspect to terroir since it often serves as an important component of the feed for the animal. Major cheese producer associations (e.g. Comté, Parmigiano- Reggiano) have strict rules about the use of milk from pasture-fed cows that provide linkage to the region [10,11] found that it was feasible to determine the region of origin of Emmental cheese based on volatile compounds using an electronic nose. Additionally, feed is linked to milk aromatic composition. Milk from cows fed exclusively on pasture, as opposed to a total mixed ration, have been shown to have different sensory and aroma compound profiles [12-15]. Additionally, animal breed and physiological conditions can affect the gross composition and volatile profile of the milk and resulting cheese. For a detailed review of the impact of ruminant management practices on sensory parameters of cheese [16]. Commingling, which is the practice of mixing raw milk sources both in the milk truck and processing silos, has long been the established industry tool for overcome variability due to milk sources.
Extensive research has been published on Cheddar cheese as a result of its popularity. Cheddar cheese is the second most consumed cheese in the U.S [17]. Several sensory studies have been conducted that show regional flavor differences in Cheddar cheese [18] used a trained panel to compare the flavor of pasteurized Cheddar cheeses (5-24 months) from Ireland, New Zealand, and the United States. Descriptive analysis showed that there were characteristic differences between the countries of origin. Furthermore, Drake et al. [19] investigated regional flavor differences of specific U.S. Cheddar cheeses. Samples were taken from large commercial facilities around the U.S. that employed stirred-curd or milled-curd make procedures. Trained, descriptive sensory panels found flavor differences between regions and manufacturing procedures. These studies did not attempt to control all cheese making variables, but rather to establish that regional and international flavor differences exist in Cheddar cheese. Cheeses from this study underwent previous sensory analysis [20]. Cheddar cheese consumers found both milk source and commingled milk effected the taste of cheese at 5 and 9 months and that as cheese aged (at 9 months) a strong heat treatment effect was seen.
The purpose of this study was to expand upon the found sensory differences previously found and examine the potential impact of terroir and pasteurization on flavor composition of Cheddar cheese. Specifically, we tested the following hypothesis:
A. Milk collected from the same farm on different days within a season will produce cheese with similar flavor composition.
B. Milk collected from farms located next to each other will produce cheeses that have similar flavor composition while being different to cheese produced with milk from a farm at a significant distance away (assuming all farms have similar herds and use similar farm management techniques).
C. Commingling of milk sources will overcome differences due to regional differences.
D. Raw milk cheeses from different milk sources will be more different than corresponding pasteurized milk cheeses.
An improved understanding of the impact of milk sourcing is important to artisan cheese makers who need to market unique qualities of their products. However, it is equally important for large scale cheese companies with multiple manufacturing locations as they need to control and mitigate finished product variability due to different milk sources.
Milk collection
Milk was collected from 5 locations around the state of Oregon over a 4-week period in early fall, 2013. Milk was collected within the Coast Range, Columbia Plateau, and Willamette Valley ecoregions from dairies that had predominantly Jersey herds on a pasture-based diet. Milk was collected from a commingled location from the Region 1, the Coastal Range (R1), and Region 2, the Columbia Plateau (R2), along with three individual dairy farms within the Willamette Valley F1, F2, and F3. The F1 and F2 sites were separated by less than 5 km, with F3 situated 80 km away (Figure 1). Milk was collected from the F3 site at two dates (F3.1, F3.2) to assess reproducibility. The collection scheme allowed the assessment of the effect of intra-region and inter-region sourcing, as well as, the impact of commingling milk (Table S1).
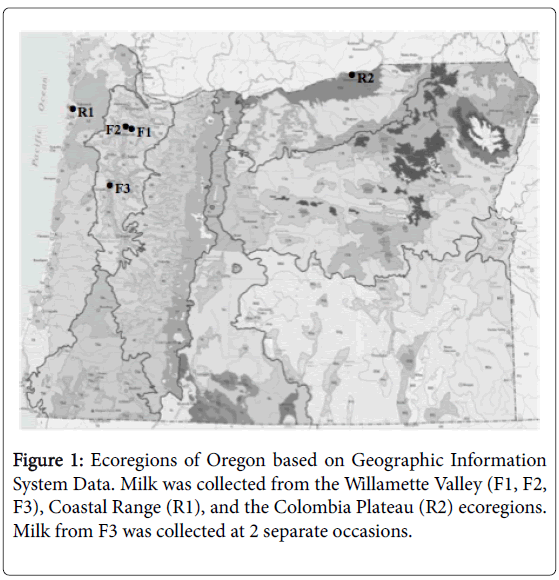
Figure 1: Ecoregions of Oregon based on Geographic Information System Data. Milk was collected from the Willamette Valley (F1, F2, F3), Coastal Range (R1), and the Colombia Plateau (R2) ecoregions. Milk from F3 was collected at 2 separate occasions.
Raw milk (250 kg) was collected directly from the farm bulk tanks or tanker truck at the commingled sites after storage for less than 48 h. The milk was kept below 4.4°C [21] during transportation to the Arbuthnot Dairy Center (Oregon State University; Corvallis, OR) where it was held at 2°C for no greater than 24 h prior to manufacture.
Cheese manufacture
Cheddar cheeses were manufactured at the Arbuthnot Dairy Centre. The process and formulation were adapted from and described in detail [22].
Milk from each location was made into separate raw milk Cheddar cheese (R) and pasteurized milk Cheddar cheese (P) batches. The sealed cheeses were stored at 5°C. Cheeses were rotated once a week to mitigate any temperature gradient within the storage chamber.
Gas chromatography-mass spectrometry of flavor compounds
The methodology used was adapted from [23] and optimized for the study. Headspace solid-phase microextraction (HS-SPME) gas chromatography-mass spectrometry (GC-MS) was conducted on cheese samples at 5 months and 9 months into aging. Samples were run on a Shimadzu GC-MS-QP2010 (Shimadzu Scientific Instruments Inc., Columbia, MD) equipped with a CTC Combi-Pal autosampler fitted with a stack cooler (CTC-Analytics AG, Switzerland). The outer 2 cm of each cheese was removed to mitigate any possible light exposure and packaging migration into the cheese. Duplicate plugs were pulled from each cheese. Each plug was finely shredded and 2 g were placed into 20 ml amber headspace screw thread vials and sealed with Polytetrafluoroethylene/Silicone septa. Prepared samples were held at 8°C prior to sampling. All samples were run in duplicate and a control was run every 6-8 vials to assess repeatability, reproducibility and account for any retention time (RT) shifts.
Extraction was conducted using a Divinylbenzene/Carboxen/ PolyDimethylsiloxane fiber (50/30 μm film thickness, Supelco, Bellefont, PA). This tripolar fiber was chosen for the wide range of extractable compounds. Prior to sampling, the fiber was conditioned in nitrogen for 10 min at 250°C. Samples were incubated and agitated for 10 minutes at 40°C and exposed to the SPME fiber at 40°C for 60 minutes. Following extraction of the headspace volatiles the SPME fiber was desorbed in the GC injection port at 250°C for 10 minutes operating in splitless mode.
Compounds were separated using the chromatography configuration containing dual columns in series: RTX-wax column (30 m x 0.25 mm ID x 0.5 μm film thickness, polyethylene glycol, Restek, Bellefonte, PA, USA) and Rtx-5MS column (30 m x 0.25 mm ID x 0.25 μm film thickness, 5% Diphenyl/95% Dimethyl polysiloxane, Restek). The GC used helium as the carrier gas set at a linear velocity of 30 cm sec-1. The GC oven temperature was held at 35°C for 5 minutes, ramped to 230°C at 4°C minute-1, and then held at this temperature for 10 minutes.
The interface and MS source temperatures were set at 230°C and 200°C, respectively. The MS source operated in electron impact mode at ionization energy of 70 eV. The MS program was set to full scan mode with a mass acquisition from m/z 33-303 and an event time of 0.20 s. Compounds were identified by matching their mass spectra to the NIST05 (National Institute of Standards and Technology) mass spectral library and to pure reference standards (Table 1).
| Number | Name | m/z | Ref. Ions | Standard Sourcea |
|---|---|---|---|---|
| 1 | Nitrous oxide | 44 | 45,46 | - |
| 2 | Penatne | 43 | 57,72 | Sigma-Aldrich |
| 3 | Methanethiol | 47 | 48,50 | Sigma-Aldrich |
| 4 | 2-Buten-1-ol, 3-methyl-, acetate | 43 | 42,41 | - |
| 5 | Hexanal | 44 | 56,72 | Sigma Aldrich |
| 6 | 3-methyl-pentane | 57 | 56,39 | - |
| 7 | n-Hexane | 57 | 41,43 | Sigma-Aldrich |
| 8 | Carbon disulfide | 76 | 44,78 | - |
| 9 | Dimethyl sulfide | 62 | 47,45 | Sigma-Aldrich |
| 10 | Acetone | 43 | 58,42 | Macron |
| 11 | Heptane | 41 | 71,57 | Sigma-Aldrich |
| 12 | Ethyl Acetate | 43 | 61,70 | Sigma-Aldrich |
| 13 | 2-Butanone | 43 | 72, 57 | Sigma-Aldrich |
| 14 | Ethanol | 45 | 46, 43 | Pharmco-Aaper |
| 15 | 3-methyl-butanal | 44 | 41, 58 | Sigma-Aldrich |
| 16 | 1,3-Butanediol | 43 | 72, 58 | Sigma-Aldrich |
| 17 | (E)-3-Octene | 41 | 55, 56 | - |
| 18 | 3-methyl-2-butanone | 43 | 39, 86 | Sigma-Aldrich |
| 19 | 2,3-Butanedione | 43 | 86, 42 | Sigma-Aldrich |
| 20 | 2-Pentanone | 43 | 86, 71 | Sigma-Aldrich |
| 21 | 2-Butanol | 45 | 59, 73 | Sigma-Aldrich |
| 22 | 2,3-Pentanedione | 43 | 57, 100 | - |
| 23 | Ethyl butanoate | 71 | 43, 88 | Sigma-Aldrich |
| 24 | α-Pinene | 93 | 92, 91 | Sigma-Aldrich |
| 25 | 22-Dimethyl-undecane | 57 | 56, 112 | - |
| 26 | 2-methyl-1-Butanol | 56 | 41, 39 | Sigma-Aldrich |
| 27 | Decane | 57 | 71, 85 | Sigma-Aldrich |
| 28 | β-Pinene | 93 | 91, 69 | Sigma-Aldrich |
| 29 | 3-methyl-1-Butanol | 55 | 42, 70 | Sigma-Aldrich |
| 30 | 2-Octanone | 43 | 58, 71 | - |
| 31 | 2-Heptanone | 43 | 58, 114 | Sigma-Aldrich |
| 32 | 3-methyl-3-Buten-1-ol | 41 | 56, 68 | - |
| 33 | Ethyl hexanoate | 99 | 99, 60 | Sigma-Aldrich |
| 34 | 3-Hydroxy-2-butanone | 45 | 43, 88 | Sigma-Aldrich |
| 35 | Methyl acetate | 74 | Sigma-Aldrich | |
| 36 | 3-methyl-2-Buten-1-ol | 71 | 41, 53 | - |
| 37 | Propanoic aciD, 2-hydroxy-, ethyl ester, (S)- | 45 | 75, 46 | - |
| 38 | D-limonene | 68 | 93, 107 | Sigma-Aldrich |
| 39 | Hexadecane | 57 | 71, 85 | Sigma-Aldrich |
| 40 | 2,6-Dimethyl-pyrazine | 108 | 42, 40 | Sigma-Aldrich |
| 41 | 2-butoxy-ethanol | 57 | 45, 87 | - |
| 42 | Acetic acid | 43 | 45, 60 | Sigma-Aldrich |
| 43 | 2-Nonanone | 58 | 43, 59 | - |
| 44 | Ethyl octanoate | 88 | 57, 101 | Sigma-Aldrich |
| 45 | Isobutyric acid | 43 | 73, 88 | Sigma-Aldrich |
| 46 | 2,3-Butanediol | 45 | 57, 47 | Sigma-Aldrich |
| 47 | 3-methyl-2-Butanol | 73 | 43, 57 | - |
| 48 | Butanoic acid | 60 | 41, 42 | Sigma-Aldrich |
| 49 | Isovaleric acid | 60 | 41, 87 | Sigma-Aldrich |
| 50 | Pentanoic acid | 60 | 41, 101 | - |
| 51 | Hexanoic acid | 60 | 73, 41 | Sigma-Aldrich |
| 52 | Phenethyl alcohol | 91 | 92, 122 | Sigma-Aldrich |
| 53 | Octanoic acid | 60 | 55, 101 | Sigma-Aldrich |
| 54 | 2H-Pyran-2-one, tetrahydro-6-pentyl- | 99 | 71, 42 | Sigma-Aldrich |
aDetected compounds that were verified with a standard are listed by the supplier
Table 1: GC-MS analysis parameters for determination of volatile compounds using SIM.
Data analysis
Identified compounds chromatographic peak areas for each sample were corrected for weight and used as statistical variables. Restricted maximum likelihood (REML) was conducted to estimate the variance of the means between the effect of location and the interaction of location and thermal treatment. Tukey multiple comparison post-hoc tests were used to determine which samples were significantly different among locations and the interaction between location and treatment.
Principal component analysis was conducted to assess the contribution of the detected compounds in the cheeses at 5 and 9 mo. Compounds that were not found to be significantly different in the location by treatment interaction (supplementary data) and compounds with no known aroma potential in Cheddar cheese were excluded from PCA analysis. All statistical analysis were performed using XLStat version 2014 6.01 (AddinsoftTM, New York, NY USA).
GCMS of flavour compounds
Identification of volatile compounds: A total of 54 volatile compounds were detected across all cheese samples (Table 2). The compounds consisted of 12 alcohols, 9 ketones, 7 alkanes, 7 fatty acids, 6 esters, 3 terpenes, 2 aldehydes, 2 nitrogen compounds, 3 sulfur compounds, 1 acetate, 1 alkene, and 1 lactone. The number of detected compounds in the 5- mo and 9-mo samples were 46 and 30, respectively. Significant differences were found in location and location x treatment at 5 mo and 9 mo.
| Flavor Compounds | Age | Aged |
|---|---|---|
| 5 Months1 | 9 Months2 | |
| Acetate | X | |
| Alcohols | X | X |
| Aldehydes | X | |
| Esters | X | |
| Ketones | X | X |
| Pyrazine | X | X |
| Terpenes | X | X |
| Volatile Fatty Acids | X | X |
| Volatile Sulfur | X |
1: All cheeses aged for 5 months
2: All cheeses aged for 9 months
Table 2: Chemical categories of measured volatile compounds in cheddar cheese.
At 5 mo, no significant differences were found for n-butanol, 22- Dimethyl-undecane, hexadecane, 2-pentanone, and propanone. A significant (α=0.05) location effect was found for 3-methyl-3-buten-1- ol and ethyl hexanoate. A significant (α=0.05) location by treatment interaction was found for 2-butoxy-ethanol, 3-methyl-butanal, heptane, pentane, ethyl acetate, ethyl octanoate, methyl acetate, 2,3- butanedione, 3-hydroxy-2-butanone, carbon disulfide and methanethiol. Both a significant (α=0.05) location effect and location by treatment effect were found for prenyl acetate, 2,3-butanediol, 2- butanol, ethanol, 3-methyl-1-butanol, 3-methyl-2-buten-1-ol, benzyl alcohol, 4-hydroxy-4,2-methyl-pentanone, hexane, 3-methyl-pentane, E-3-octene, ethyl butyrate, ethyl-2-hydroxy-propanoate, acetic acid, butyric acid, hexanoic acid, octanoic acid, 2-butanone, 2-heptanone, 2- nonanone, 3-octanone, 2,3-pentanedione, δ-decalactone, 2,6- dimethylpyrazine and dimethyl disulfide.
At 9 mo, no significant differences were found for octanal and 2,3- butanediol. There were no compounds that only had a location effect at 9 months. Significant (α=0.05) location by treatment interactions were found for heptane, 3-methyl-pentane, ethyl acetate, ethyl butyrate, acetic acid, hexanoic acid, octanoic acid, 2,3-butanedione, ethanol, 2- butanone, and 3-hydroxy-2-butanone. Both significant (α=0.05) location effects and location by treatment interactions were found for decane, 22-dimethyl-undecane, hexane, butyric acid, isobutyric acid, isovaleric acid, pentanoic acid, 3-methyl-1-butanol, phenethyl alcohol, 2-butanol, 1,3-butanediol, α-pinene, 2-pentanone, propanone, 2,6- dimethyl-pyrazine, carbon disulfide, and D-limonene.
Cheddar Cheese at 5 Month of Aging
At 5 mo of aging, Factor 1 and 2 of the PCA contributed 53.37% of the variance (Figure 2). The R2, F3, and R1.R (raw cheese from Region 1) cheeses were clearly differentiated into separate groups. The loading plot (Figure 2) shows that the R1.R cheese contained a greater number of unique flavor compounds than the other cheeses which included acetic acid, butanoic acid, ethyl butanoate, ethyl hexanoate, ethyl octanoate, hexanoic acid, octanoic acid, methanethiol, and tetrahydro-6-pentyl-2H-Pyran-2-one. F3 cheese was characterized by acetone, 2,6-Dimethyl-pyrazine and 3-methyl-butanal. R2 cheeses were characterized by β-pinene. F1 and F2 cheeses were not as closely grouped, but were found near the center of the score plot, with both a location and heat treatment separation (Table S1). Heat treatment occurred along the Factor 1 axis, pasteurized in the negative direction and raw in the positive direction, and location differentiation along the Factor 2 axis with R2 in the positive direction and F3 in the negative direction and F1 and F2 towards the middle. The R1.P cheese did not group with the R1.R cheese which suggests a greater influence of heat treatment over milk source for this location at this degree of aging. R1.P grouped closer to the R2 cheeses than R1.R. Therefore, at 5 months both milk source location and heat treatment influence flavor composition of cheddar cheeses.
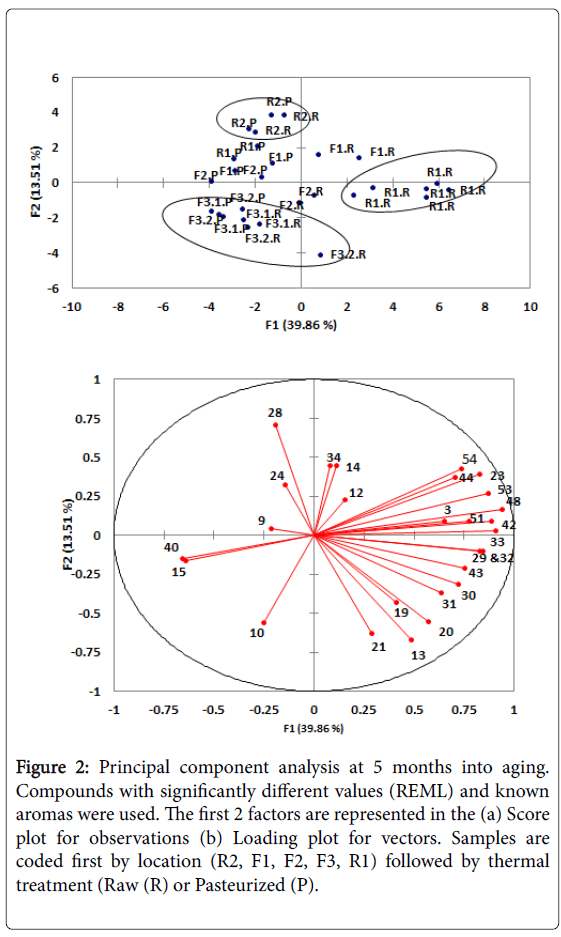
Figure 2: Principal component analysis at 5 months into aging. Compounds with significantly different values (REML) and known aromas were used. The first 2 factors are represented in the (a) Score plot for observations (b) Loading plot for vectors. Samples are coded first by location (R2, F1, F2, F3, R1) followed by thermal treatment (Raw (R) or Pasteurized (P).
Cheddar Cheese at 9 Month of Aging
At 9 mo into aging, the cumulative contribution of Factor 1 and 2 was 70.53% (Figure 3). The PCA shows R1 samples being very different from all other samples and is responsible for the majority of the differentiation. R1 cheeses were characterized by high levels of 2- butanol, 2-butanone, isovaleric acid, 2-methylpropanoic acid, 3- methyl-1-butanol, and phenylethyl alcohol. The other cheeses also show a trend based on location at 9 mo that is similar to those found at 5 mo. Moving along the Factor 2 axis from positive to negative, the locations include R2, R1.P, F2, F1, and then F3. R2 cheese were characterized by D-limonene and F3 cheeses were characterized by acetone, 2,6-dimethylpyrazine and 2-pentanone. The R1.P, F2, and F1 cheeses contain a similar number of compounds and are not characterized by any specific compounds as they are located close to point 0,0 on the PCA plot (Figure 3). There appear to be no large differences between R and P cheeses at 9 months, beyond those noted for R1.R.
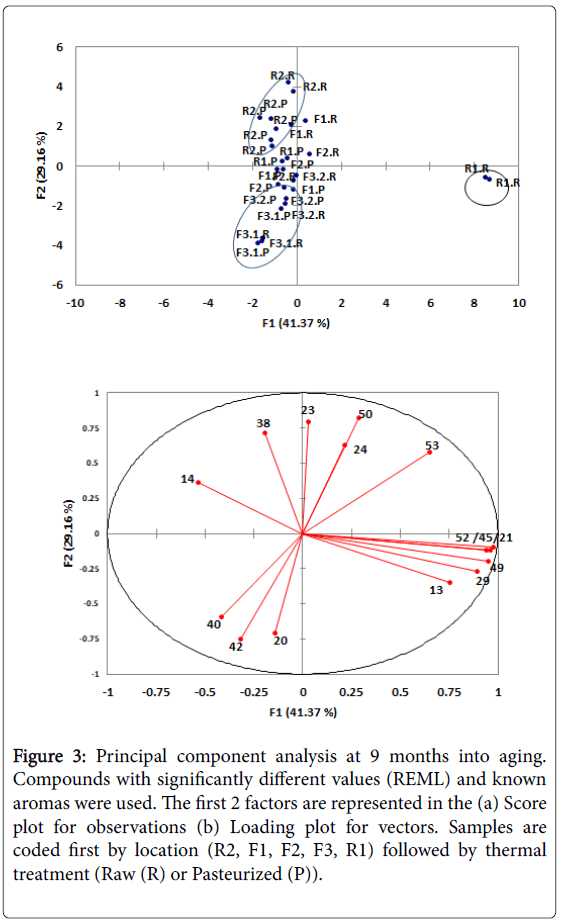
Figure 3: Principal component analysis at 9 months into aging. Compounds with significantly different values (REML) and known aromas were used. The first 2 factors are represented in the (a) Score plot for observations (b) Loading plot for vectors. Samples are coded first by location (R2, F1, F2, F3, R1) followed by thermal treatment (Raw (R) or Pasteurized (P)).
Milk collection and cheese making
The milk collected from individual farms for this study came from predominantly Jersey herds on a mostly pasture-based diet at the time of collection (early fall). The farms were specifically selected due to the many similarities among them in an attempt to control as many confounding parameters as possible such as feed and breed (Table S2). Milk quality and gross composition of cheeses is vital to assessing the impact of terroir. The proximate analysis of the cheeses showed no significant differences in gross composition among the cheeses. This is important as the major pathways for the production of aroma compounds are due to the breakdown of the four major macronutrients in the cheese; lactose, citrate, milk lipids and milk proteins [24-27], while salt content impacts flavor release [28]. Furthermore, aroma compounds have the ability to interact with fat and protein within cheese, affecting their release [29].
Flavor analysis
Impact of location (milk sourced from individual farms): F1, F2, and F3 cheeses demonstrate variation in volatile profiles based on the milk sourcing location, regardless of the thermal treatment. F3.1 and F3.2 cheeses are grouped together (both after 5 and 9 mo) away from F1 and F2, which supports hypothesis A that milk collected from the same farm on different days will produce cheese with similar flavor composition. This is essential for support of the experimental design.
Closest to the F3 cheeses are F1 and F2 cheeses which are intermixed. This is noteworthy as F3, F2, and F1 milk sources are all from the Willamette Valley. F1 and F2 cheese milk sources are the smallest distance apart, approximately 5 km while F3 is 80 km away. The 3 farms are within the same ecoregion (Figure 1), but there are clear differences with F3 having 9.5 cm of additional average precipitation per year and more clay in the soil [30,31]. The similarities between F1 and F2 and dissimilarities to F3 (both after 5 and 9 mo of aging) support hypothesis B that milk collected from farms located next to each other will produce cheeses that have similar flavor composition while being different to flavors of cheese produced with milk from a farm at a significant distance away; assuming all farms have similar herds and use similar herd management techniques (Table S2). This observation is consistent with results for which involved sensory analysis of the same cheeses. Consumers grouped F1 and F2 cheeses together while F3 cheeses were grouped separately.
Impact of heat treatment (milk sourced from individual farms)
F1 and F2 cheeses show a clear milk source by heat treatment interaction at 5 mo, but F3 did not. Pasteurized cheeses for F1 and F2 are found primarily in the negative Factor 1 and positive Factor 2 direction (Figure 2). Raw milk cheeses for these sources are located more in the positive Factor 1 direction. Heat treatment is known to alter the flavor composition of the cheeses [32-34]. At 9 months, the impact of heat treatment is even less pronounced (Table S3). Thus, our study provides inconsistent support for the hypothesis that raw milk cheeses from different milk sources will be more different than corresponding pasteurized milk cheeses.
Impact of location for cheeses made from commingled milk
Region 1 and Region 2 are over 376 km apart. Region 1 is a coastal zone with significant precipitation while Region 2 is semi-desert with temperate climate and little precipitation. Commingled milk was collected from these two very different regions to evaluate if commingling could overcome potential impact of location. R1.P, R2.R, and R2.P group relatively closely together, especially at 9 mo and especially for the pasteurized cheeses. R1.R is clearly grouped apart at both aging times although especially after 9 mo aging. R1.R is also characterized by most of the listed flavor compounds. Although our experiment was not designed to determine causation, we speculate that this significant impact due to pasteurization could be associated with destruction of non-starter lactic acid bacteria and denaturation of native milk enzymes. However, for example, R1.R cheeses are characterized based on free fatty acid composition [35] reported that Cheddar cheeses made from pasteurized milk contained half the amount of free fatty acids than those made from raw milk (Table S3). This is likely due to the reduction of lipoprotein lipase, which may be denatured by pasteurization [36]. Overall, our data supports Hypothesis D that commingling of milk mitigates differences due to location of milk sourcing. However, this was only valid for pasteurized milk.
Impact of aging (all cheeses)
As the cheese was aged from 5 to 9 mo, the impact of location (along factor 2) did not change greatly. However the compounds that differentiated cheese at 5 months and 9 months were different as anticipated. Isovaleric and isobutyric acid area associated with sharp cheddar flavors [37] and 2-pentanone is also considered important for cheddar flavor [38,39]. In addition, the overall impact of pasteurization was reduced for the aged cheeses (along factor 1) with the exception of R1.R. This is not consistent with (20) who found that the cheddar cheese consumers could differentiate raw versus pasteurized cheeses at 9 month. There are several possibilities for this conflicting result (Table S4). Our analysis investigated the larger volatile components of cheese and additional analysis using SAFE that show as more trace volatile components or including additional nonvolatile composition may better agree with the previous sensory results. Cheese is complicated mixture and we have yet to fully understand the flavor composition that can link to sensory perception.
Impact of terroir
This study demonstrated that when consistent cheese making procedures were followed volatile composition of cheeses are attributable to milk source. This does not necessarily mean that the differences observed are due to terroir (Table S4). It is possible that the dairy farmers used unique herd management techniques or utilized different feeds that subsequently impacted cheese flavor. Although we attempted to control for these differences, we did not attempt to step in and modify management procedures at the individual farms thus some differences persisted. However, all milk sources were from pastured herds and pasture identity should be considered a terroir related parameter. Several of the flavor compounds that separated the cheeses in the PCA such as α-, and β-pinene, and terpenoid compounds have been linked to forage in the cow’s diet [40,41].
Our study demonstrates that milk from neighboring farms will likely produce cheeses that have relatively similar aroma profiles while cheeses made with milk from farms that are far apart will have more different aroma profiles. Additional research is needed to confirm these results, as well as determine if these differences occur throughout the year. This research also confirmed that the industry practice of producing cheese with commingled and pasteurized milk can mitigate flavor differences due to different milk sourcing even for milk originating in different eco-regions.
The Charles E. and Clara M. Eckelman Endowment supported this project. The authors thank Tillamook County Creamery and Jamie Bansen for providing milk and Utah State University for sharing technical expertise on the Cheddar making process.
This article does not contain any studies with human or animal subjects performed by any of the authors.
E.Tomasino: Assisted with conducting flavor analysis and analysis of data. Contributed to writing of manuscript
G. Turbes: Prepared the cheeses and prepared samples for flavor analysis. Assisted with writing of manuscript
J. Lim: Assisted with design of study and execution of study
J. Waite-Cusic: assisted with study design and preliminary analysis
L Meunier-Goddik: Assisted with cheese making and writing