Advances in dairy Research
Open Access
ISSN: 2329-888X
ISSN: 2329-888X
Research Article - (2018) Volume 6, Issue 2
Despite using ozone (O3) as an attractive alternative disinfectant for more than a century, little is known about the killing capacity of O3 against Salmonella contaminated different surfaces in dairy operations. Accordingly, our objective was to characterize the killing capacity of aqueous and gaseous O3 at different operational conditions on Salmonella Typhimurium and Salmonella Choleraesuis (aSTC) contaminated plastic, metal, nylon, rubber, and wood surfaces. In a crossover design, 14 strips of each material were randomly assigned between 3 groups, treatment (n=6), positive-control (n=6), and negative-control (n=2). The strips were loaded with aSTC (107-108) and exposed to aqueous O3 of 2, 4, and 9 ppm for 4 minutes, and gaseous O3 of 1 and 9 ppm for 30, 60, and 120 minutes. Plastic and metal surfaces were most effectively decontaminated, an aqueous O3 of 4 ppm reduced aSTC by 6.7 and 5.2- log10, respectively, and 9 ppm resulted in no detectable aSTC. On nylon and rubber, aqueous O3 of 9 ppm reduced aSTC population to a safe level (5.8 and 5.1-log10). On wood, both aqueous and gaseous O3 at up to 9 ppm were unable to reduce aSTC to undetectable limit. Interestingly, aSTC load and sequential washing showed same impacts on the reduction rate of aSTC on complex surfaces. Our findings strongly indicate that aqueous O3 of 9 ppm for 4 minutes exposure is an effective means to clear smooth surfaces of a high Salmonella load. However, sequential washing or decrease the bacterial load is needed to effectively decontaminate complex surfaces.
Keywords: Aqueous ozone; Gaseous ozone; Salmonella; Surface roughness; Sequential washing
Salmonellae are the foremost of the foodborne zoonotic pathogens, widespread among animal and humans worldwide [1]. Approximately 94% of Salmonella infections in humans are foodborne via direct or indirect animal contact. The fecal wastes from infected animals and humans are important sources of bacterial contamination of the environment and the food chain [2]. Previous studies estimated approximately 93.8 million human cases of gastroenteritis and 155,000 deaths due to Salmonella infection around the world each year [3]. In the USA, Salmonella is the most commonly reported bacteriological agent of human foodborne disease causing approximately 1.4 million annual cases of food-borne salmonellosis were estimated by the CDC, 5,000 hospitalizations and more than 400 deaths [1]. In Europe, salmonellosis is considered the most common zoonosis, approximately 168,929 human cases [4]. Accordingly, Salmonella has a great impact on health and economic in both humans and animals. The annual economic costs from salmonellosis are approximately $3.7 billion [5].
In previous studies, a 5-log10/g reduction in critical manure-based pathogen levels is considered a safe level for farm biosecurity improvement and prevention of infectious diseases [6,7]. In cattle, clinically infected animals shed approximately 108 organism/g feces and to produce consistently Salmonella typhimurium infection by the oral rout, infectious doses of 106-1010 organisms are needed [8]. Several detergent and chemical disinfectants can be used effectively in the dairy operations, but all the methods are faced with challenges, such as they last for several hours and most of them can be toxic before and after the breakdown [9]. Accordingly, the utilization of other disinfectants with strong killing capacity and have a short half-life and decompose to nontoxic molecules become an urgent need for farm hygiene and biosecurity.
Ozone is among the most powerful oxidants known with oxidative potential of 2.07 volts, nearly twice the oxidizing potential of chlorine [10]. Because of its strong oxidation potential, O3 is very effective toxic to bacteria even at concentrations as low as 0.01 ppm [11]. The half-life of O3 in distilled water is 20-30 minutes at 20°C.
However, gaseous O3 is more stable with half-life of approximately 12h in atmospheric air [12]. Aqueous O3 can directly react with the dissolved organic compounds or can generate radical species such as a hydroxyl radical (OH¯) that have more oxidative potential (2.83 volts) than O3 [13]. Ozone is toxic to bacteria in three independent pathways 1) it causes cellular rupture by disrupting glycoproteins and glycolipids in the cell membrane, 2) it disrupts normal cellular enzymatic activity and cell function by altering the sulfhdryl groups of certain enzymes and 3) damages cellular DNA by disrupting purine and pyrimidine bases of nucleic acids [11,14]. The antimicrobial capacity of O3 not includes only bacteria, but molds, viruses, and protozoa [15,16]. Therefore, O3 is a powerful disinfectant across a broad range of microbes.
Ozone has been extensively used for treating municipal drinking water since 1906 [17], and in many commercial food applications [16]. The success of O3 in the decontamination of water with a broad range of microbes, make the gaseous O3 an effective way to inactivate the microbial growth in conditioning systems and areas that are inaccessible to ultraviolet light [18]. Also, gaseous O3 has been recommended as an alternative to reduce microbial populations and increase the shelf life of fruits and vegetable [19]. Several earlier studies reported a significant reduction in Salmonella after exposure to O3 [17,20,21]. However, few data exist describing the optimal operational conditions of O3 to decontaminate the Salmonella contaminated surfaces. Accordingly, the primary objective of the present study was to characterize the killing capacity of aqueous and gaseous O3 at different operational conditions on multiple Salmonella Typhimurium and Salmonella Choleraesuis (aSTC) contaminated surfaces (plastic, metal, nylon, rubber, and wood). To our knowledge, no data exist investigating the effects of sequential washing, volume of aqueous O3, and bacterial load on the rate of Salmonella reduction due to exposure to aqueous O3. The secondary objective was therefor to use univariate linear regression to determine the effects of sequential washing, volume of aqueous O3, and bacterial load on the Salmonella killing capacity of aqueous O3.
Preparation of materials
Five materials, selected for their degree of surface roughness were used in the study: plastic and metal (smooth or simple), nylon and rubber (intermediate), and wood (rough or complex). These materials are commonly used in dairy operations. Fourteen, 7.5 × 2.5 cm, strips (substrates) were prepared of each material. Sample size was calculated from the effect size and variation observed in a preliminary, unreported trial. Plastic strips were prepared from autoclavable polypropylene translucent wall bottles (Thermo Fisher Scientific, Waltham, MA, catalog number: 2105-0016). Metal strips were prepared from corrosion-resistant galvanized metal (The Hillman Group, Cincinnati, OH; catalog number: 11092). Nylon strips were fashioned from a nylon cutting board (Stanton Trading Inc., Farmingdale, NY; catalog number: 799-30). Rubber strips were obtained from rubber over boats (Tingley Inc., Piscataway, NJ; catalog number: 1400). Wood strips were obtained from pine shims (12 pieces; SBC Inc., Saint-Prosper, Canada). All substrates were autoclave sterilized three times at 121°C for 20 minutes every time before use.
Preparation of salmonella inoculated feces
Avirulent live Salmonella Typhimurium and S. Choleraesuis (Enterisol® Salmonella T/C vaccine; Boehringer Ingelheim Vetmedica, St. Joseph, Missouri, USA) were used in the present study as a model to characterize the salmonella killing capacity of O3. Using avirulent live Salmonella vaccine as a model for infection has been used in several studies [22,23]. Salmonella were recovered using buffered peptone water (BPW) in 50 mL sterile conical polypropylene tubes equipped with a lid (Thermo Fisher Scientific, Waltham, MA) at a 1:9 vaccine/BPW ratio. The mixture was incubated at 37 ºC for 48 hours to ensure that all injured cells were recovered. A serial 10-fold dilutions were used in order to quantify the aSTC cells. One milliliter from each dilution was spread on 3M™ Petrifilm™ Rapid Aerobic Count Plate (RAC; 3M™ Microbiology, St. Paul, MN) using 3M™ Petrifilm™ spreader (3M™ Microbiology, St. Paul, MN). Salmonella were also grown on Tryptic soy agar plates (TSA W/ 5% sheep blood agar; Remel, Lenexa, KS, USA) for bacterial identification using MALDI-TOF mass spectrometry (Bruker Daltonik, Bremen, Germany) at Veterinary Diagnostic Laboratory of University of Illinois Urbana-Champaign.
Approximately 100 g of freshly voided feces was collected using 20 ml sterile economy sample spoon (Sigma Aldrich, St. Louis, MO) into 384 mL Nasco WHIRL-PAK sample bag with puncture proof tabs (Nasco, Fort Atkinson, WI) from a tie stall barn for fresh cows at the University of Illinois Dairy Research Farm. Feces were autoclave sterilized three times at 121ºC for 20 minutes every day before used during the time period of the study. Feces were cultured on TSA for confirming sterilization of feces. Approximately 50g of sterilized feces were mixed in 250 ml of aSTC with an inoculum level ranged from 107 to 108 colony forming unit (cfu)/g in a sterile polypropylene pipette tips (1 mL) box with dimensions of 13 × 11.5 × 5.5 cm (Thermo Fisher Scientific, Waltham, MA).
Ozone generation
For aqueous O3, the dissolved O3 in water with concentrations from 1 to 10 ppm was obtained using OOG1X0 O3 generator manufactured by Origin, Inc. (Princeton, NJ, USA). The generator uses ambient air as feed gas for a built in oxygen concentrator to produce up to 10g of O3 per hour at a concentration of 7.9% by weight. The aqueous O3 unit provided with a high purity deionized water system that controls all variables (pH, temperature, hardness, alkalinity, metals concentration, anions/cation concentration, and solid content or particulate matter) related to water that affect the decay kinetics (half-life) of ozone. Ozone was dissolved in water using Orgin, Inc., custom Venturi injector. A 50L ozonated water recirculation system was designed to maintain constant dissolved O3 concentration via adjustment of O3 generator output based on dissolved oxygen sensor feedback. Dissolved O3 concentration was measured using OSC1X0 dissolved O3 meter by Origin, Inc. The system allows for the maintenance of an O3 concentration with a precession of about 0.5 ppm. The water temperature was controlled using an aquarium water chiller AquaEuro USA Max Chill 1 HP (AquaCave, Inc., Gurnee, IL).
Gaseous ozone was produced by an AOG001 O3 generator with a nominal output of 1 g of O3 per hour (Origin, Inc., Princeton, NJ, USA). The output of generator was tuned down to produce 50 mg of O3 per hour, which allowed to maintain concentration of 1 to 10 ppm in the experimental chamber. The system allowed to maintain constant temperature and humidity of the air in the treatment chamber in the range from room conditions to 100 degrees Fahrenheit and 100% humidity, respectively. The system was not capable to reduce either temperature or humidity below ambient.
Experimental methods of aqueous ozone
The substrates were soaked in the aSTC-fecal mixture for 60 minutes at room temperature of 18-21 ºC and relative humidity of 55-60%, then removed aseptically and hung on a sterile on test tube rack to dry for 30 minutes with sterile binder clips and toothpicks. In a crossover design, the 14 substrates for each material were randomly assigned into 3 groups, treatment (n=6), positive control (contaminated with feces-salmonella but not exposed to O3; n=6), and negative control (laboratory blank, inoculated only with sterile water; n=2). After drying, aseptically techniques were used to place each substrate into a labeled Nasco WHIRL-PAK bag. The substrates of the treatment group were exposed for 4 minutes to aqueous O3 at one of three final concentrations: 2, 4, and 9 ppm. The time of exposure was determined based on a preliminary, unreported trial. Twenty milliliters of ozonated water, enough to completely cover the substrate, at a temperature between 13 and 15ºC was transferred to the bag containing the substrate using 50 mL sterile conical polypropylene tubes equipped with a lid. The bags were gently shaken for the fourminute exposure period. The positive and negative control strips were washed using 20 mL autoclave sterilized distilled water (DW) for the same time exposure. Two milliliters of washing water was removed from the substrate bag and used for culture, 1 mL was spread directly on RAC Petrifilm™ plate and 1 mL was then serially diluted (5-fold dilutions) in 9 ml of BPW. One milliliter from each dilution was spread on RAC Petrifilm™ plates. All RAC Petrifilm™ plates were incubated at 37 °C for 24 hours. The colony forming units were counted using an automated counter (3M Petrifilm Plate Reader; 3M™ Microbiology, St. Paul, MN). The plates were incubated for further 2-3 days in order to remove the effect of recovery of injured cells. To accommodate the effective reading range of the Plate reader (maximum reading <999/ plate), only plates with 30-300 colonies were used for calculating the bacterial reduction factor (RF). All the results were expressed as the number of cfu/mL.
All substrates of treated and control groups were also thoroughly swabbed with a sterile cotton swab. Each swab was washed in 9 ml of BPW and 1 mL was then serially diluted (3-fold dilutions) in 9 ml of BPW. One milliliter from each dilution was spread on RAC Petrifilm™ plate. The culture protocol and quantification of cell count were similar as that described above.
Effect of sequential washing
The treatment substrates of nylon, rubber, and wood that not decontaminated by a single wash of aqueous O3 were sequentially washed (5-serial washes) with 20 cc of water containing 4 ppm of O3 for 4 minutes. This concentration of ozone is the manufacturers' recommended concentrations and commonly used in food industry. The control strips were sequentially washed (5-serial washes) with 20 cc of sterile water for 4 minutes exposure each. The washing, swabbing, and culture protocols were similar as that described above.
Effect of volume of aqueous ozone
The effect of the volume of aqueous 4 ppm O3 with 4 minutes exposure was investigated on nylon, rubber, and wood substrates. Each substrate was washed with 40, and 80 mL, respectively, in a manner identical to the prior approaches except for the change in volume. The volume required to eliminate aSTC from the surface was measured as the product of the number of washes required for a negative culture and the volume of each wash. The washing and culture protocols were similar as that described above.
Effect of bacterial load
Nylon, rubber, and wood substrates were employed to access the impact of bacterial load on the decontamination power of aqueous 4 ppm O3 with 4 minutes exposure. The substrates were soaked in three different aSTC-fecal mixtures with an inoculum level, which ranged from 105 to 108 cfu/mL that were generated with dilutions of aSTC at 1/10-5, 1/10-7, 1/10-8 based on a preliminary, unreported trial. The washing and culture protocols were similar as that described above.
Experimental methods of gaseous ozone
For treatment groups, the rack with hanging substrates was transferred to a chamber (65 × 30 × 25 cm) with transparent lid connected to the gaseous O3 unit. The substrates were exposed to gaseous O3 at final concentrations of 1 or 9 ppm for 30, 60, or 120 minutes. Before transferring the strips to the chamber, the required concentration of O3 and 95% relative humidity was stabilized in generation system and the chamber. The rack with hanging substrates from the control groups were left in a laminar airflow hood (Baker, Sanford, Maine) for the appropriate exposure time. Following exposure or sham exposure, the substrates were thoroughly swabbed with a sterile cotton swab on all sides. The culture protocols were similar as that described above for aqueous O3.
Data and Statistical analysis
The log10 density for each substrate was calculated using formula presented in ASTM method E2871-12 [24], as follows:
Log10 (cfu/mL)=log10 {(cfu/volume plated) × (washing solution volume/dilution).
Log10 RF and kill percentage (% kill) were also calculated by using an equation presented in ASTM method E2871-12 [24], as follows:
Log10 RF=log10 control – log10 treated.
% kill=(1–10-RF) × 100
Data were expressed as median and range or as mean ± SD based on testing for normality by calculating the Shapiro-Wilk Statistic or based on testing equality of variances using Levene's test. P<0.05 was considered significant. Mann-Whitney U-tests or Kruskal-Wallis One Way Analysis of Variance on Ranks were used for comparisons between groups with nonnormal distribution or unequal variances data. For post-hoc comparisons, P-values were adjusted for multiple comparisons according to Tukey. Repeated measures ANOVA was used to detect differences in log10 RF between O3 concentrations, exposure times, and the interaction between O3 concentrations, exposure times using PROC. Whenever the F-test was significant, Bonferroni-adjusted P-values were used to assess differences between different concentrations at a specific time of exposure, and between times of exposure within a specific O3 concentration. The preferred sampling method (washing water or surface swab) for culture was identified based on the lowest value for the Akaike’s Information Criterion (AIC) from the mixed models procedure.
Univariate linear regression (PROC REG) was used to test the effects of materials, aqueous O3 concentrations, sequential washing, volume of aqueous O3, and bacterial load on the rate of reduction in aSTC cell count. Logistic regression (PROC LOGISTIC) was used to characterize the relationship between 5-log10 RF as a safe level, achieved by exposure to aqueous O3 of 4 ppm for 4 minutes (1=RF ≥ 5 cfu/mL; 0=RF<5 cfu/mL) and materials. Multivariable regression (PROC REG) was used to test the effect of the gaseous O3 concentrations and exposure times, and the interaction between O3 concentrations and exposure times on log10 RF. The interaction term was dropped from the analysis if O3 concentration and the interaction between O3 concentrations and exposure times were not significant.
Statistical analyses were performed using SAS 9.3 software (SAS Inc, Cary NC) and Excel spreadsheet (Microsoft Corporation, Redmond, WA, USA).
The results of direct MALDI-TOF mass spectrometry confirmed the presence of only aSTC and all associated laboratory blanks were 0 cfu during the whole experiment.
Effect of materials
Surface type had a significant (P<0.0001) impact on the reduction in aSTC cell count with aqueous O3 exposure and explained approximately 43% of the reduction in aSTC cell count (Figure 1). The likely probability of 5-log10 reduction of 4 ppm aqueous O3 for each material with the 95% confidence interval for the probability is presented in Figure 2.
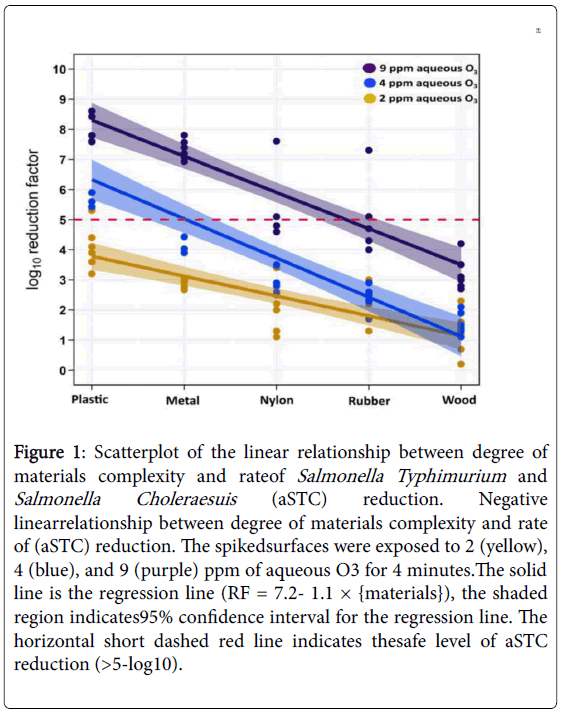
Figure 1: Scatterplot of the linear relationship between degree of materials complexity and rateof Salmonella Typhimurium and Salmonella Choleraesuis (aSTC) reduction. Negative linearrelationship between degree of materials complexity and rate of (aSTC) reduction. The spikedsurfaces were exposed to 2 (yellow), 4 (blue), and 9 (purple) ppm of aqueous O3 for 4 minutes.The solid line is the regression line (RF = 7.2- 1.1 × {materials}), the shaded region indicates95% confidence interval for the regression line. The horizontal short dashed red line indicates thesafe level of aSTC reduction (>5-log10).
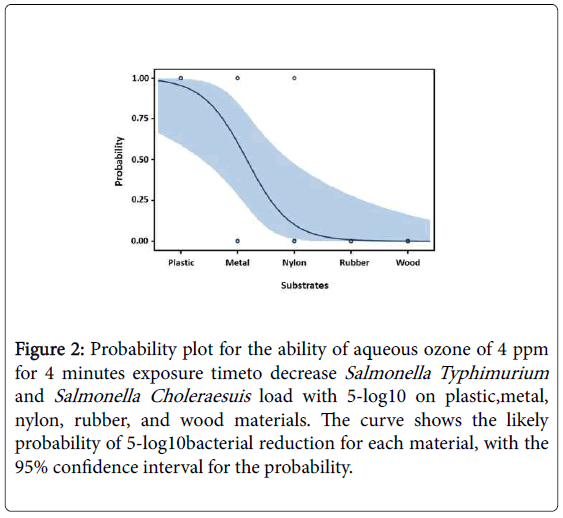
Figure 2: Probability plot for the ability of aqueous ozone of 4 ppm for 4 minutes exposure timeto decrease Salmonella Typhimurium and Salmonella Choleraesuis load with 5-log10 on plastic,metal, nylon, rubber, and wood materials. The curve shows the likely probability of 5-log10 bacterial reduction for each material, with the 95% confidence interval for the probability.
Plastic
Four and nine ppm of aqueous O3 reduced aSTC cell count by 6.7- log10 and below detectable limits in both washing water and surface of strips, respectively (Supplementary Table 1; Figures 1 and 3). The results of univariate linear regression analysis indicated that the reduction in cell count was dependent on the concentration of aqueous O3 (P<0.0001; R2=0.70; Table 1; Figure S1).
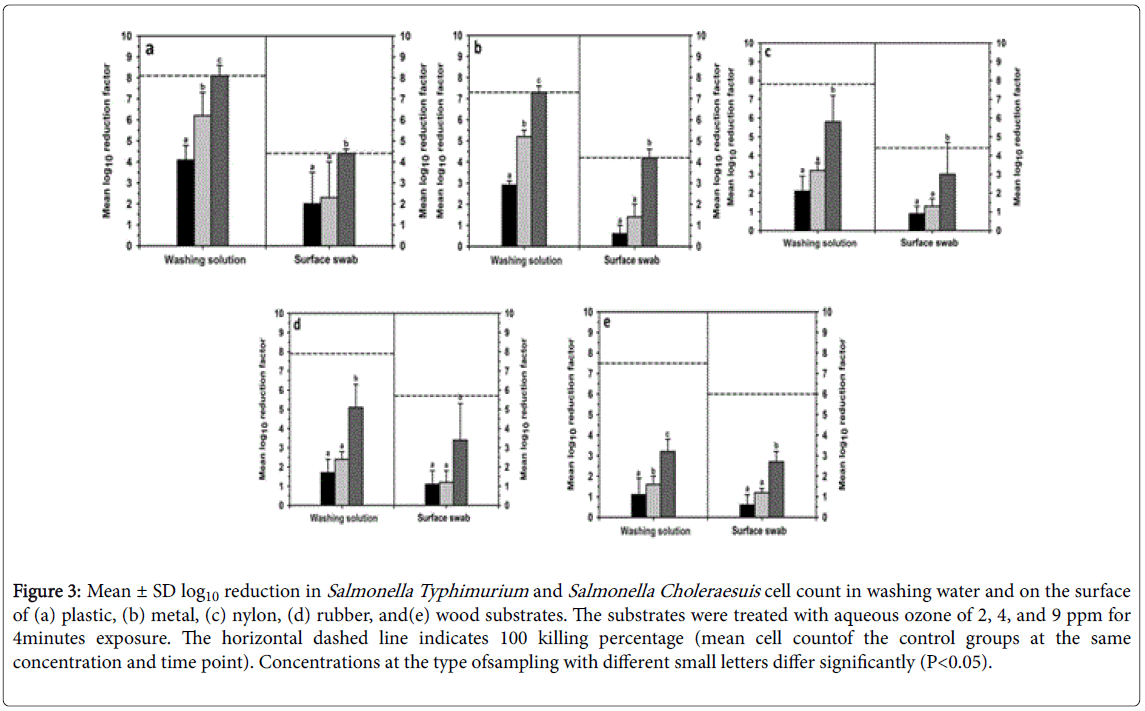
Figure 3: Mean ± SD log10 reduction in Salmonella Typhimurium and Salmonella Choleraesuis cell count in washing water and on the surface of (a) plastic, (b) metal, (c) nylon, (d) rubber, and(e) wood substrates. The substrates were treated with aqueous ozone of 2, 4, and 9 ppm for 4minutes exposure. The horizontal dashed line indicates 100 killing percentage (mean cell countof the control groups at the same concentration and time point). Concentrations at the type ofsampling with different small letters differ significantly (P<0.05).
| Substrates | Coefficient | Estimated | SE | Probability | Model R2 |
|---|---|---|---|---|---|
| Plastic | Intercept | 3.7 | 0.5 | <0.0001 | 0.7 |
| Concentration | 0.5 | 0.1 | <0.0001 | ||
| Metal | Intercept | 0.6 | 0.1 | <0.0001 | 0.74 |
| Concentration | 0.9 | 0.4 | 0.0607 | ||
| Nylon | Intercept | 0.9 | 0.4 | 0.0607 | 0.7 |
| Concentration | 0.5 | 0.1 | <0.0001 | ||
| Intercept | -0.2 | 0.3 | 0.6421 | 0.95 | |
| Number of washes | 3.4 | 0.2 | <0.0001 | ||
| Intercept | 1.9 | 0.5 | 0.0021 | 0.8 | |
| Volume | 0.1 | 0.01 | 0.0013 | ||
| Intercept | 15.5 | 0.7 | <0.0001 | 0.95 | |
| Bacterial load | -1.7 | 0.1 | <0.0001 | ||
| Rubber | Intercept | 1.3 | 0.4 | 0.0047 | 0.69 |
| Concentration | 0.4 | 0.1 | <0.0001 | ||
| Intercept | 0.8 | 0.5 | 0.1439 | 0.63 | |
| Number of washes | 1.2 | 0.2 | <0.0001 | ||
| Intercept | 1.8 | 0.2 | <0.0001 | 0.82 | |
| Volume | 0.1 | 0.01 | <0.0001 | ||
| Intercept | 0.6 | 0.5 | <0.0001 | 0.53 | |
| Bacterial load | -0.5 | 0.1 | <0.0001 | ||
| Wood | Intercept | 6.5 | 0.3 | 0.0759 | 0.71 |
| Concentration | 0.3 | 0.1 | <0.0001 | ||
| Intercept | -0.3 | 0.4 | 0.4626 | 0.81 | |
| Number of washes | 1.6 | 0.2 | <0.0001 | ||
| Intercept | 1.1 | 0.4 | 0.0263 | 0.01 | |
| Volume | 0.002 | 0.007 | 0.7594 | ||
| Intercept | 8.9 | 0.6 | <0.0001 | 0.81 | |
| Bacterial load | -1 | 0.1 | <0.0001 |
Table 1: Univariate linear regression model for predicting Salmonella Typhimurium and Salmonella Choleraesuis reduction on plastic, metal, nylon, rubber, and wood treated with 20 mL of aqueous ozone of 2, 4, and 9 ppm for 4 minutes exposure.
On the other hand, gaseous O3 at concentration of 9 ppm for 120 minutes killed approximately 3.0-log10 (99.7%) of aSTC load, compared to 0.8-log10 RF (69.0%) when concentration of 1 ppm for the same exposure time was used (Figure 4). The results of multivariable regression analysis showed that both the concentration of gaseous O3 and exposure time were significant predictors (P<0.0001, P<0.0037, respectively) and explained approximately 70% of the reduction in aSTC cell count (Table 2).
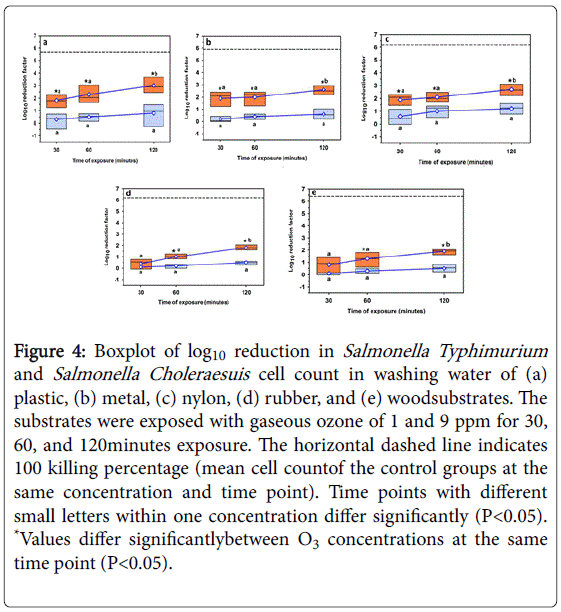
Figure 4: Boxplot of log10 reduction in Salmonella Typhimurium and Salmonella Choleraesuis cell count in washing water of (a) plastic, (b) metal, (c) nylon, (d) rubber, and (e) woodsubstrates. The substrates were exposed with gaseous ozone of 1 and 9 ppm for 30, 60, and 120minutes exposure. The horizontal dashed line indicates 100 killing percentage (mean cell countof the control groups at the same concentration and time point). Time points with different small letters within one concentration differ significantly (P<0.05). *Values differ significantlybetween O3 concentrations at the same time point (P<0.05).
| Coefficient | Estimated value | SE | Probability | Model R2 | |
|---|---|---|---|---|---|
| Plastic | Intercept | -0.394 | 0.288 | 0.1652 | 0.7 |
| Concentration | 0.235 | 0.028 | <0.0001 | ||
| Exposure time | 0.009 | 0.003 | 0.0037 | ||
| Metal | Intercept | -0.288 | 0.18 | 0.1205 | 0.81 |
| Concentration | 0.217 | 0.018 | <0.0001 | ||
| Exposure time | 0.007 | 0.002 | 0.002 | 0.63 | |
| Nylon | Intercept | 0.233 | 0.218 | 0.2917 | |
| Concentration | 0.158 | 0.022 | <0.0001 | ||
| Exposure time | 0.008 | 0.002 | 0.003 | ||
| Rubber | Intercept | -0.536 | 0.1432 | 0.0007 | 0.71 |
| Concentration | 0.106 | 0.01454 | <0.0001 | ||
| Exposure time | 0.01 | 0.00155 | <0.0001 | ||
| Intercept | -0.367 | 0.19 | 0.0624 | 0.61 | |
| Wood | Concentration | 0.127 | 0.019 | <0.0001 | |
| Exposure time | 0.008 | 0.002 | 0.0005 |
Table 2: Multiple linear regression model for predicting Salmonella Typhimurium and Salmonella Choleraesuis reduction on plastic, metal, nylon, rubber, and wood materials exposed to gaseous ozone of 1 and 9 ppm for 30, 60, and 120 minutes exposure.
Metal
Four ppm of aqueous O3 reduced aSTC count in washing water to a safe level (5.2-log10) within 4 minutes exposure; while, exposure to concentration of 9 ppm reduced the aSTC load below detectable limits in both water of wash and surface of strips (Table S1; Figures 1 and 3). The results of univariate linear regression analysis indicated that the reduction in aSTC cell count was dependent on the concentration of aqueous O3 (P<0.0001; R2=0.74; Table S1).
The results of gaseous O3 exposure showed the highest reduction in aSTC cell count (2.6-log10; 99.8%) at 9 ppm O3 and exposure time of 120 minutes, compared to 0.6-log10 RF (66.5%) when 1 ppm of O3 for the same exposure time was used (Figure 4). According to multivariable regression analysis, both the concentration of gaseous O3 and exposure time were significant predictors (P<0.0001, P<0.0020, respectively) and explained approximately 81% of the reduction in aSTC cell count (Table 2).
Nylon
Aqueous O3 at concentration of 9 ppm reduced aSTC cell count in washing water to a safe level (5.8-log10; Table S1; Figure 1). According to univariate linear regression analysis, the concentration of aqueous O3 was significant predictors (P< 0.0001) and explained approximately 75% of the reduction in aSTC cell count (Table 1; Figures 5 and S2).
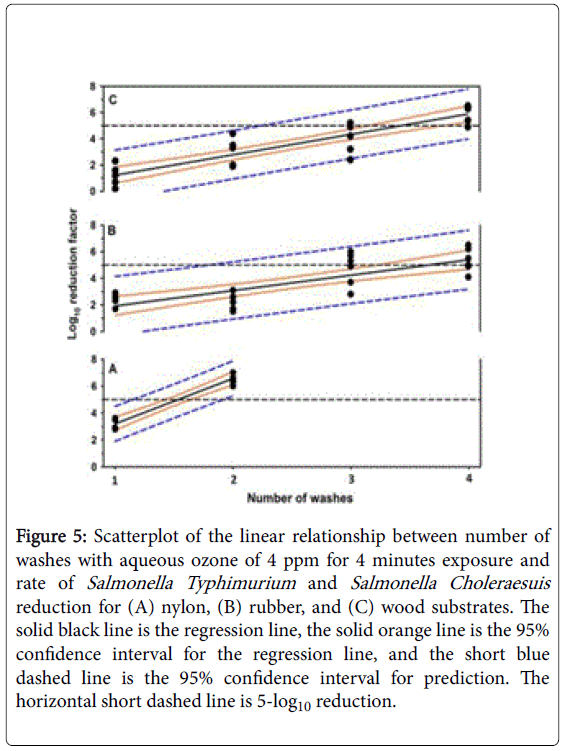
Figure 5: Scatterplot of the linear relationship between number of washes with aqueous ozone of 4 ppm for 4 minutes exposure and rate of Salmonella Typhimurium and Salmonella Choleraesuis reduction for (A) nylon, (B) rubber, and (C) wood substrates. The solid black line is the regression line, the solid orange line is the 95% confidence interval for the regression line, and the short blue dashed line is the 95% confidence interval for prediction. The horizontal short dashed line is 5-log10 reduction.
The results of sequential washing indicated that two washing cycles are sufficient (P<0.0001) to reduce aSTC cell count below detectable limits in both washing water and surface of strips, and explained approximately 95% of the reduction in aSTC cell count (Tables 1 and 3; Figures 5 and S2).
According to univariate linear regression analysis, the volume of aqueous O3 used for washing and bacterial load are powerful predictors (P<0.0001) and explained approximately 80 and 95% of the reduction in aSTC cell count, respectively (Table 1; Figures 6, 7 and S3).
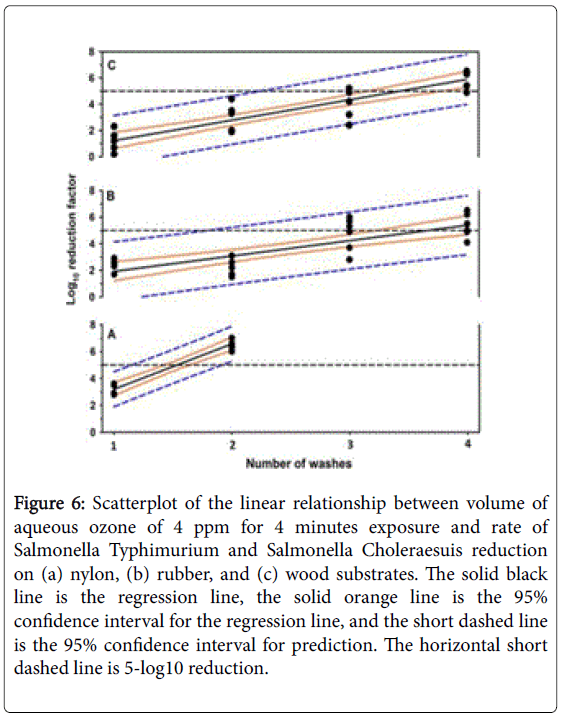
Figure 6: Scatterplot of the linear relationship between volume of aqueous ozone of 4 ppm for 4 minutes exposure and rate of Salmonella Typhimurium and Salmonella Choleraesuis reduction on (a) nylon, (b) rubber, and (c) wood substrates. The solid black line is the regression line, the solid orange line is the 95% confidence interval for the regression line, and the short dashed line is the 95% confidence interval for prediction. The horizontal short dashed line is 5-log10 reduction.
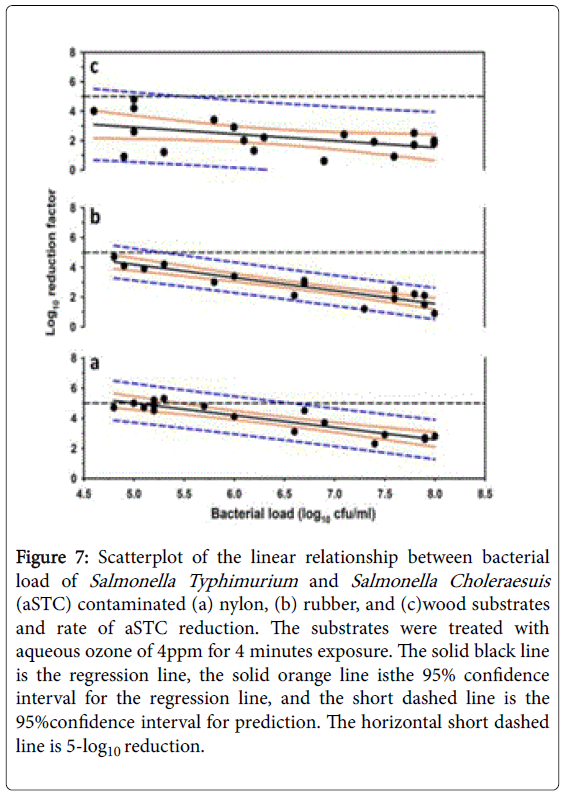
Figure 7: Scatterplot of the linear relationship between bacterial load of Salmonella Typhimurium and Salmonella Choleraesuis (aSTC) contaminated (a) nylon, (b) rubber, and (c)wood substrates and rate of aSTC reduction. The substrates were treated with aqueous ozone of 4ppm for 4 minutes exposure. The solid black line is the regression line, the solid orange line isthe 95% confidence interval for the regression line, and the short dashed line is the 95%confidence interval for prediction. The horizontal short dashed line is 5-log10 reduction.
Nine ppm of gaseous O3 for 120 minutes exposure showed the greatest RF (2.6-log10; 99.5%), compared to 1.2-log10 RF (91.3%) for 1 ppm O3 for the same exposure time was used (Figure 4). According to multivariable regression analysis, both the concentration of gaseous O3 and exposure time were significant predictors (P<0.0001, P<0.0030, respectively) and explained approximately 63% of the reduction in aSTC cell count (Table 2).
Rubber
Aqueous O3 at concentration of 9 ppm or greater reduced aSTC count in washing water to a safe level (5.1-log10; Table S1; Figures 1 and 3).
According to univariate regression analysis, the concentration of aqueous O3 is a powerful predictor (P<0.0001) and explained approximately 69% of the reduction in aSTC cell count (Table S1).
The results of sequential washing indicated that four washing cycles are sufficient enough (P<0.0001) to reduce aSTC below detectable limits in both washing water and surface of strips, and explained approximately 63% of the reduction in cell count (Tables 1 and 3; Figures 5 and S2).
| Sampling method | |||||
|---|---|---|---|---|---|
| Washing water | Surface swab | ||||
| Control | Ozone | Control | Ozone | ||
| Nylon | |||||
| First wash | 7.9 (6.9,8.0)a | 5.2 (5.1,6.0)*a | 5.1 (4.9,5.3)a | 3.5 (3.0,4.0)*a | |
| Second wash | 6.6 (6.0,7.0)b | 0.0*b | 4.4 (4.2,4.7)b | 0.0*b | |
| Rubber | |||||
| First wash | 7.9 (7.3,8.0)a | 5.5 (4.7,6.4)*a | 5.5 (5.2,5.6)a | 3.9 (3.4,4.2)*a | |
| Second wash | 6.7 (6.6,7.6)b | 5.1 (4.1,5.1)*a | 4.3 (4.1,5.4)b | 3.5 (3.0,3.6)*a | |
| Third wash | 6.0 (5.3,6.2)bc | 1.1 (0.0,3.4)*b | 4.4 (5.0,4.8)bc | 2.0 (0.0,2.7)*b | |
| Fourth wash | 5.5 (4.1,6.5)bcd | 0.0*c | 4.2 (3.5,4.5)bcd | 0.0*c | |
| Wood | |||||
| First wash | 7.9 (6.9,8.0)a | 6.1 (4.9,6.3)*a | 5.7 (5.5,5.8)a | 4.5 (4.0,5.1)*a | |
| Second wash | 7.6 (6.9,7.7)a | 4.1 (3.1,5.8)*b | 5.8 (5.2,5.9)a | 3.9 (2.5,4.4)*a | |
| Third wash | 6.6 (6.2,7.5)b | 2.4 (2.1,3.8)*c | 5.1 (4.9,5.4)b | 2.2 (0.0,2.9)*b | |
| Fourth wash | 6.3 (4.9,6.5)bc | 0.0*d | 4.3 (4.1,4.4)c | 0.0*c | |
*Values within a row are significantly different between control and treated groups for each type of sampling.
a-dValues with different letters within a column for each material are significantly different.
Table 3: Median and range for Salmonella Typhimurium and Salmonella Choleraesuis cell count (cfu/mL) in washing water and on the surface of both control and treated nylon, rubber, and wood materials that sequentially washed using aqueous ozone of 4 ppm for 4 minutes exposure.
Univariate analysis indicated that the volume of aqueous O3 and bacterial load are considered important predictors (P<0.0001) and explained 82 and 53% of the reduction in aSTC cell count, respectively (Table 1; Figures 6, 7 and S3).
The highest reduction in the cell count of gaseous O3 was at a concentration of 9 ppm for 120 minutes exposure with average log10 RF of 1.8 (98.0%; Figure 4). According to multivariate regression analysis, the reduction in aSTC cell count was dependent on both the concentration of gaseous O3 and exposure time (P<0.0001, P<0.0001, respectively) and explained approximately 71% of RF (Table 2).
Wood
Aqueous O3 at concentration of 9 ppm was unable to reduc aSTC cell count in washing water to a safe level (3.2-log10; S1; Figures 1 and 3).
Using univariate regression analysis, the concentration of aqueous O3 is an important predicator (P<0.0001) and explained approximately 71% of the reduction in aSTC cell count (Table S1).
The results of sequential washing indicated that four washing cycles are sufficient (P<0.0001) to reduce aSTC below detectable limits in both washing water and surface of strips and explained approximately 81% of the reduction in aSTC cell count (Tables 1 and 3; Figure 5 and S2).
However, the reduction in aSTC count was not dependent on the volume of aqueous O3 (Table 1; Figures 6 and S3).
Univariate regression indicated that the bacterial load considered an important predictor of O3 effectiveness (P<0.0001) and explained approximately 81% of the reduction in cell count (Table 1; Figures 7 and S3).
The contour fit plot indicated that decreasing the bacterial load on complex substrates has approximately the same effect as the numbers of washes on the reduction of aSTC count (Figure 8).
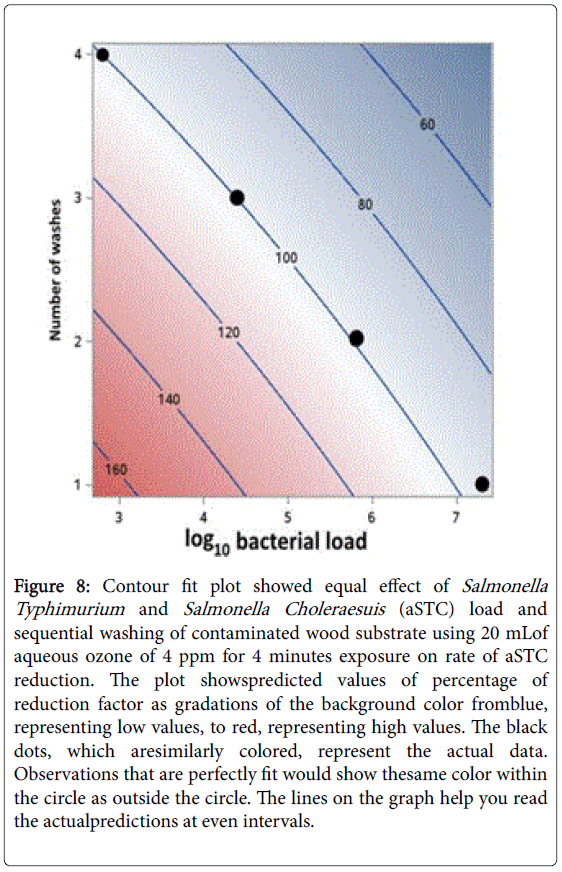
Figure 8: Contour fit plot showed equal effect of Salmonella Typhimurium and Salmonella Choleraesuis (aSTC) load and sequential washing of contaminated wood substrate using 20 mLof aqueous ozone of 4 ppm for 4 minutes exposure on rate of aSTC reduction. The plot showspredicted values of percentage of reduction factor as gradations of the background color fromblue, representing low values, to red, representing high values. The black dots, which aresimilarly colored, represent the actual data. Observations that are perfectly fit would show thesame color within the circle as outside the circle. The lines on the graph help you read the actualpredictions at even intervals.
The highest reduction of the cell count with gaseous O3 was at concentration of 9 ppm for 120 minutes exposure with average log10 RF of 1.9 (98.5%; Figure 4). According to multivariate regression, the reduction in aSTC cell count was dependent on both the concentration of gaseous O3 and exposure time (P<0.0001, P<0.0005, respectively) and explained approximately 61% of RF (Table 3).
The first major finding of this study was that aqueous O3 at concentration of 4 ppm is sufficient to reduce aSTC to a safe level (>5- log10) on smooth surfaces (plastic, metal) after 4 minutes exposure. The second major finding was that single exposures of aqueous or gaseous O3 are not adequate to eliminate aSTC under heavy bacterial load in complex environments. However, sequential washing or decreasing the bacterial load did allow for the decontamination of complex surfaces from Salmonella.
To our knowledge, this is the first study describing the capacity of aqueous and gaseous O3 to inactivate aSTC under different operational conditions. The results of this study supported the earlier finding that the physical and chemical properties of the surface have great impact on the killing capacity of O3 [25-27]. The most efficient bacterial reduction was achieved on smooth surfaces, plastic and metal, in this study. This can be explained by the fact that smooth surfaces enhance the mass transfer of O3 which results in a more efficient diffusion of O3 molecules among aSTC cells, consequently increasing the speed of O3 penetration and destruction of the microbes [28,29]. Smooth surfaces also reduce the surface ozone reactivity, the irreversible consumption of O3 when it strikes the surface, to a lower degree than rough surfaces resulting in decreased physical removal of O3 [26]. Furthermore, smooth surfaces decrease the adhesion of microbes to them making the microbes more vulnerable to O3 [27]. The decrease in the RF on metal surfaces, compared to plastic might be due to increase the rate of O3 destruction due to excessive surface-ozone reactivity as the iron, zinc and manganese are easily oxidized by O3 [30].
On the other hand, increased surface complexity results in an increased adhesion of microbes and more contact with ozoneoxidizable materials [29,31]. With increased adhesion, microbes and organic matter are more closely associated with each other limiting O3 contact to microbes [32]. Additionally, this limits the O3 flux which results in slower diffusion that also negatively impacts bacterial killing dynamics [25]. On nylon surfaces, it has been reported that O3 reacts with nylon substrate to increase its hydrophilic properties that results in water penetration to internal fine structure of the nylon resulting in increased removal of O3 [33]. Therefore, a higher O3 concentration is required on nylon surfaces than on smooth surfaces, to achieve a reduction in aSTC count below detectable limits. Interestingly, increasing the volume of ozonated water or decreasing the bacterial load provide both an efficient and similar increase in the killing capacity of aqueous O3. It appears, based on the data generated in this study and previous work that the rate of bacterial reduction on nylon surfaces is proportional to the ratio between number of ozone molecules and the bacterial cell count [34].
The rate of bacterial reduction on rubber surfaces is decreased, compared to plastic, metal, and nylon. On rubber surfaces, O3 attacks the double bonds in the polymeric chains present in polypropylene, polyethylene, and polyethylene terephthalate surfaces resulting in increased roughness of the surface. In addition, this reaction exposes the bonds underneath the surface allowing O3 to react with a greater surface area creating cracks and in increased surface-ozone reactivity [35,36]. Based on these reactions it is expected that the adhesion dynamics of aSTC and organic matter are complicated and the diffusion O3 on rubber surface would be limited. All of this results in a need for a more aggressive use of O3 such as an increased the concentration of O3, lowering the bacterial load or four sequential washings, to decontaminate a rubber surface of Salmonella.
The lowest reduction rate of aSTC was on wood surfaces which is most likely explained by it high surface-O3 reactivity [37,38]. Woodbased materials are complex, heterogenic materials containing variety of high molecular weight components, particularly cellulose (40% to 50%); lignin (15% to 35%); hemicellulose (20% to 35%), and solventsoluble extractives (3% to 10%) such as terpenes, tannins, aromatic and aliphatic acids [39]. In the paper industry, O3 is used for delignification of wood products as it is effectively degrades lignin [38,40]. In addition, wood releases O3-reactive substances (e.g. volatile organic compounds) that consume O3 before it reaches microbes in the irregular pores of wood surface [41]. Ozone also reacts with unsaturated hydrocarbons found in wood further increasing O3 breakdown [37]. The physical properties of the wood limit O3 diffusion and is primary cause of low RF because a large percentage of O3 are lost in the irregular porous layer of the surface [31,41]. On wood, large amounts of O3 are destroyed before reach to bacteria because the irregular pores and cracks act as a physical protective mechanism for organisms allowing them to be far from the surface and the highest concentrations of O3 [31]. Much like rubber, it is necessary to decrease the bacterial load and sequentially wash a surface four or more times to decontaminate wood surfaces from aSTC.
To our knowledge, this is the first study investigating on complex surfaces the effect of bacterial load and a sequential washing system employing aqueous O3 on the rate of bacterial reduction. We attribute the approximately similar effects of reducing bacterial load and a sequential washing system on RF to the concept that there is a positive relationship between the ratio of O3 molecules to bacterial cells and the RF [42]. Previous studies reported that washing in tap water reduced the number of bacteria between 1-log10 and 2.3-log10 cfu/g [42,43]. Therefore, sequentially washing complex surfaces with clean tap water to reduce the bacterial load to below 5-log10 before exposing to O3 can provide an efficient alternative to a sequential washing system with O3 to assist in clearing complex surfaces of Salmonella if cleaning needs exceed O3 generation capacity or very high levels of Salmonella are present.
Based on the results of this study, gaseous O3 is not an alternative to aqueous O3 in decreasing aSTC to a safe level, especially in complex environments. The maximum concentration of gaseous O3 used in this study were lower than the minimal bactericidal levels that has been recommended in earlier studies [44,45]. The results of recent studies supported the earlier findings, where Sharma and Hudson used gaseous O3 of 25 ppm for 20 minutes reported ≥ 4-log10 reduction in gram negative bacteria on plastic surfaces [46]; while, Wani and others reported killing of approximately 6-log10 of E. coli on blood agar media when used 50 ppm for 10 minutes [47]. Moreover, some bacteria need more time (hours) to be destroyed using gaseous O3 [48]. It is important to remember that because air has a much lower density than water, 1 ppm of O3 in air equals 2.14 mg O3/m3, however 1 ppm of aqueous ozone equal 1 g O3/m3 water [49]. Therefore, a level of gaseous O3 measured in ppm needs to be approximately 500 times higher than in water to achieve the same concentration in g/m3. We chose to use very low concentrations of gaseous O3 and short exposure times in this study because applications in livestock and meat production may not afford long exposure period and may need to be done near workers necessitating lower concentrations for worker safety. In addition, we are unaware of any data besides these that documented the effect of gaseous O3 on multiple surfaces that are present in the food production chain at amounts and times that would be applicable under commercial conditions. This study provides a practical guide for optimal operational conditions of aqueous and gaseous O3 for controlling Salmonella in dairy operations. However, there were some limitations in this study. First, our study was conducted in a controlled environment and additional studies are indicated to determine the external validity of the results.
Aqueous O3 of 4 ppm is sufficient to reduce aSTC to a safe level (greater than a 5-log10 reduction) on plastic and metal surfaces within a single 4 minutes exposure. However, with nylon and rubber, it is necessary to increase the dose of aqueous O3 needs to 9 ppm, increase volume of 4 ppm ozonized water for a fixed amount of surface area or sequentially wash the surface two times for nylon and four times for rubber with 4 ppm aqueous O3. Aqueous or gaseous O3 alone are not adequate to reduce aSTC to a safe level under heavy bacterial load in complex environments. Therefore, we recommend sequentially washing complex surfaces using clean tap water before exposing to aqueous O3 to reduce the bacterial load to level less than 5-log10 or sequentially washing the surface four or more times with aqueous 4 ppm aqueous O3.
The authors thank the staff of the University of Illinois Dairy Research Farm (UIDRF) for their help. Funding for this study was provided, by a grant from Origin, Inc. (Princeton, NJ, USA)