Advances in dairy Research
Open Access
ISSN: 2329-888X
ISSN: 2329-888X
Research Article - (2022)Volume 10, Issue 1
A new procedure has been developed for rapid classification and quantification of the adulteration of fresh milk. In this study fresh cow milk samples were collected from three farms surrounding Beijing district and five farms in Hebei province in China were investigated. Those fresh cow milk samples were then adulterated with tap water at ten different percentage levels. Then all samples were scanned using NIR spectroscopy (JDSU, California, USA). The MicroNIR 1700 spectrometer analyses the wavelength region is 870 nm-1660 nm. The chemometric tools like Soft Independent Modeling of Class Analogy (SIMCA) and Partial Least Squares Regression (PLS) was applied for statistical analysis of the obtained NIR spectral data. To check the discrimination between the pure (control) and adulterated milk samples, (SIMCA) model was used. Furthermore, PLS regression model was also built to quantify the levels adulterant in cow milk samples. The PLS regression model was obtained standard error of prediction (SEP) 5.33 g/L for estimation of levels of adulteration with water. This recently developed method is non-destructive, lowcost, no need of much sample preparation and having sensitivity level less than 1% level of adulteration. This recently developed method is fast and simple, being suitable for the control of raw milk in a dairy industry or for the quality inspection of commercialized milk.
NIR-spectroscopy; Milk adulteration; SIMCA; PLS regression
NIR: Near-Infrared Spectroscopy; PCA: Principal Component Analysis; DD-SIMCA: Data Driven Soft Independent Modeling of Class Analogy; PLSR: Partial Least Squares Regression; RMSE: Root Mean Square Error; RMSECV: Root Mean Square Error of Cross Validation; RMSEP: Root Mean Square Error of Prediction.
Adulteration in food is a bigger problem faces the world, which has required more investigation, because it has attracted more attention worldwide, recently [1]. Milk is one of the seven most common targets for adulteration [2]. News has shown how milk and milk products are being adulterated with urea, soap and other hazardous chemicals [3,4]. However, the dilemma of melamine in China 2008 revealed the impact of adulteration in food by economically motivated adulteration on consumer health and economic situation [2].
Milk is most important source for essential nutrients and health maintenance. Milk is perfect food. It is valuable source of fat, protein, carbohydrates, vitamins and minerals [5]. Milk is a balanced mixture and a perishable food. It is one of few foods consumed in the natural form throughout the world.Milk contain 87% water, 3.3% protein, 3.9% fats, 5% lactose and 0.7% ash. Milk provides us building protein for body, giving vitamins, minerals (calcium) for bone forming and energy supplying (lactose and milk fat). Besides providing certain essential fatty acids it includes all essential amino acid. All the properties of milk make it an important food for all ages [6]. The low costs and high nutritional value of milk has made it form a significant part of the human diet. However, global increased demand made this foodstuff pone for more potential adulteration [7].
In 2016, more than 816 million tons of milk was produced around the world (including cow, buffalo, sheep, goat and camel milk). India was the largest producer, with 155.2 millions of tons, USA was the second major producer (96.3 millions of tons) and China was 43.4 millions of tons (FAO, 2016). However, as fast as the production and demand for milk have grown, a larger frequency of sophisticated milk adulterations has been reported in different countries.
Adulteration of milk and other dairy products has existed from old times, and it is done either for profit margin or lack of hygienic status of storage, processing, transportation and marketing [8,9]. Unfortunately, adulteration is very common in developing countries [7]. Increase population, the urbanization of rural, and scattered colonization are the few main factors affected on increasing the demand of milk production [10]. In order to meet the shortage between demand and supply of milk the unscrupulous producers are often found to involve in milk adulteration by adding adulterating substances in milk [11].
The other kind of adulteration of milk by the additions of starch, rice flour, skim milk powder, reconstituted milk, urea, melamine, salt, glucose, vegetable oil, animal fat and whey powder. These additions are to increase the thickness and viscosity of the milk, and to maintain the composition of fat, carbohydrate and protein [12-14]. Cleanliness and purity of milk are indicating for good quality milk [15]. For quality dairy items and better health of consumer, quality control of milk is required [16].
Different methodologies and techniques are used to reveal adulteration, however, there is a still needing for rapid, accurate, non-destructive, low-cost and adequate methods to control milk quality [17-21]. A proficient approach is the application of the near infrared (NIR) spectrometry combined with chemometric data analysis [22]. This technique can be carried out not only in laboratories but also in dairy factories, farms, inspection points, etc. Chemometrics is a tool used for multivariate data analysis often connected with information-rich instrumental methods, qualitatively used for grouping or classifying unknown samples with similar characteristics and quantitatively for determining adulterant analytes in samples [2].
Near-infrared (NIR) spectroscopy has been used for determination of many milk components widely (e.g., protein, fat and lactose), however, only a limited studies describe its use to monitor milk authenticity [23,24]. He, et al. has improved a method using MIR spectroscopy to detect adulteration in milk by addition of melamine, urea, glucose and tetracycline hydrochloride [25]. Spectra indicated to variations in the peak positions and shapes between the control and adulterated milk confirming to the potential of the method to detect milk adulteration.
Other authors have investigated the correlation between NIR and MIR spectral data of pure milk and milk adulterated with water [18,26], urea, whey, and caustic soda by using chemometric analysis [26,27]. Recently NIR spectroscopy industrial companies have the development of portable systems, providing fast, simplicity, selectivity, and performance like to those of benchtop instruments [28].
Portable infrared spectrometers (NIR) represent an ideal tool in food quality control, due to providing portability for in situ analysis and sensitivity of these analysis [29]. Some studies used application of portable near-infrared (NIR) technologies in food analysis, include the prediction of quality parameters in oranges, and monitoring of oil oxidative stability, quantification of trans fat in edible oils, and mineral fortification in whole grain cornmeal [30-33]. Results of these studies have shown that this technique (NIR) permitted the built of calibration and classification models with excellent performance statistics.
The objective of this study was to evaluate the feasibility and investigated of the performance of portable NIR spectrometers combined with multivariate analysis to identify and quantify milk adulteration by the addition of water. Qualitative and quantitative models were developed by using pattern recognition techniques including Soft Independent Modeling of Class Analogy (SIMCA) and Partial Least-Squares Regression (PLSR) algorithm, respectively.
The Figure 1 shows the overall technical frame diagram of experiment design (experimental work flow)
Cow milk samples preparation
In this study fresh cow milk samples were collected from three farms surrounding Beijing district and five farms in Hebei province in China were investigated. Those fresh cow milk samples were then adulterated with water at ten different percentage levels (Table 1).
| Water level no | Adulterant water % |
|---|---|
| 1 | 0.00% |
| 2 | 5% |
| 3 | 10% |
| 4 | 15% |
| 5 | 20% |
| 6 | 25% |
| 7 | 30% |
| 8 | 35% |
| 9 | 40% |
| 10 | 45% |
| 11 | 50% |
Table 1: Milk and milk adulterated samples.
The total number of samples used was 114, 34 pure cow milk samples, 80 adulterated with water. For PLS regression all the samples were joined together and split into two sets, a training set (75% of the samples) and a test set for validation (25% of the samples) in Figure 1.
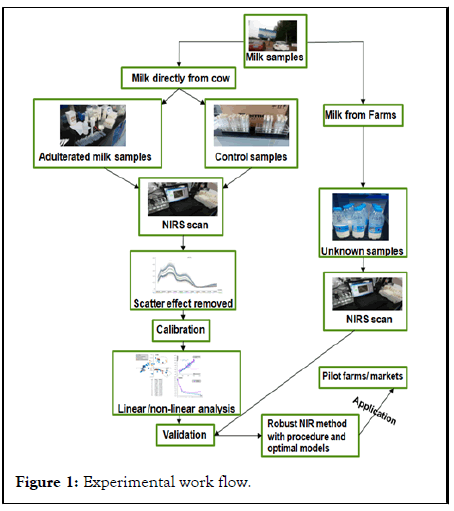
Figure 1: Experimental work flow.
NIR spectroscopic analysis
All samples were scanned using NIR spectroscopy (JDSU, California/USA). The MicroNIR 1700 is a miniature near infrared spectrometer developed and manufactured by JDSU (JDS Uniphase Corporation, www.jdsu.com). It is distinguished by its small size (45 mm diameter × 42 mm height), low weight (60 g) and requirement for short analysis times (a few seconds). This technology can be controlled and operated by a tablet, Smartphone or portable computer The MicroNIR spectrometer is an ultra-compact instrument designed to be used in diffuse reflection, transflection or transmission modes. It uses a Linear Variable Filter (LVF) component mounted over a diode array detector that separates incoming light into individual wavelengths. The spectrometer integrates the light source and readout electronics in a small construction. Key attributes of the MicroNIR 1700 spectrometer are summarized in Table 2.
| Parameter | Specification |
|---|---|
| Weight | <60 g (2.1 oz) |
| Dimensions | 45(diameter)mm x 42(height) mm |
| Detector type | 128-pixel uncooled InGaAs photodiode array |
| Spectral range | 950 nm to 1650 nm |
| Optical resolution | <1.25% of center wavelength (for example, at 1000 nm, resolution is <12.5 nm |
| Pixel to pixel interval | 6.2 nm |
| Operating environment | –20°C to 40°C, non-condensing |
| Power requirement | USB powered (<500 mA@5V) |
Table 2: Key performance attributes of the MicroNIR 1700 spectrometer (source: JDSU).
A white reference measurement was obtained using a Spectral on disc; while a black (or dark) reference was obtained from a fixed place in the room. Absorbance values were calculated as - log (Sample-Black/White-Black) with the data being sent to the host computer as .csv files. Three replicate spectra were obtained from all samples. Replicas were averaged for data analysis in the chemometrics analysis.
Statistical analysis
Multivariate analysis was used to develop qualitative and quantitative models with NIR data sets. Discrimination and quantification of adulterated milk samples were evaluated using soft independent modeling of class analogy (SIMCA) and PLSR, respectively. Chemometricswas performed in Microsoft Excel [34].
The Excel file SIMCA template.xlsb is a pattern for performing DD-SIMCA, an advanced one-class classification method for class modeling, which allows theoretical computing of misclassification errors [35,36]. This technique is based on Principal Component Analysis (PCA) applied to the training data of a target class. The PLSR template.xlsb file presents the forms for measuring the performance of the projection to latent spaces/structures (PLS) regression. PLS regression is an innovative method for regression analysis using Excel, which allows development of a relationship between the matrix of predictors X and the vector of responses Y [34]. This technique is based on projection to latent structures.
Spectral characteristics
Figure 2 shows the normalization of five mean NIR spectra in the region of 950 nm to 1650 nm of pure milk and milk adulterated with water. Spectra obtained showed two prominent absorption bands centered at around 1070 nm and 1270 nm, respectively. These two bands were associated with strong O═H stretch overtone/combination modes of water and that was attributed to the short spectral range (from 950 nm to 1650 nm) of the spectrometer [37-39].
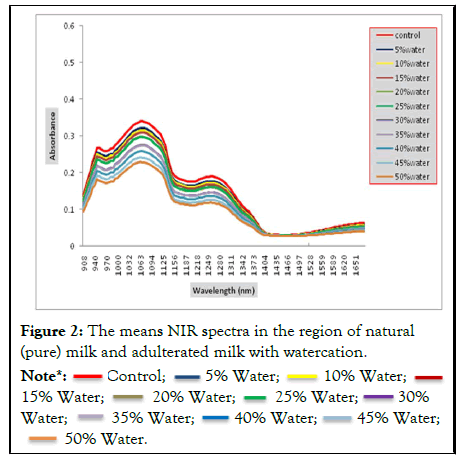
Figure 2: The means NIR spectra in the region of natural (pure) milk and adulterated milk with watercation.

Nevertheless, those mean NIR spectra are very similar to each other, and it is not easy to classify the spectra.
Therefore, the DD-SIMCA method was applied in this study to classify between natural (pure) and adulterated milk samples.
DD-SIMCA Classification
The application of DD-SIMCA using training dataset, demonstrated the method’s performance in absence of adulterated samples. For this purposes we verify the model established for natural or pure milk (30 samples), which collected from cows directly from farms.
Firstly, the test set includes natural or pure milk samples collected from cows from the same farms (10 samples), but not included in the training set previously. Secondly, we add (80) samples adulterated with water.
They help to verify the model’s performance regarding alien objects. Milk samples that are essentially dissimilar from the target class simulate (control sample) ‘low quality’ adulterated samples. Milk samples close to the target class imitate (control sample) ‘high quality’ adulterated.
Preliminary PCA performed on the whole data revealed both big similarities and differences between pure and adulterated milk samples collected from various dairy farms in Figure 3. Though all milk samples contain the same components, and these samples adulterated with varies level percentage of water. These lead to spectra discrepancies, as the spectral absorbance reflects components’ concentrations.
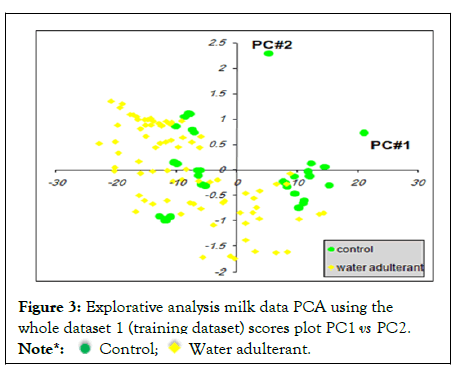
Figure 3: Explorative analysis milk data PCA using the whole dataset 1 (training dataset) scores plot PC1 vs PC2.

Individual decision rules were developed for adulterant and the control milk sample using the DD-SIMCA method. For this purpose, several milk samples of the target class were collected as the training set. The test set comprised of many samples of the target class and adulterated samples. To illustrate the result, pure milk samples were chosen as the target class and other adulterated samples were analyzed against a model developed for this class. A proportion of 75% of both the control and adulterated samples were collected in the training set whereas the test set contained 25%.
The PCA model with 4 principal components (PCs) explained 74% of the total variance. The decision rules were constructed for the chi-squared distributions, with Nh=2 and Nv=6 DoFs. For α=0.01 (left panel) all training objects were located inside the acceptance area. As for the test set (right panel), the samples originated from adulterated samples were located far from the acceptance area and could easily be classified as outliers in Figure 4. All test milk samples from the target class control milk (pure) were classified properly accepted in acceptance area.
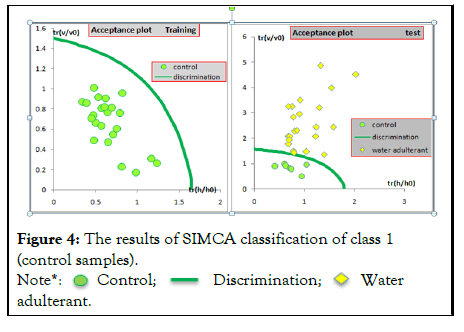
Figure 4: The results of SIMCA classification of class 1 (control samples).

SIMCA classification of the other classes was done in a similar way. The final results are shown in (Figure 5).
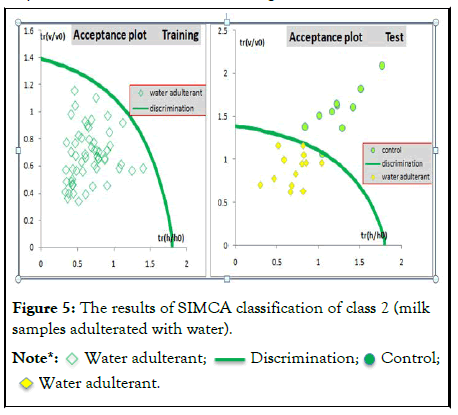
Figure 5: The results of SIMCA classification of class 2 (milk samples adulterated with water).

All test milk samples from target class adulterated milk with water were classified properly but some samples were located near to (discrimination line) the acceptance area and can easily be classified as control or adulterated samples. That could be attributed to the low concentration of the adulterants.
This study demonstrated that the PCA model with four PCs reliably separated the target class {control (pure) milk samples} from other class (adulterated milk samples).
The proposed classification method recognized such alien objects successfully.
Similar classifications were repeated for the cases where adulterated milk sample was selected as a target class. The results provided individual decision rules with specific values of α and β errors.
Quantification of adulterants in milk
The adulterant levels in milk were quantified using PLSR analysis to generate calibration models. Individual models were developed using the same spectral regions identified by classification analysis (Table 3).
| Adulterants | Analysis result PLSR | ||||||
|---|---|---|---|---|---|---|---|
| Factors | SEC | SECV | SEP | R2cal | R2val | R2pd | |
| water | 13 | 3.3 | 4.25 | 4.35 | 0.97 | 0.94 | 0.93 |
Table 3: Calibration and cross-validation results of multivariate models developed using portable spectrometers.
This PLSR calibration model was then used to test the prediction ability for each independent 25% test sample set, as shown in Figure 6.
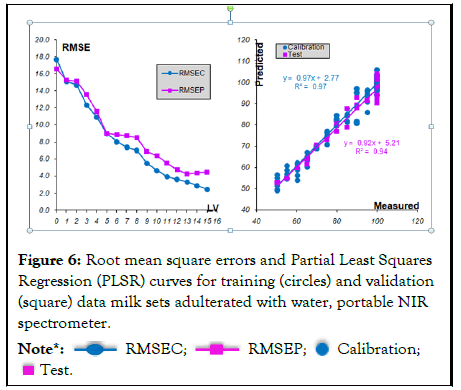
Figure 6: Root mean square errors and Partial Least Squares Regression (PLSR) curves for training (circles) and validation (square) data milk sets adulterated with water, portable NIR spectrometer.

This was an external validation part of the PLSR model because the spectral data used for the test set were not utilized in building the PLSR model. It can be seen from these figures that the PLSR model has very good prediction ability according to the root mean square error of prediction (RMSEP), which might be caused by the fact that the 25% test samples were not used in building the PLSR calibration model. RMSEP is a statistical measure of how well the model predicts new samples (not used when building a model). RMSEP expresses the average error to be expected in future predictions when a calibration model is applied to unknown samples.
PLSR models suggested a good correlation between infrared estimated concentrations and spiked adulterant levels in the milk in Table 3.
The PLSR scatter plots in Figure 6 illustrated a good fit between the reference levels and NIR predicted values for milk adulteration. Models were developed using 13, factors and explained more than 97% of the variance in the multispectral data set with R2val 0.94, revealing prediction robustness of the calibration models.
This region contains bands arising from the combination of OH symmetric and antisymmetric stretching modes of water [40]. It was noted that the error limit of ± 4.35% (v/v) was slightly higher than the minimum water content contained in a milk sample set. Therefore, when milk was adulterated by adding a very small volume of water within the error limitation value, it was not easy to determine the content of water in such a milk sample. Perhaps, due to the fact, that typical cow milk normally contains water as a main component. Thus, the small contamination of water in milk was not significantly appearing in the NIR spectrum [41].
These low SEP values can be associated with the presence of distinct and specific absorption signals for each adulterant used in the spiking process. The regression modeling reported here showed the same prediction abilities as those described in the earlier literatures [37,38] and had minor differences compared to that reported [21].
This study examined the applicability of a portable near-infrared (NIR) spectrometer (MicroNIR 1700) combined with a multivariate analysis method chemometrics in the monitoring of adulteration in cow milk with water.
The results revealed that the method is unique and suitable for detection of adulteration with water. Further study is recommended on the feasibility validation of this technique used in monitoring adulterants in cow milk.
[CrossRef]
[Pubmed]
Citation: Musa MA (2022). Evaluation of Portable NIR Assay for Detection of Milk Adulteration with Water. J Adv Dairy.10:599.
Received: 03-Mar-2022, Manuscript No. ADR-22-15761; Editor assigned: 07-Mar-2022, Pre QC No. ADR-22-15761 (PQ); Reviewed: 25-Mar-2022, QC No. ADR-22-15761; Revised: 04-Apr-2022, Manuscript No. ADR-22-15761 (R); Published: 11-Apr-2022 , DOI: 10.35248/2329-888X.22.10.599
Copyright: © 2022 Musa MA. This is an open-access article distributed under the terms of the Creative Commons Attribution License, which permits unrestricted use, distribution, and reproduction in any medium, provided the original author and source are credited.