Advances in dairy Research
Open Access
ISSN: 2329-888X
ISSN: 2329-888X
Research Article - (2018) Volume 6, Issue 2
Processed cheese was prepared with non-dairy ingredients of potato, peanuts and inulin separately, packed in 150 g polypropylene cups and stored at 7-8°C. During storage no significant change (p>0.05) was observed in the moisture and pH of all the cheese samples. Tyrosine content increased significantly (p<0.05) in potato and peanut added cheeses at 10th and 20th day of storage respectively. Free fatty acid content increased significantly (p<0.05) at 20th day of storage in potato and peanut added cheeses. No significant change (p>0.05) was observed in the tyrosine and free fatty acid content of control and inulin added cheeses. Electrophoretic study indicated maximum protein degradation in potato added cheese and minimum in inulin added cheese. Sensory characteristics did not show any significant change (p>0.05) whereas yeast and mould counts increased significantly (p<0.05). Potato and peanut incorporated cheeses showed lower shelf life than control.
Keywords: Processed cheese; Non-dairy ingredients; Electrophoresis; Tyrosine; Free fatty acids
Processed cheese (PC) is produced by heating a mixture of cheeses with different degrees of ripening in the presence of appropriate emulsifying salts [1]. Both dairy and non-dairy ingredients can be added to the mixture [2]. So far various non-dairy ingredients have been added to the processed cheese [3] like commercial konjac glucomannan to reduce 25%, 50%, 75% and 100% fat in processed cheese. Xylitol has been used to improve the functional properties of low-fat PC [4]. Onion (Allium odorum ) as a vegetable ingredient has been incorporated in processed cheese to improve its biological potential [5]. Oats has been added as a source of fibre to develop a functional processed cheese [6]. The incorporation of these non-dairy ingredients might affect the keeping quality or shelf life of processed cheese as the microbiological stability and safety of processed cheese depends largely upon the quality of the ingredients used [7].
Non-dairy ingredients of potato (Solanum tuberosum ) as a source of carbohydrate, peanut (Arachis hypogaea ) as a source of poly unsaturated fatty acids and inulin as a source of fibre were added separately into the processed cheese. The levels of these ingredients were optimized as 40% potato, 10% peanut and 6% inulin. The level of these ingredients does not affect the quality characteristics of processed cheese [8-10]. However, during storage some changes may occur so, present study was aimed to evaluate the effect of these non-dairy ingredients on the physicochemical, sensory and microbiological parameters of processed cheese during 30 day storage and compare with the control.
Materials
Cheddar cheese, both young (1-2 month ripened) and old varieties (6 months ripened) were obtained from the dairy plant of NDRI Bengaluru. Potatoes, peanuts and common salt were procured from the local market of Bengaluru. Frutafit HD (Inulin) in white powder form was obtained from M/s DKSH India Pvt. Ltd., Bengaluru. Trisodium citrate was used as emulsifying salt for PC preparation.
Manufacture of processed cheese
Processed cheeses were prepared with potatoes (40%), peanuts (10%) and inulin (6%) [8-10]. The cheeses were hot packed in polypropylene cups of 150 g capacity, covered with aluminium laminates and kept at room temperature to cool. The cups were heat sealed after 2 hours and stored at 7-8ºC for storage study. Samples were drawn randomly at intervals of 10 days for physico-chemical, sensory and microbiological evaluations. The samples were coded as CPCControl processed cheese, PO- Potato incorporated processed cheese, PE- Peanut incorporated processed cheese and IN- Inulin incorporated processed cheese.
Physico-chemical analysis
pH
The pH of processed cheese was measured [11]. The combined glass electrode was calibrated against standard buffer of pH 7.0 and 4.0 at 30°C. Approximately 20 g of grated cheese was macerated into a slurry using 20 ml of distilled water of 40°C. pH of cheese was measured directly by inserting the electrode into the slurry.
Moisture
Moisture content of processed cheese was determined by gravimetric method using 2-3 g grated cheese as per the methods [12].
Free fatty acids
The free fatty acid content of the processed cheese samples was determined as per the method [13] using BDI reagent. Fatty acids are released from glycerides during hydrolysis. One measure of free fatty acid is also expressed as acid degree value (Hydrolytic rancidity). Therefore, FFA/ADV is defined as the milli-equivalent of alkali (KOH) required to neutralize the free fatty acids in 100 g of fat.
Tyrosine value
The proteolysis of processed cheese was measured in terms of tyrosine content by Hull method [13] with some modifications.
UREA Polyacrylamide Gel Electrophoresis (PAGE)
The alkaline UREAPAGE of processed cheese was carried out to detect the protein degradation as per the method [15].
Sensory analysis
Sensory analysis was performed according to the methodology [16] on a 20 point score card using 8 trained panellists. The sensory panel was selected based on the normal sensitivity for basic color/ appearance, body/texture and flavor of cheese. Sensory panelists were well trained on evaluation of processed cheese and were made familiar with the test methods used. Duo-trio tests were used to determine a candidate’s ability to detect differences among similar products with different ingredients. Cheese slices (about 2-3 cm) of 10-15 g of each were presented in a covered glass petri plate in a random order with coded numbers. During each session of evaluation, three samples were presented at a time along with one reference (control) sample. The judged parameters were: appearance (4), body and texture (8) and flavour (8).
Microbiological analysis
Aseptically 11 g of the processed cheese was weighed and transferred to 99 ml of saline bottle. Further dilution to the desired level was carried out by serially transferring 1 ml of diluted sample to 9 ml sterile saline.
Coliform count
Enumeration of coliforms count of the cheese was done by the pourplate method [17] by plating 1 ml of product suspension employing Violet Red Bile Agar (Hi-Media). Plates were incubated at 37°C for 24-48 h in duplicates. Colonies with dark red coloration were counted and expressed as cfu/g of the product.
Yeast and Mould count
Yeast and Mould count were determined as [17] plating 1, 2 dilutions of processed cheese using Potato Dextrose Agar (Hi-Media). The pH of the medium was adjusted to around 3.5 by adding 1 ml of sterile tartaric acid solution (10%) to 100 ml of sterilized media, before pouring the media into plates. The count was taken after 3 days of incubation at 30ºC.
Statistical analysis
The statistical analysis was executed using the statistical software SPSS 16.0 [18]. One way analysis of variance (ANOVA) was performed and significant differences among samples were reported according to Duncan’s test at p<0.05.
Change in pH
The pH was found to increase up to the 10th day of storage and thereafter it decreased till the end of storage in all the nondairy ingredient added samples whereas the pH of control processed cheese increased till 20th day of storage and thereafter decreased till the end of storage however, no significant difference (p>0.05) was found among the samples (Figure 1). The reason for increase in the pH during the initial days of storage is unknown however the decrease in pH during storage could be due to the microbial spoilage. Reduction of pH during storage of processed cheese [18].
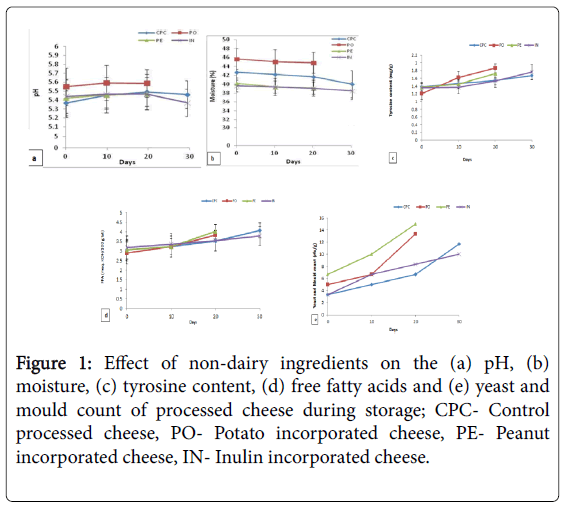
Figure 1: Effect of non-dairy ingredients on the (a) pH, (b) moisture, (c) tyrosine content, (d) free fatty acids and (e) yeast and mould count of processed cheese during storage; CPC- Control processed cheese, PO- Potato incorporated cheese, PE- Peanut incorporated cheese, IN- Inulin incorporated cheese.
Change in Moisture
Moisture content of the cheese samples decreased as the storage period increased irrespective of treatments. However, no significant difference (p>0.05) was found among the samples (Figure 1). The loss in moisture during storage of 30 days was 2.67% in control processed cheese which was higher compared to treated cheese samples. Although the initial moisture content was maximum in potato incorporated cheeses (45.69%) the loss of moisture was lower as compared to control. This might be due to the water binding properties of starch in potatoes which might have bound maximum moisture in the cheese. Inulin incorporated cheeses showed the minimum loss of moisture compared to all the treated samples which too is due to the higher water binding property of inulin. Since the packaging materials were same for all samples, the decrease in the moisture content could be attributed to the amount of free available water in the samples for evaporation.
Change in tyrosine value
A gradual increase in tyrosine value of all the samples was noticed during storage (Figure 1). Initial tyrosine content of 1.38 mg/g in control processed cheese increased significantly (p<0.05) to 1.67 mg/g on 30th day of storage however, at 10th and 20th day of storage the increase in the tyrosine value was non-significant (p>0.05). In case of potato incorporated cheese a significant increase (p<0.05) in the tyrosine content was observed at 10th and 20th day of storage. Peanut incorporated cheese also showed significantly higher (p<0.05) tyrosine content of 1.72 mg/g at 20th day of storage however at 10th day of storage the increase in the tyrosine value was non-significant (p>0.05). In inulin incorporated cheese no significant change (p>0.05) was observed in the tyrosine content up to 20th day of storage however, it increased significantly (p<0.05) to 1.76 mg/g at 30th day of storage. The increase in the tyrosine content could be due to the breakdown of proteins by the presence of higher microbial growth and the action of proteolytic enzymes that are released during the lysis of microbial cells, thereby increasing the amount of tyrosine in the product. The increased rate of tyrosine content in PO and PE could be due to the presence of increased microflora in these samples which caused more proteolysis as compared to IN and CPC.
Changes in free fatty acid (FFA) content
Free fatty acid content of all the samples increased throughout the storage irrespective of the treatments as shown in (Figure 1). Initial FFA content of 3.04 in control processed cheese increased significantly (p<0.05) to 4.07 at 30th day of storage however up to 20th day of storage the increase in FFA content was non-significant (p>0.05). In case of samples with non-dairy ingredients a significant increase (p<0.05) was observed in the FFA content of potato and peanut incorporated cheese at 20th day of storage. However in inulin added cheese no significant difference (p>0.05) was found in the FFA content during storage. The significant increase (p<0.05) in the FFA content of potato incorporated cheese could be due to the increased activity of yeast and moulds in potato added cheese which had higher moisture and higher carbohydrate content whereas, in peanut added cheese it could be due to the higher fat content.
Protein degradation- Alkaline Urea PAGE
Electrophoretrograms of all the cheese samples are shown in (Figure 2). Protein bands were identified by comparison with standards sodium caseinate where, β - Casein (β-CN) and α-Casein α-CN) positions are shown (lane S).Control processed cheese (lane-1) shows 3 prominent bands i.e. β-Casein, α-Casein and αs 1-Casein (a degraded product of α-CN) positioned below the α-Casein. No degradation was found in any of the samples at 10th day of storage. However, at 20th day of storage the samples degraded and maximum degradation was observed in potato incorporated cheese followed by peanut incorporated cheese. The degradation of α and β-CN in potato incorporated cheese is clearly indicated by the decrease in the intensity of α and α-CN. More protein (α-CN) degradation in potato incorporated cheese was observed compared to control and other samples. This might be because of the higher rate of microbial growth in it. The higher carbohydrate and moisture content of the potato incorporated cheese might have favored the growth of microbes leading to more proteolysis. This was also confirmed from the tyrosine content of potato incorporated cheese which showed higher tyrosine content compared to control and other cheese samples during storage (Figure 2).
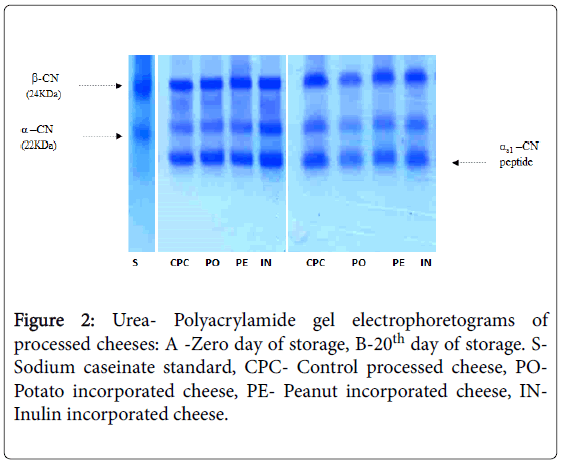
Figure 2: Urea- Polyacrylamide gel electrophoretograms of processed cheeses: A -Zero day of storage, B-20th day of storage. SSodium caseinate standard, CPC- Control processed cheese, POPotato incorporated cheese, PE- Peanut incorporated cheese, INInulin incorporated cheese.
Sensory analysis
The changes in the sensory parameters during storage are shown in (Figure 3) Appearance score of all the samples was within the range of 3.3-3.8 and no significant change (p>0.05) was observed during storage. Body and texture scores were also within a short range in all samples. Flavor score varied a little among the samples and was highest for control cheese and lowest for peanut added cheese however no significant change (p>0.05) was observed in the samples during storage. After 20th day of storage visible mould growth was observed in potato and peanut added cheeses and were not served for sensory evaluation.
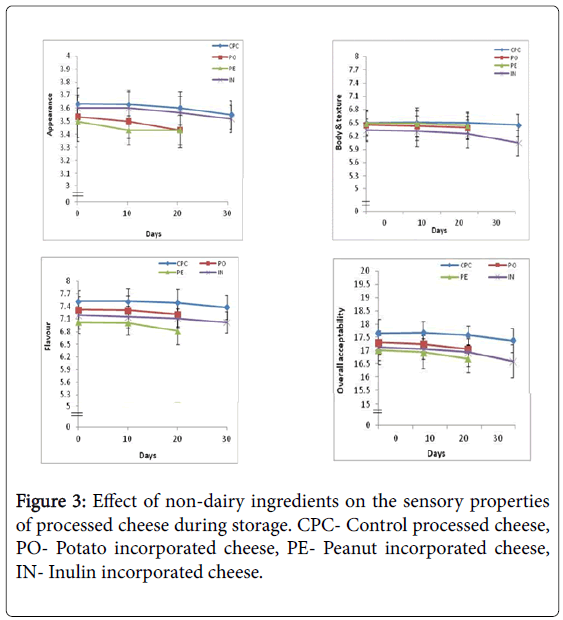
Figure 3: Effect of non-dairy ingredients on the sensory properties of processed cheese during storage. CPC- Control processed cheese, PO- Potato incorporated cheese, PE- Peanut incorporated cheese, IN- Inulin incorporated cheese.
Microbial analysis
Yeast and mould count: Yeast and mould count was found to increase during storage (Figure 1). The initial yeast and mould count of 6.66 cfu/g was maximum in peanut incorporated cheese followed by 5.0 cfu/g in potato incorporated cheese. Control processed cheese showed initial yeast and mould count of 3.33 cfu/g. Yeast and mould counts increased as the storage progressed and it was found that yeast and mould count of potato and peanut incorporated cheese increased at a much higher rate as compared to control. The rate of increase was lower than in peanut cheese wherein it increased from 6.66 to 15 cfu/g at 20th day of storage. The higher rate of increase in the yeast and mould counts in peanut and potato incorporated cheese might be due to the higher carbohydrate content of these cheeses.
Coliform count
In the present study, coliforms were found to be absent in all the fresh samples and no coliform growth was observed till the end of storage. This indicates that proper hygienic measures were taken during the production of the cheeses.
The study demonstrated that potato and peanut added cheeses deteriorated faster compared to control cheese and decreased the shelf life of processed cheese by about 10 days. This suggests that processed cheese with these non-dairy ingredients should be consumed within a short period and not stored for long. Inulin incorporated cheese however showed a longer shelf life than potato and peanut added cheese.
The authors declare that they have no conflict of interest.
The first author acknowledges Director, ICAR- National Dairy Research Institute, Karnal for providing institute fellowship to carry out the proposed work.