Advances in dairy Research
Open Access
ISSN: 2329-888X
ISSN: 2329-888X
Research Article - (2017) Volume 5, Issue 1
Keywords: NIR-spectroscopy; Formalin: Milk adulteration; PCA; PLS-DA; PLS regression
Milk contains many essential nutrients like protein, lactose, fats, minerals and vitamins in an appropriate or balanced proportion and is an integral part of human diet which provides a quick and easy way of supplying these nutrients to the diet within relatively few [1,2]. For better health and maintenance of life and according to food guide pyramid, it is recommended for an adult to consume 2-3 portions of dairy based food commodities in a day. Quality of milk can be only preserved by securing its purity and cleanliness [3]. Decent quality milk is needed for quality dairy items [4] and for better health of consumer. Unfortunately, in the developing countries, milk is the most adulterated food commodity. In recent days adulteration of milk is one of the severe concerns dairy sector is facing, which not only causing major economic losses for the dairy industries but is health threatening call as well for consumers [5]. Overpopulation, rapid urbanization and scattered colonization are the few main factors increasing the demand of milk production [6]. To meet the linkage between demand and supply of milk, dealers are often found to involve in milk adulteration [7].
Adulteration of milk is a malpractice in which dealers either incorporate cheap substances or subtract valuable components from milk to increase its volume and thus profit margin [8]. Excessively documented adulterants used to adulterate milk arediluent (water and ice) thickening agents (starch, glucose, urea, flour, salt and chlorine etc.) [9], preservatives (sodium carbonate, sodium bicarbonate and formalin etc.), reconstituting agents (seed oils, cane sugar and animal fats and milk powder), cosmetic agents (Detergent/soap and bleaching powder etc.) melamine and others [2,6,10-15].
Formalin is used as an antiseptic, disinfectant and preservative. It is used as an adulterant in milk to increase the shelf life for long distance transportation of milk without refrigeration, saving the supplier a neat packet by cutting electricity costs. That is highly toxic causes liver and kidney damages. It is a 37% aqueous solution of the pungent gas formaldehyde and has the chemical formula HCHO and is a potentially hazardous toxic or injurious substance. It is a potent carcinogen [16], and an elevated dose of formalin can cause diarrhoea, vomiting and abdominal pain. It may also disturb the optic nerves and may cause blindness [10,17-24].
Thus it is obvious that potentially injurious substances like formalin are being added to milk. Despite food legislation, adulteration remains uncontrolled, furthermore legal steps laid down in the PFA Act are extremely difficult to maintain due to inadequate and untrained man power and laboratory facilities [25].
Keeping in view the deleterious effects of formalin in milk, the present study is therefore planned to investigate a new sensitive NIR Spectroscopic method combined with multivariate analysis to authenticate as well as to quantify the level of formalin adulterant in cow milk. This method is non-destructive, cheap, no need of much sample preparation and having good sensitivity and reproducibility.
Camel milk samples preparation
In this study, four different types of cow milk samples were collected from Nizwa regions of Sultanate of Oman and were investigated. Those cow milk samples were then adulterated with formalin at eight different percentage levels: 0%, 1%, 3%, 5%, 7%, 9%, 11%, 13% and 17% of formalin. The total number of samples used was 161: 19 pure cow milk samples, 142 adulterated with formalin. For PLS regression all the samples were joined together and split into two sets, a training set (70% of the samples) and a test set for validation (30% of the samples).
NIR spectroscopic analysis
All samples were measured using a PerkinElmer Frontier NIR spectrophotometer in absorption mode in the wavelength range from 700-2500 nm, at 2 cm-1 resolution and using a 0.2 mm path length CaF2 sealed cell. Prominent absorption peaks were appeared in the region from 4000 to 7588 cm-1 wavenumber.
Statistical analysis
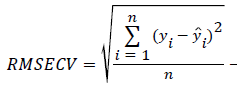
Microsoft Excel 2010 and The Unscrambler version 9.0 by Camo were used for statistical analysis. The PCA, PLS-DA and PLS regression models were built for both pure and adulterated cow milk samples. Spectral pretreatments, such as standard normal variate (SNV) and 1st derivative with Savitzky-Golay smoothing 11 points were carried. Full cross validation was used to validate the PLS-DA models. For PLS regression all the samples were joined together and split into two sets, a training set (70% of the samples) and a test set for validation (30% of the samples). External cross validation was used to validate the PLS regression models built with the training set. The Root Mean Square Error of Cross Validation (RMSECV) was used as an internal indicator of the predictive ability of the models. RMSECV is calculated using Eq. 1:
 --------------(1)
where yi is the measured value (actual % of adulteration),  is the % of adulteration predicted by the model, and n is the number of segments left-out in the cross-validation procedure, which is equal to the number of samples of the training set. Smaller values of RMSECV are indicative of a better prediction ability of the model.
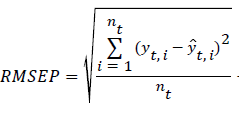
The RMSEP is a statistical measure how well the model predicts new samples (not used when building the model). It is calculated using Eq. 2:
 -------------------(2)
where yt,i is the measured value (actual % of adulteration),  is the % of adulteration predicted by the model, and nt is the number of samples in the test set. RMSEP expresses the average error to be expected in future predictions when the calibration model is applied to unknown samples.
Near infrared spectra
Figure 1 shows the NIR spectra of all the samples ranging from 10000-4000 cm-1 in term of wavenumbers while in term of wavelength ranging from 700-2500 nm using a 0.2 mm path length CaF2 sealed cell.

Figure 1: NIR spectra both for pure and formalin adulterated milk samples without pre-processing.
The spectra in Figure 1 show a scattering effect due to milk and formalin solid particles and white colors. Spectral pretreatments, such as SNV were used to remove the scattering effect as shown in Figure 2.

Figure 2: NIR spectra both for pure and formalin adulterated milk samples after SNV pre-processing.
Although the spectra appear to be very similar, the application of a 1st derivative function with Savitzky-Golay smoothing 11 points were applied at 2 polynomial order shows that there are clear differences in the spectral absorption regions as shown in Figure 3.

Figure 3: 1st derivative NIR spectra both for pure and formalin adulterated milk samples.
It can be seen from the spectra in Figures 3 that there are prominent absorption peaks at wavenumber 4000 cm-1 and 7000 cm-1 for both pure and formalin adulterated milk samples.
In order to visualize the effect of variation among the four different types of cow milk an alternative approach of principal components analysis (PCA), was applied in that a PCA model was built as shown in Figure 4. PCA is a standard multivariate data analysis exploratory tool. It is used to reduce the dimensionality of a complex data set without much loss of information, to extract the most important information from the data table, to identify noise and outlier in the data set. It is a way of identifying the underlying patterns in data for further analysis using other techniques. The procedure of PCA is like that it converts a set of correlated variables into a new set of uncorrelated variables called principal components. PCA redistributes the total variance of the data set in such a way that the first principal component has maximum variance, followed by second component and so on.

Figure 4: PCA score plot for four different types of cow milks samples.
Variance PC1>Variance PC2>… Variance PCk
Total variance=Variance PC1+Variance PC2+ … Variance PCk
The covariance of any of the principal component with any other principal component is zero (uncorrelated) and they are orthogonal to each other.
It can be seen from the PCA score plot that there is complete differentiation and separation among those four different types of milk samples. They are spaced and grouped in the specific regions of the PCA score plot. The milk samples those are similar are clustered in one group than the different one.
Similarly, Partial least-squares discriminant analysis (PLS-DA) model was built for the spectral data between pure and with 5% formalin milk adulteration as shown in Figure 5. PLS-DA model can be used as an identifaction tool to check formalin adulteration in cow milk. If there is any amount of formalin in cow milk they will occupy the space in between the pure and adulterated samples of the Figure 5.

Figure 5: PLS-DA model for the pure cow milk and with 5% formalin adulteration.
It can be seen from Figure 5 that there is a clear discrimination between the pure cow milk samples as well as with 5% formalin milk adulteration. The RMSECV value for PLSDA model was found 0.086 with with R square value of 0.969. The PLSDA model with minimum error that is RMSECV and with highest correlationship value i.e. R is the best one.
PLS regression results
To predict the level of formalin adulteration in cow milk samples PLS regression model was built by using 70% of the samples as a training set with formalin at eight different percentage levels: 0%, 1%, 3%, 5%, 7%, 9%, 11%, 13% and 17% of formalin. PLS regression models are shown in Figures 6 and 7. PLS finds a set of orthogonal components that maximize the level of explanation of both X and Y provides a predictive equation for Y in terms of the X’s.

Figure 6: PLS calibration plot for pure and formalin adulterated milk samples.

Figure 7: Residual validation variance plot for the PLS regression model.
It can be seen from Figure 6 that its having small value of RMSECV=1.38% for 4 factors with R2=93% and of 0.95 correlationship. The Root Mean Square Error of Cross Validation (RMSECV) is used as an internal indicator of the predictive ability of the models.
The Residual Validation Variance plot for the PLS regression model was also built as shown in Figure 7. It shows that three components have completely explained the whole data.
This PLS calibration model was then used to test the prediction ability of the PLS model for an independent 30% test samples set (described in the experimental section) as shown in Figure 8. This is an external validation part of the PLS model because the spectral data used for test set was not utilized in building the PLS model.

Figure 8: Prediction plot for the 30% test samples set for pure and formalin adulterated milk samples.
It can be seen from Figure 8 that the PLS regression model is having a very good prediction abilty with RMSEP value=1.45% because those 30% test samples were not used in building the PLS caliberation model. RMSEP is a statistical measure how well the model predicts new samples (not used when building the model). RMSEP expresses the average error to be expected in future predictions when the calibration model is applied to unknown samples.
It is concluded that NIR spectrscopy combined with PCA, PLS-DA and PLS regression models are suitable technique for detection and quantification of formalin adulteration in milk samples. Formalin is highly toxic causes liver and kidney damages. It was further investigated that PLS-DA model can be used as an identifaction tool while PLS calibration models can be used as a quantification tool and it was found that this PLS model is having very good prediction ability with RMSEP value of 1.45% and can quantify the lowest level of formaline adulteration less than 2%.