International Journal of School and Cognitive Psychology
Open Access
ISSN: 2469-9837
ISSN: 2469-9837
Research Article - (2017) Volume 4, Issue 3
This paper deals with cognitive diagnostic analysis of the reading comprehension part of the Standardized Test of English Proficiency (STEP-RC) developed and administered by the National Center for Assessment in Saudi Arabia. The Least Squares Distance Model (LSDM) was used to obtain probabilities of correct performance on cognitive attributes of STEP-RC items across levels of the underlying ability measured by the test. Among other results, cutting scores on the scale for correct performance on targeted attributes are provided for the purposes of criterion-based diagnostic decisions. Aspects of the validity of the cognitive attributes are also examined in the LSDM framework. The methodology and procedures illustrated in this study can be applied in different areas of assessment and cognitive analysis.
Keywords: Cognitive diagnosis; Item response theory; Reading comprehension; Testing; Assessment
Over the past couple of decades, the research on assessment in psychology, education and other behavioral fields has shown an increased interest in the development and application of Cognitive Diagnostic Models (CDMs) to better understand cognitive processes of thinking, , and performance. In general, CDMs aim to identify the degree to which individuals have mastered specific attributes (e.g., skills, cognitive operations and processes, knowledge state, behavior patterns, etc.) that underlie the success (or endorsement) on assessment items/questions. The set of attributes for an assessment instrument (test, questionnaire, or inventory) is usually referred to as cognitive structure of that instrument (e.g., Gitomer and Rock in 1993; Irvine and Kyllonen in 2002; Nichols, Chipman, and Brennan in 1995; Riley and Greeno in 1988). For example, the cognitive structure of an algebra test may consist of the examinees’ knowledge and skills on removing parentheses, collecting terms, removing denominators, and so forth [1]. In a clinical context, [2] used CDMs to assess mental disorders. For each item of a clinical questionnaire, they specified which of the disorders anxiety, somatoform, thought disorder, and major depression, are involved in providing a positive response to the item. Then, using the popular DINA model for cognitive diagnostic [3,4], they assessed which disorder is most likely present in each patient and the prevalence of these disorders for the study population [2].
Knowledge about cognitive structures can help test developers, psychologists, and educators to (a) construct items with desirable measurement and cognitive characteristics, (b) develop teaching strategies that target specific cognitive and processing criteria, (c) operationalize constructs, and (d) better understand thinking processes and behavior patterns. The validation of cognitive structures is a key problem and involves the integration of cognitive cognitive psychology and CDMs [5-16].
As a comprehensive review of cognitive diagnosis models (CDMs) is not targeted with this study, only some brief points are highlighted ext. CDMs have been developed in a variety of frameworks such as (a) item response theory (IRT), [17-19], (b) rule space methodology [14,20-22], (c) latent class modeling [6,9,23-25], (d) IRT-based latent class modeling [26-28], and (e) Bayesian modeling [29]. Although practical applications of CDMs exist in different areas of assessment, such as mathematics [30-33], language testing [8,34-37], and psychology [12,16], the current practice is still behind theoretical and methodological developments in the field of cognitive diagnosis modeling. Particularly useful, yet underrepresented in published research, are CDM studies that (a) examine attributes which have been targeted in the process of developing specific large-scale assessment tools and (b) take into account the context of assessment and align the results with the scale of scoring and psychometric analysis of the specific tool. In an attempt to contribute to the practice of CDM applications from this perspective, the present study deals with CDM analysis of attributes that are expected to underlie the success on reading comprehension items in the context of large-scale assessment of English proficiency in Saudi Arabia. Specifically, cognitive attributes targeted with the development of the reading comprehension section of the standardized test of English proficiency in Saudi Arabia are analyzed using the least squares distance model for cognitive diagnosis (LSDM) [17,18]. The purpose of the study and comments on the rational for selecting specific attributes and the LSDM for their analysis in the context of STEP assessment are provided next.
Basic IRT concepts
Assessment instruments in education, psychology, and related fields are designed to measure latent variables such ability, attitude, self-efficacy, depression, and other latent variables of interest. A main drawback of the Classical Test Theory (CTT) is that the score of an examinee on a test depends on the difficulty of the test items. A higherlevel of measurement quality is provided with the item response theory (IRT), where the score of an examinee does not depend on the specific sample of test items. This section provides a brief description of basic IRT concepts to facilitate the understanding of the CDM model used in this study. For more information, the reader may refer to the IRT literature [38-41].
Dimensionality: A test (or questionnaire) is called unidimensional if its items measure a single ‘dimension’ (ability, trait, behavior) e.g., a test that measures algebra skills or reading comprehension. If the test items tap on two or more ‘dimensions,’ the test is called multidimensional e.g., IQ test that measures verbal ability, mathematical ability, special reasoning skills, etc.
Logit scale: Under IRT, the location of a person on the continuum of the latent trait (ability) measured by a test is called ability score of that person. The units of the ability scale, called logits, represent the natural logarithm of the odds for success on the test items. For example, if a person succeeds on 80% and fails on 20% of the test items, the odds ratio for the success on the test is 4/1=4. Thus, the ability score of this person is the natural logarithm of 4, which is 1.4 (rounded to the nearest tenth), i.e., about one and a half units above the origin of the logit scale when the person ability distribution is centered at the origin (zero) of the scale. Theoretically, the ability scale ranges from -∞ to +∞, but in practice it is typically restricted, say, from -4 to 4, with ‘zero’ being the origin of the logit scale.
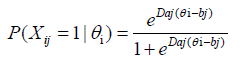
IRT models: With the use of an appropriate IRT model, one can estimate the probability with which an examinee will answer correctly any test item. For example, under the two-parameter logistic (2PL) model in IRT for unidimensional tests with binary items, the probability of correct response on an item is estimated as follows:
 (1)
(1)
where Xij is the binary score of person i on item j (1=correct answer; 0=otherwise), θi is the ability score of the person; aj is the item discrimination, and bj is the item difficulty; (D is a scaling factor).
In cases when it is appropriate to fix the discrimination index (aj=1), the 2PL model with Equation 1 becomes a one-parameter logistic (1PL) model. Under both 1PL and 2PL models, the assumption is that there is no “guessing” (or similar effects) in the responses on test items. However, if this is not the case, a third item parameter is added in Equation 1, denoted ci, to account for guessing effects. The resulting IRT model is called three-parameter logistic (3PL) model by Hambleton, Swaminathan, and Rogers in 1991 [39].
Item characteristic curve: The graphical depiction of the probability values obtained with Equation 1 is referred to as item characteristic curve by Hambleton et al. in 1991 [39]. Figure 1 provides the ICCs of two hypothetical binary items on a logit scale from -4 to 4. The item difficulty, bi, is the location at the logit scale, where the probability of correct item response is 0.5 (50% chance for correct answer), whereas the item discrimination indicates the steepness of the ICC of the item. In Figure 1, the difficulty of item 1 is one unit above the origin of the logit scale (b1=1), whereas the difficulty of item 2 is one unit below the origin (b2=-1). Thus, item 1 is more difficult than item 2. However, item 2 better discriminates persons with abilities within the middle range of the logit scale (say, from -2 to 2), compared to item 1, because the ICC of item 2 is steeper than the ICC of item 1 in that range.

Figure 1: Item characteristic curves of two hypothetical items: Item 1 (a1=0.5, b1=1) and Item 2 (a2=1.5, b2=-1).
Conditional probability: The probability of correct item response at a given location of the logit scale is caller conditional probability as it depends on the ability score of the person at that location. For example, the conditional probability for success on Item 1 for people located at the origin of the scale (average ability, θ=0) is 0.38 (38% chances of correct response), whereas the conditional probability of correct response on Item 2 for people at the same location on the logit scale (θ=0) is 0.82 (i.e., 82% chance of correct response) (Figure 1).
The standardized test of English proficiency (STEP)
The Standardized Test of English Proficiency (STEP) is developed and administered by the National Center for Assessment (NCA) in Riyadh, Saudi Arabia (www.qiyas.org). English is a foreign language for people who take STEP. The test scores of examinees are used primarily by government and private institutions for the purposes of admission to educational and training programs, scholarship awards, employment, job promotion, and so forth. The test consists of 100 multiple-choice items grouped into four parts, Reading Comprehension (40 items), writing (30 items), listening comprehension (20 items), and compositional analysis (10 items). The reading comprehension part of the test (STEP-RC), which is of interest in this study, includes passages that consist of up to three paragraphs, with 300 words to 450 words per passage. These passages cover a wide range of non-technical topics on science, arts, social customs and/or traditions, environment and the like. The STEP-RC items are designed to assess abilities such as finding relevant information, general understanding, referential, reasoning (e.g., logical relations and inferences), and evaluation.
Purpose of the study: The purpose of this study is to identify attributes that are expected to underlie the examinees’ success on STEP-RC items and to analyze those attributes in the framework of IRT scaling and item analysis adopted with the large-scale STEP assessments. Under the large-scale assessments at the NCA in Saudi Arabia, STEP-RC data are analyzed with the use of the 3PL model in IRT. As described earlier, given the score on an examinee on the logit scale, on can estimate the conditional probability of that person for success on any item; (graphically, this is illustrated for two items in Figure 2). Under the purpose of this study, given the ability score of a person on the logit scale, the gal is to obtain fine-grained information about the success of the person on each of the latent (hidden) attributes required for correct responses on STEP-RC items. That is, given the ability score of a person on the logit scale, one can obtain the conditional probability of success on each attribute. Graphically, this will result in the development of attribute probability curves (APCs) as an analog to the item characteristic curves described earlier in Figure 2. In addition, the CDM-based analysis in this study is designed to provide estimates of the conditional probabilities across the logit scale for correct performance on (a) specific patterns of attributes and (b) at least (up to) a desired number of attributes.

Figure 2: Probability curves of seven attributes of reading comprehension items of the STEP-RC.
Under the purpose of the study, an appropriate choice for CDMbased analysis was the LSDM for cognitive diagnosis [17,18] as it provides the targeted results on the IRT logit scale. Such results can help to better understand the cognitive attributes of interest, their role for success on STEP-RC items, setting standards for attribute-based performance, and so forth.
Models of reading comprehension difficulty
Previous studies provide a variety of relatively comprehensive models of attributes related to item difficulty in reading comprehension tests [8,35,42-48]. For example, Embretson and Wetzel [8] developed a cognitive processing model of reading comprehension which describes sources of cognitive complexity related to text representation (encoding and coherence of the text passage) and response decision (encoding and coherence processes, text mapping, and evaluation of truth status). Sheehan and Ginther in 2006 modeled difficulties of items from the Test of English as a Foreign Language (TOEFL) by using three types of effects related to item and passage features to operationalize the activation processes by which an individual selects a response alternative, namely: location effects, correspondence effects, and elaboration of information.
An even more comprehensive cognitive model of the construct of reading comprehension was proposed by Gorin and Embretson [35] in the context of the GRE-V test of verbal ability. Their model is based on slight modifications of the components of text representation (TR) and decision procession (DP), as defined in the previous two models [8], with the addition of a third component referred to as GRE-specific factors. One aspect of this component is the construction of short passages (150 words) and long passages (450 words) under the hypothesis that memory load and integration requirements for short passages could be significantly less than those for long passages. Another aspect is the use of a GRE-specific variable which is coded to represent additional decision-processing requirements involved with solving questions that had a special format, under the expectation that increased memory and cognitive processing load could increase the difficulty parameter of the item [35].
It should be emphasized that the models described here above focus on the cognitive aspect of reading comprehension difficulty. The component model of reading (CMR) [42] was proposed to take into account the role of cognitive, ecological, and psychological domains in explaining reading difficulty. A number of studies have found that, apart from the widely recognized cognitive domain of the CMR, the difficulty in reading comprehension is explained also by both ecological variables, such as country’s GPD, family, and school, and psychological variables, such as motivation and interest in , individual differences, and styles [42,49-52].
Cognitive attributes for the STEP-RC items
It should be clarified from the onset that this study is not intended to propose (or use an existing) comprehensive cognitive model of reading comprehension. As noted earlier, the STEP-RC items are designed to assess cognitive processes and skills such as the finding of relevant information, understanding, referential, reasoning, and evaluation. Therefore, the attributes used in this study relate to cognitive operations and skills targeted with the development of STEPRC items. In light of the reading comprehension models discussed in the previous section, the attributes used here can be seen as related to the response decision (RD) part of the cognitive processing model of reading comprehension, which includes encoding and coherence processes, text mapping, and evaluate truth status) [8]. Under the RD modeling, (a) encoding and coherence are processes of retrieving relevant information and connecting word meanings and propositions into a meaningful representation of the text, (b) text mapping is a process of relating the propositions in the question and response alternatives to the information retrieved from the passage, and (c) evaluating truth status is a process of falsification and confirmation of response alternatives [8,35].
The development of STEP-RC items was guided by explicitly targeted cognitive operations and skills that reflect the processes of RD modeling. Specifically, an operationalized analysis of the RD processes of encoding and coherence, text mapping, and evaluating truth status by experts in the field of reading comprehension at the NCA in Saudi Arabia resulted in the formulation of seven attributes of reading comprehension, labeled here as (a) finding relevant information, (b) referential, (c) writer’s purpose, (d) inclusion/exclusion, (e) reasoning, (f) evaluation, and (g) understanding. The description of these attributes is provided with Table 1.
| Attributes | Description/item stem example |
|---|---|
| A1: Find relevant information | To retrieve text information as required by the item stem. |
| Example: Based on paragraph 4, what age was Ibn Battuta at the time of his return home? | |
| A2: Referential | To relate two nominal entities that refer to same thing, perso, etc., such as pronouns relative and demonstrative pronouns. |
| Example:What are referred to by these amazing creatures in paragraph 1? | |
| A3: Writer’s purpose | To describe the writer’s goal implied by the context of his/her discourse. |
| Example: The author’s purpose in paragraph (1) is to__________. | |
| A4: Inclusion/exclusion | To determine which information is included or excluded in the text. |
| Example: In paragraph 3, which of the following is not included as an example of the significance of honey? | |
| A5: Reasoning | To discern, comprehend, and analyze logical relationships among words or groups of words within sentences and passages. |
| Example 1: From paragraph 1, one can infer that Ibn Battuta ______. | |
| Example 2: Mr. Fish lost his job because_________. | |
| Example 3: According to paragraph 2, why is al-Rihla an important historical account? | |
| A6: Evaluation | To summarize or reconstruct a text. |
| Example 1: The best title for the passage is___________. | |
| Example 2: If the text continued, what would the next paragraph be about? | |
| A7: Understanding | To generally comprehend the text, give the correct meaning of a word or expression and the gist of the paragraph. |
| Example 1: What other word in paragraph 4 has the same meaning as incorrect? | |
| Example 2: Stress, anxiety, worry and depression are all examples of______. |
Table 1: Description of seven attributes of reading comprehension difficulty of STEP-RC items.
The least squares distance model (LSDM)
The LSDM [17] is a conjunctive CDM. Unlike any other CDM, the LSDM does not require item score information, as long as IRT estimates of the item parameters are available under a tenable data fit of a unidimensional IRT model- the one-parameter (or Rasch), two-parameter, or three-parameter logistic models (1PL, 2PL, or 3PL). Specifically, using IRT estimates of the item parameters and the Q-matrix, the LSDM provides estimates of conditional probabilities for correct performance of attributes across the logit scale of IRT item calibration, as well as information about potential Q-misspecifications for individual test items. An extension of the LSDM [18] provides additional information about the underlying K attributes by estimating the conditional probabilities that (a) specific patterns of p attributes, (b) exactly p attributes, and (c) at least p attributes will be correctly performed by individuals at a given location, θ, on the IRT logit scale (p=1, …., K). This extension provides also a disjunctive version of the LSDM under which the correct response (or endorsement) of an item may occur when at least one of the attributes associated with the item is correctly applied [18]. A brief description of the conjunctive LSDM, which is used in the present study, is provided next.
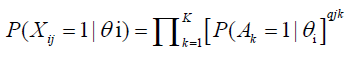
Under the conjunctive LSDM, the probability of correct item response is presented as a product of the probabilities of correct processing of the attributes required by the item, that is
 (2)
(2)
where: Xij is the binary (1/0) response of individual i on item j, θi is the trait score (in logits) of individual i, Ak is the kth attribute, and qjk is the element of the Q-matrix for item j and attribute k; (qjk=1 if item j requires attribute Ak and qjk=0, otherwise).
Under the LSDM extension,  is the condition probability that a person at the trait level θ will perform correctly a specific pattern, ν, of p attributes. As shown by Dimitrov and Atanasov [18], this probability can be presented as follows:
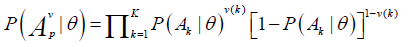 (3)
(3)
where ν(k) is the kth binary element in pattern ν- a combination of p (out of K) elements;
ν(k)=1 if attribute Ak participates in pattern ν and ν (k) =0, otherwise.
It is shown also that the condition probability for a person at the trait level θ to perform correctly exactly p attributes, denoted  , can be presented as
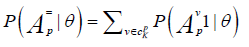 (4)
(4)
where is estimated via Equation 3 and the summation is performed by rows of the  matrix, which contains all possible patterns of p (out of K) elements; (that is,
  ).
).
Furthermore, it is shown that the condition probability for a person at the trait level θ to perform correctly at least p attributes, denoted  , can be represented as
 (4)
(4)
where is estimated via Equation 4 by Dimitrov and Atanasov [18].
Validation of LSDM attributes: The LSDM results are interpreted in light of heuristic criteria for validation of the attributes required for correct answers on the test items. Specifically, the attribute probability curves (APCs) should exhibit logical and substantively meaningful behavior in terms of monotonicity, relative difficulty, and discrimination. For example, if the attributes identified in the present study do underlie the examinees’ performance on reading comprehension items, it is logical to expect that (a) the APCs would increase with the increase of the underlying ability for reading comprehension; (b) the relative difficulty of the attributes would make substantive sense; and (c) more difficult attributes would discriminate better among high-ability examinees and, conversely, relatively easy attributes would discriminate better at low ability levels.
Misspecifications in the Q-matrix are investigated by examining the level of recovery of the item characteristic curve (ICC) for each item by the product of the probabilities of correct performance on the attributes (i.e., the product of APCs) associated with the respective item in the Q-matrix. The mean of the absolute differences between the ICC and its LSDM recovery for an item across the ability levels is referred to here as the mean absolute difference (MAD) for this item. Ideally, MAD=0 would indicate perfect ICC recovery. Based on previous studies on ICC recovery for LSDM applications with real and simulated data (e.g., Dimitrov, Ma, Ma, Çetin, and Green, Romero, Toker) [17,53-55], we use here the following working classification for the degree of ICC recovery: (a) very good (MAD<0.02), (b) good (0.02 ≤ MAD<0.05), (c) somewhat good (0.05 ≤ MAD<0.07), (d) somewhat poor (0.07 ≤ MAD<0.10), (e) poor (0.10 ≤ MAD<0.15), and (f) very poor (MAD ≥ 0.15). A more refined analysis of ICC recovery with the LSDM, based on simulated manipulations in test length, number of attributes, relative difficulty of attributes, and other factors of misspecifications in the Q-matrix, is provided in a dissertation work by Romero [54]. For practical applications of the LSDM in different fields of assessment, the reader may refer, for example, to Greiff, Krkovic, and Nagy, Ma, Ma, Çetin, Green, and Toker [53,55,56].
As described earlier, the input information for LSDM analysis is the Q-matrix and IRT estimates of the item parameters under a unidimensional IRT model (1PL, 2PL, or 3PL). Prior to using the LSDM, it is important to make sure that the data are essentially uni-dimensional and the IRT estimates of item parameters are based on a model with a tenable data fit. In this study, a one-factor model in the framework of confirmatory factor analysis (CFA) was used first to test whether the STEP-RC data are essentially unidimensional; that is, there is one dominant factor that underlies the data on reading comprehension in STEP-RC.
Testing for unidimensionality
The CFA was conducted through the use of the computer program Mplus by Muthén and Muthén in 2010, with the STEP-RC items declared as categorical observed variables. Although the goodnessof- fit indexes indicated a tenable data fit, one item (out of 40) was dropped from the subsequent analyses due to poor fit to the targeted uni-dimensional. The one-factor CFA with the remaining 39 items was found to provide a better data fit. Specifically, the chi-square statistic for model fit was statistically significant, χ2(702)=4071.52, p<0.001, which is not a surprise given the large sample size (N=7,717), so the decision of tenable data fit is based on the other fit indexes reported with Mplus, namely (a) comparative fit index, CFI=0.940, (b) Tucker-Lewis index, TLI=0.937, (c) root mean square error of approximation, RMSE=0.025, with a 90% confidence interval (0.024, 0.026), and (d) weighted root mean square residual, WRMR=2.037. Based on these results, the decision was that the STEP-RC data are sufficiently uni-dimensional to proceed with IRT calibration of the items.
IRT calibration of STEP-RC
According to the psychometric practice adopted by the NCA for STEP-RC data, the 3PL model for IRT calibration is used to consider for guessing that typically occurs with responses on multiple-choice items in large-scale assessments. The calibration was performed using the computer program Xcalibre 4.2 [57]. The estimates of the item parameters under the 3PL (a=discrimination, b=difficulty, c=pseudoguessing) are provided in Table 2. There was no indication of data misfit for individual test items.
| Item | a | b | c |
|---|---|---|---|
| 1 | 1.952 | 0.9833 | 0.1816 |
| 2 | 1.1053 | 0.9631 | 0.1653 |
| 3 | 1.3904 | 1.3208 | 0.2545 |
| 4 | 0.7391 | 1.9367 | 0.2083 |
| 5 | 2.0833 | 1.8627 | 0.1873 |
| 6 | 1.4139 | 1.0107 | 0.2454 |
| 7 | 0.8274 | 0.9913 | 0.2137 |
| 8 | 1.0338 | -0.0068 | 0.2368 |
| 9 | 2.4803 | 0.7939 | 0.1997 |
| 10 | 1.4867 | 1.1705 | 0.2541 |
| 11 | 1.4482 | 1.4176 | 0.2889 |
| 12 | 1.0789 | 0.8062 | 0.269 |
| 13 | 1.6258 | 1.1739 | 0.1723 |
| 14 | 1.5995 | 1.0936 | 0.2054 |
| 15 | 1.1814 | 1.0909 | 0.2623 |
| 16 | 2.0389 | 1.5023 | 0.2466 |
| 17 | 1.3636 | 1.1485 | 0.2059 |
| 18 | 1.8468 | 1.2755 | 0.192 |
| 19 | 1.9461 | 1.4947 | 0.2001 |
| 20 | 1.194 | 0.0889 | 0.2275 |
| 21 | 1.2114 | 0.8925 | 0.2367 |
| 22 | 2.0912 | 0.5961 | 0.2036 |
| 23 | 2.5769 | 1.3014 | 0.186 |
| 24 | 1.4554 | 1.2529 | 0.2423 |
| 25 | 1.4919 | 0.4763 | 0.2482 |
| 26 | 2.6787 | 1.7069 | 0.1796 |
| 27 | 1.5611 | 1.3991 | 0.2312 |
| 28 | 1.4353 | 0.678 | 0.1851 |
| 29 | 0.9127 | 1.3523 | 0.2525 |
| 30 | 0.6886 | -0.3652 | 0.207 |
| 31 | 0.7039 | -0.2494 | 0.2315 |
| 32 | 1.3683 | 0.8953 | 0.2326 |
| 33 | 1.4992 | 0.1025 | 0.2403 |
| 34 | 1.0727 | 0.2591 | 0.2152 |
| 35 | 1.3854 | 1.3802 | 0.2448 |
| 36 | 0.7748 | 0.4304 | 0.184 |
| 37 | 1.0218 | 1.8964 | 0.1949 |
| 38 | 1.5773 | 1.8934 | 0.2231 |
| 39 | 0.8631 | 1.4145 | 0.2132 |
Table 2: IRT estimates of the STEP-RC items under the 3PL model.
LSDM analysis
A key element in all models of cognitive diagnosis is the so-called Q-matrix. When a set of K attributes is hypothesized to underlie the responses on J items, the Q-matrix is a J × K matrix with elements qjk=1 if item j requires attribute k, and qjk=0, otherwise; (j=1, …, J; k=1, …, K). The Q-matrix for the 39 items of the STEP-RC and seven attributes used in this study is provided in Table 3. The LSDM analysis of the STEP-RC items was performed using the IRT item parameter estimates in Table 2 and Q-matrix in Table 3. This was done through the use a computer program for LSDM written in MATLAB (MathWorks Inc.,) [58]. For interested readers, the LSDM function is also available in the module “Cognitive Diagnosis Modeling,” “Least Squares Distance Method of Cognitive Validation (lsdm)” of the software package for statistical computing in R (R development core team) [59]. Provided next are LSDM results that relate to the purpose of this study Table 3.
| Item | A1 | A2 | A3 | A4 | A5 | A6 | A7 |
|---|---|---|---|---|---|---|---|
| 1 | 0 | 0 | 0 | 1 | 0 | 0 | 0 |
| 2 | 0 | 1 | 0 | 1 | 0 | 0 | 0 |
| 3 | 0 | 0 | 0 | 0 | 0 | 0 | 1 |
| 4 | 0 | 0 | 0 | 0 | 0 | 0 | 1 |
| 5 | 0 | 0 | 0 | 0 | 0 | 0 | 1 |
| 6 | 0 | 0 | 0 | 0 | 0 | 1 | 0 |
| 7 | 0 | 0 | 0 | 0 | 0 | 0 | 1 |
| 8 | 1 | 0 | 0 | 0 | 0 | 0 | 0 |
| 9 | 0 | 1 | 0 | 0 | 0 | 0 | 0 |
| 10 | 0 | 0 | 0 | 0 | 0 | 0 | 1 |
| 11 | 0 | 1 | 0 | 0 | 0 | 0 | 0 |
| 12 | 0 | 0 | 0 | 0 | 0 | 0 | 1 |
| 13 | 0 | 0 | 0 | 0 | 0 | 0 | 1 |
| 14 | 0 | 0 | 0 | 0 | 1 | 0 | 0 |
| 15 | 0 | 0 | 1 | 0 | 0 | 0 | 0 |
| 16 | 0 | 0 | 0 | 0 | 1 | 0 | 0 |
| 17 | 0 | 0 | 0 | 0 | 1 | 0 | 0 |
| 18 | 0 | 0 | 0 | 0 | 0 | 0 | 1 |
| 19 | 0 | 0 | 0 | 0 | 0 | 0 | 1 |
| 20 | 0 | 0 | 0 | 0 | 0 | 0 | 1 |
| 21 | 0 | 0 | 0 | 0 | 0 | 0 | 1 |
| 22 | 0 | 0 | 0 | 0 | 0 | 0 | 1 |
| 23 | 0 | 1 | 0 | 0 | 0 | 0 | 0 |
| 24 | 0 | 0 | 0 | 0 | 1 | 0 | 0 |
| 25 | 0 | 0 | 0 | 0 | 0 | 0 | 1 |
| 26 | 0 | 0 | 0 | 0 | 1 | 0 | 0 |
| 27 | 0 | 0 | 0 | 0 | 0 | 0 | 1 |
| 28 | 0 | 0 | 0 | 0 | 0 | 0 | 1 |
| 29 | 0 | 0 | 0 | 0 | 0 | 1 | 0 |
| 30 | 0 | 0 | 0 | 0 | 0 | 0 | 1 |
| 31 | 0 | 0 | 0 | 0 | 0 | 0 | 1 |
| 32 | 0 | 0 | 0 | 0 | 0 | 0 | 1 |
| 33 | 1 | 1 | 0 | 0 | 0 | 0 | 0 |
| 34 | 0 | 0 | 0 | 0 | 0 | 0 | 1 |
| 35 | 0 | 0 | 0 | 0 | 0 | 0 | 1 |
| 36 | 0 | 0 | 0 | 0 | 0 | 0 | 1 |
| 37 | 0 | 0 | 1 | 0 | 0 | 0 | 0 |
| 38 | 0 | 1 | 0 | 0 | 0 | 0 | 0 |
| 39 | 0 | 0 | 0 | 0 | 0 | 1 | 0 |
Table 3: Q-matrix for seven attributes (A1 to A7) and 39 STEP-RC items.
Attribute probability curves
The conditional probabilities of correct performance on each attribute across levels of ability (in reading comprehension) on the IRT logit scale are depicted through the attribute probability curves (APCs) provided in Figure 2. For space consideration, the tabulated estimates of the probabilities for the APCs are not provided here, but some specific values are reported for illustration when necessary.
Several main findings can be outlined from the examination of APCs. First, the APCs monotonically increase with the increase of the ability level on the logit scale, which is an important piece of evidence for the validity of the hypothesized attributes (A1, …, A7) in the framework of the LSDM [17]. Second, attribute A1 (find relevant information) is consistently the easiest attribute across the ability levels on the IRT logit scale, with the chances for correct performance on this attribute being practically 100% for persons with ability above the origin of the scale (θ>0). Next in terms of consistent easiness is A4 (inclusion/exclusion), followed by A7 (understanding). The three most difficult attributes are A3 (writer’s purpose), A5 (reasoning), and A6 (evaluation), with some switches in the order of their relative difficulty across the logit scale. For example, A5 is the most difficult attribute for persons with ability below 1.3 (θ<1.3), whereas A3 is the most difficult attribute for persons above that level on the logit scale. Third, the ability cutting scores on the logit scale at which a person has more than 50% chances to perform correctly a given attribute are (a) θ ≈ -1.5, for A1, (b) θ ≈ 0.4, for A4, (c) θ ≈ 0.7, for A7, (d) θ ≈ 0.9, for A2 and A6, and (e) θ ≈ 1.3, for A3 and A5.
Conditional probability of performing up to a desired number of attributes: The LSDM estimates of the conditional probability that a person with a given ability will perform correctly at least p attributes (p ≤ 7) are depicted in Figure 3. For space consideration, these estimates are not tabulated here, but some of them are provided for illustration. For example, for a person located at the origin of the logit scale (θ=0) the probability to perform correctly at least p (out of 7) attributes is close to (a) 1.00 for p=1, (b) 0.90 for p=2, (c) 0.62 for p=3, (d) 0.29 for p=4, (e) 0.08 for p=5, (f) 0.01 for p=6, and (g) 0.00 for p=7. The cutting score on the logit scale at which the probability of performing correctly at least p attributes (p ≤ 7) is higher than 0.5 (i.e., more than 50% chances) can be very useful in making criterion-based decisions (e.g., in setting performance standards) based on the level of attribute performance. As shown in Figure 3, for abilities within the range of practical interest here (-4 ≤ θ ≤ 4), there are more than 50% chances for correct performance of at least two attributes. For more than two attributes, the cutting θ-scores for higher than 50% chances of correct performance on at least p attributes are (a) θ ≈ -0.5 for p=3, (b) θ ≈ 0.5 for p=4, (c) θ ≈ 1.0 for p=5, (d) θ ≈ 1.5 for p=6, and (e) θ ≈ 2.0 for p=7; (that is, persons with ability of more than two units above the origin of the logit scale have more than 50% chances for correct performance on all seven attributes) Figure 3.

Figure 3: Probability for correct performance of at least 1, 2, 3, 4, 5, 6, or 7 attributes of reading comprehension difficulty for the STEP-RC items.
Examining the validity of STEP-RC attributes: The validity of the STEP-RC attributes used in this study is investigated by the heuristic criteria described earlier. Specifically, the examination of Figure 2 indicates that the APCs exhibit the expected features of (a) monotonic increase with the increase of the level of reading comprehension (on the logit scale), (b) more difficult attributes discriminate better among high-ability examinees, and (c) relatively easy attributes discriminate better at low ability levels.
Q-matrix misspecifications were investigated by examining the Mean Absolute Difference (MAD) between the ICC of each item and its recovery by the product of the attribute probability curves (APCs) for the attributes associated with the respective item in the Q-matrix. The results are provided in Table 4. Using the MAD cutoff values for levels of ICC recovery described earlier, (a) there are two items (11 and 29) with very good recovery, MAD<0.02, (b) 13 items (3, 6, 7, 10, 14, 16, 17, 21, 24, 27, 32, 35, 39) with good recovery, 0.02 ≤ MAD<0.05, (c) seven items (12, 13, 18, 26, 28, 36, 37) with somewhat good recovery, 0.05 ≤ MAD<0.07), (d) six items (2, 15, 19, 22, 25, 34) with somewhat poor recovery, 0.07 ≤ MAD<0.10, (e) and 11 items (1, 4, 5, 8, 9, 20, 23, 30, 31, 33, 38) with poor recovery, 0.10 ≤ MAD<0.15; (there are no items with very poor recovery, MAD ≥ 0.15). For illustration, the ICC recovery of item 23 (poor recovery: MAD=0.102) and item 29 (very good recovery: MAD=0.019) is shown in Figures 4 and 5, respectively.

Figure 4: LSDM recovery for the ICC of item 23 (poor recovery: MAD=0.102).

Figure 5: LSDM recovery for the ICC of item 29 (very good recovery:MAD=0.019).
| Item | MAD | ICC recovery |
|---|---|---|
| 1 | 0.1317 | poor |
| 2 | 0.0824 | somewhat poor |
| 3 | 0.0344 | good |
| 4 | 0.1085 | poor |
| 5 | 0.1353 | poor |
| 6 | 0.0358 | good |
| 7 | 0.0211 | good |
| 8 | 0.1663 | poor |
| 9 | 0.101 | poor |
| 10 | 0.0258 | good |
| 11 | 0.0199 | very good |
| 12 | 0.0531 | somewhat good |
| 13 | 0.0668 | somewhat good |
| 14 | 0.0366 | good |
| 15 | 0.0777 | somewhat poor |
| 16 | 0.0228 | good |
| 17 | 0.0301 | good |
| 18 | 0.0669 | somewhat good |
| 19 | 0.0822 | somewhat poor |
| 20 | 0.1143 | poor |
| 21 | 0.0228 | good |
| 22 | 0.0762 | somewhat poor |
| 23 | 0.1024 | poor |
| 24 | 0.0364 | good |
| 25 | 0.0787 | somewhat poor |
| 26 | 0.0696 | somewhat good |
| 27 | 0.0475 | good |
| 28 | 0.0615 | somewhat good |
| 29 | 0.0192 | very good |
| 30 | 0.1586 | poor |
| 31 | 0.1562 | poor |
| 32 | 0.0266 | good |
| 33 | 0.1662 | poor |
| 34 | 0.0882 | somewhat poor |
| 35 | 0.0412 | good |
| 36 | 0.0609 | somewhat good |
| 37 | 0.0637 | somewhat good |
| 38 | 0.1255 | poor |
| 39 | 0.032 | good |
Table 4: MAD values for LSDM recovery of ICCs of STEP-RC items.
The presence of items with unsatisfactory (somewhat poor or poor) ICC recovery is not a surprise because it is not realistic to expect that the small number of attributes with relatively high level of generality, used in this study, would be sufficient to fully explain the conditional probabilities of correct response for all test items. Nevertheless, the ICC fit and misfit of STEP-RC items provide information in line with the purpose of the present study; (more details on that matter are provided in the discussion part).
The main purpose of this study was to examine some measurement aspects of the validity of cognitive attributes expected to underlie the success on reading comprehension test items in the context of English proficiency assessment. The LSDM approach to cognitive diagnosis modeling [17,18] used to address this purpose can be applied in other contexts of assessment and cognitive analysis. The selection of cognitive attributes in this study was not guided by the intent to offer a comprehensive model of item difficulty in reading comprehension or to replicate such models investigated in previous research [8,44,48]. Instead, these attributes were used because they were targeted with the intended purpose of the reading comprehension part of the STEP-RC developed and administered by the NCA in Riyadh, Saudi Arabia.
Under the NCA practice of psychometric analysis of STEP-RC, the examinees’ abilities are scored on the IRT logit scale (under 3PL calibration of the test items). Therefore, the main goal in this study was to examine the examinees’ performance on the targeted attributes given their ability score on the IRT logit scale under 3PL calibration. In other words, the goal was to translate the IRT relationship between persons’ ability and probability of correct item response into relationship between persons’ ability and probability of correct attribute performance; that is, to integrate information about the item characteristic curves (ICCs) and attribute probability curves (APCs) on the IRT logit scale. In this context, the LSDM was an appropriate choice for analysis of the attributes used in this study.
The results from using LSDM with STEP-RC data can be summarized as follows. First, the APCs of the seven attributes monotonically increase with the increase of ability on the logit scale, thus providing an important piece of evidence for the validity of the seven attributes under their targeted role in the development of STEPRC. Indeed, as these attributes are viewed as latent ability aspects of a general ability measured by STEP-RC, it is logical to expect that the probability of correct performance on each attribute will increase with the increase of that general ability; (i.e., the reading comprehension ability measured by the test). Another aspect of validity support is that more difficult attributes discriminate better among examinees with ability above the average, whereas relatively easy attributes discriminate better among examinees with ability below the average (Figure 2).
Second, the relative difficulty of attributes, as depicted by their APCs, reveals that A1 (ability to find relevant information) is the easiest attributes across all ability levels on the logit scale, followed by A4 (ability for inclusion/exclusion) and A7 (general understanding). The three most difficult attributes are A3 (ability to describe the writer’s purpose), A5 (reasoning), and A6 (evaluation), with some changes in the order of their relative difficulty across the logit scale. For example, the ability to describe the writer’s purpose is the most difficult attribute for high ability examinees (about one unit above the average on the logit scale), whereas reasoning is somewhat more difficult for all other examinees [60-64].
Third, the ability cutting scores on the logit scale at which a person has more than 50% chances to perform correctly a given attribute are (a) θ ≈ -1.5, for A1, (b) θ ≈ 0.4, for A4, (c) θ ≈ 0.7, for A7, (d) θ ≈ 0.9, for A2 and A6, and (e) θ ≈ 1.3, for A3 and A5. Furthermore, for persons with abilities within the range of practical interest here (-4 ≤ θ ≤ 4), there are more than 50% chances for correct performance of at least two attributes. On the other hand, the cutting θ-scores on the logit scale at which a person has more than 50% chances to perform correctly at least 3, 4, 5, 6, or 7 attributes are (a) θ ≈ -0.5 for at least 3, (b) θ ≈ 0.5 for at least 4, (c) θ ≈ 1.0 for at least 5, (d) θ ≈ 1.5 for at least 6, and (e) θ ≈ 2.0 for at least 7 attributes, respectively [65-69].
For the purposes of item development for STEP-RC, the items with good (or somewhat good) ICC recovery can help in the write up of similar items based on the understanding of their underlying attributes specified in the Q-matrix [70,71]. Regarding the items with poor (or somewhat poor) ICC recovery, it is clear that they would require a more operationalized and/or extended set of underlying attributes with proper specification in the resulting Q-matrix.
Limitations and recommendations for future research
The main limitation of this study is the relatively restricted scope of the cognitive model for reading comprehension difficulty as represented by the seven attributes used here. Although the purposeful selection of these attributes and their LSDM analysis is in line with the purpose of the study, the poor ICC recovery for 11 items suggests that a more comprehensive set of attributes is needed to better explain the reading comprehension difficulty of STEP-RC items. Depending on the complexity of the resulting cognitive model, the LSDM can be used for more limited tasks, whereas other CDMs can be used to capture, say, the specificity of thinking when responding to multiplechoice items (e.g., the generalized diagnostic classification models for multiple choice option-based scoring;) [72] or compensatory skills in reading comprehension (e.g., DINO; [16]. Furthermore, future studies may go beyond the pure CDM framework to examine ecological and psychological factors of reading comprehension difficulty in the context of STEP-RC assessment in Saudi Arabia [42,52].
In line with the purpose of this study, the LSDM application for cognitive diagnosis of STEP-RC items provided useful information about the performance of examinees on targeted attributes of reading comprehension. A unique feature of the LSDM is that, along with the Q-matrix, it requires only IRT estimates of item parameters, assuming a tenable fit of the IRT model. This allows for the analysis in this study to be conducted with new test forms using IRT estimates of their items from the item bank for STEP-RC prior to administration of such forms to examinees. The LSDM-based methodology and procedures for analysis and validation of cognitive attributes can be useful to researchers in different areas of assessment and cognition.