Advances in dairy Research
Open Access
ISSN: 2329-888X
ISSN: 2329-888X
Research Article - (2018) Volume 6, Issue 4
This study was conducted in Esera district Dawuro zone Southern Ethiopia with the objectives of assessing small ruminant production system. For the study one hundred thirty eight (HHs) owning small ruminant were selected randomly and semi-structured questionnaire was used to collect data on small ruminants’ production system, management, reproductive performances and availability of feed resources .The available feed resources are (a grass species, crop aftermath and 4 legumes species are the common ones). The average family size was 5.23 ± 0.195 per HH. Crop-livestock farming was the commonly used farming system (100%) with (69.1%) extensive and (30.9%) semi-intensive production system. The mean total land holding was 3.1288 ± 0.19 ha per HH and was significant (P<0.05) varied across agro-ecologies. The average sheep and goat flock size per HH was 6.08 ± 0.183 and 5.69 ± 0.236 respectively and was significantly (p<0.05) varied across agro-ecologies. The purpose of keeping small ruminants in District was for cash income, as an insurance, meat, manure and as means of wealth accumulation with index of 0.32, 0.29, 0.16, 0.13 and 0.08 respectively.
Natural mating is the most widely used in their breeding practice almost (100%) in HL (High land), ML (Mid land), and LL (Low land). Grazing and browsing on natural pasture and leguminous tree species are commonly used in their feeding system. Majority (80.7%) of HHs are keeping small ruminants in their living house. The source of water used for their animals and themselves as well is from river, tap, rain and harvested water depending on the season. Internal and external parasites are the first and second ranking diseases and parasites which affects the small ruminants in the study area. For sheep, estimated average puberty age is (6.6 ± 0.12 months for male and 7.7 ± 0.16 months for female), age for first lambing (12.7 ± 0.16 month) and lambing interval (8.4 ± 0.17 month) were significantly Higher (P<0.05) in the HL than in ML and LL. For Goats, estimated average puberty age is (7.04 ± 0.10 months for male and 7.40 ± 0.10 months for female), first Kidding age is (13.04 ± 0.16 months) and lambing interval (8.5 ± 0.12 months) were significantly Higher (P<0.05) in the HL than in ML and LL agro ecology. The major opportunity of small ruminant production is that they requires short generation interval, high market demand smaller space and capital investment with index of 0.26, 0.24 and 0.23 respectively and the major constraints of small ruminant productions were Disease and parasite, feed shortage, insufficient grazing land were the major complaints told by our respondents.
Keywords: Â Lambing; Kidding; Generation; Agro-ecologiesÂ
Background
Agriculture in Ethiopia is the foundation of the country’s economy, accounting for half of gross domestic product (GDP), 80% of exports and 85% of total employment [1]. Livestock is an important and integral component of agriculture, which is the pillar of the Ethiopia economy and Ethiopia is believed to have the largest livestock population in Africa. Ethiopia’s livestock population, estimated as 59.5 million cattle, 30.70 million sheep, 30.20 million goat, 2.16 million horses, 8.44 million donkeys, 0.41 million mules, 1.21 million camels and 56.53 million heeds of chicken, and are widely distributed across the different agro-ecological zones of the country [2]. Ethiopia is endowed with huge livestock resources, natural resources and diverse agro-ecological zones suitable for livestock production. These potentials make the country prominent repository for animal genetic diversity [3]. Livestock productions plays an important role to smallholder farmers and the national economy of the country in generating income to farmers, creating job opportunities, ensuring food security, providing services, contributing to asset, social, cultural and environmental values, and sustain livelihoods [4,5]. The subsector is mainly of smallholder farming system having multipurpose use and contributes about 16.5% of the national Gross Domestic Product (GDP), 35.6% of the agricultural GDP, 15% of export earnings and 30% of agricultural employment [6,7].
Small ruminants are among the major economically important livestock in Ethiopia, playing an important role in the livelihood of resource-poor farmers and they are integral part of livestock keeping in Sub-Saharan Africa (SSA) that are mainly kept for immediate cash sources, milk, meat, wool, manure, and saving or risk distribution [8-10]. Small ruminants also have various social and cultural functions that vary among different cultures, socio-economies, agro-ecologies, and locations in tropical and sub-tropical Africa [11]. Mixed crop livestock production practice is common production system of Ethiopia across different agro ecological condition which depends on indigenous breed of small ruminant with low level production and productivity. The description of small ruminant production systems in Ethiopia emphasized on the contribution of the indigenous breed of small ruminants to the total household revenue [12,13].
Feeds and water are the major factor that determines the production potential of livestock that is used for the fulfillment of nutritional requirement of animals. Small ruminant feed resources in Ethiopia are mainly grazing on communal natural pasture, crop stubble, fallow grazing, road side grazing, crop residues, browses, and non-conventional feeds (household food leftovers, weeds, crop tillers and fillers), improved forages and crop residues [14,15]. According to Asefa [16] the main feed resource of small ruminant are pasture grass, shrubs, crop residue, house left over and khat left. The contribution of these feed resources, however, depends up on the agro-ecology, the types of crop produced and accessibility and production system [17].
The estimated contribution of small ruminants’ population for economic growth and transformation in Ethiopia accounts for 21% and 16.8% of the total contribution of ruminant livestock meat outputs respectively, which plays a great role as source of foreign currency [18]. The small body size, broad feeding habits, resistance to disease, ability to walk long distance to search feed, highly tolerant to adverse climatic condition with endurance of drought and to low and fluctuating nutrient availability and their short reproductive cycle provide small ruminants with comparative advantage over other species to suit the circumstances of especially resource poor livestock keepers [12,19-21].
Despite the large number of small ruminants and their contributions to the livelihood of the farmers and the national economy small ruminants productivity in Ethiopia is low due to different factors including, Weak attention from scientists, administrators and legislators [22], low genetic potential and policy issues [23], Market and institutional problem and problem of credit facilities [24]; shortage, seasonal unavailability and low nutritive (poor nutrition) value of feed and/or [17,25-27]; prevalence of different diseases and parasites [28] labour shortage, lack adequate veterinary service, water shortage, capital shortage, market problem and capital shortage [17].
Improvements were too slow due to lack of identifying the actual on-farm situations by giving due attention to the socio-economic and social benefits of sheep and goat for smallholder farmers. Small ruminants, kept in the vast geographical locations, diverse socioeconomic and cultural settings and a range of farming practices in the southern nation nationality people regional state (SNNPR) play immense role in the livelihoods of rural farms.
The agro-ecological condition of Dawuro zone in general and Essera district in particular was highly suitable for sheep and goats production. This is because, the area was endowed with various species of vegetation dominated by mixture of perennial and woody plants, trees and shrubs with shifting in composition in response to intensity of grazing and browsing, which can be a good feed sources of small ruminants across different ago ecology.
Though small ruminant production plays an important role to the livelihood of the engaged households in the area through income generation, source of fertilizer and source of meat for home consumption, production system and feed resource for small ruminants are not studied and precisely known and constraint and opportunities of small ruminant are not identified and prioritized in Esera district, Hence ,assessment of production systems and feed resources for small ruminants are necessary in the district in order to plan development and research activities and to achieve improvements in small ruminants’ production and productivity.
Objective
General objective: To assess sheep and goat production.
Specific objective: To assess sheep and goat production system in Essera district of Dawuro zone.
To assess reproductive performance of sheep and goat in study area.
Study population and study design
All households owning small ruminants in Esera districts of Dawuro zone were the study population. The designs involved in study were formal survey, field observation, focus group discussion, key informants discussion and laboratory analysis of collected feed samples.
Sample size determination and sampling techniques
Prior to undertaking any sampling procedure background information on small ruminant population and potential for small ruminant production in Esera district was collected through rapid exploratory field visits together with focus group discussions and available secondary information from published and unpublished sources, so as to device suitable sampling stages for study. Based on the available information, Essera Woreda has a total of 29 kebeles distributed into Dega (high altitude),Woyna-dega (medium altitude) and Kolla (low altitude).The study sitewere selected purposively taking into account the agro-ecological conditions, access to transport, number of small ruminant population and production potential in study site. The sample size of house hold would be determined by using probability proportional size-sampling techniques formula recommended by Cochran [29].
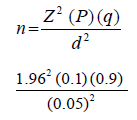
Where n=desired sample size according to Cochran’s when population greater than 10,000 Z=value of selected alpha level (1.96 for 0.25 in each tail at 95% confidence interval).
p=0.1(estimated proportion of an attribute that present population (10%)) q= (1-p=0.9) estimate of variance.
d=acceptable margin of error for proportion being estimated (5%) or degree of accuracy desired..then, 138 respondents was selected randomly for survey.
Study site and house hold selection
The study district was stratified into three agro-ecologies based on altitude (high land, mid land and low land). Two kebele namely Duzi and Arussi Bala kebele from high land,Guza and Senget kebele from mid land and Shota and Hagel-01 kebele from low land were selected purposively based on small ruminant population and production potential of study site depending upon information gained from Esera woreda livestock and fishery development office. House hold was selected randomly based on small ruminant they owned depending upon secondary data from livestock and fishery development office which was supported by the secondary data from kebele administrative office. Based on this background 22, 72 and 44 households were selected randomly from high land, midland and low land respectively based on coverage of agro-ecology in the woreda (Table 1).
| Number | Agro-ecologies | Kebele | Respondents selected | |
|---|---|---|---|---|
| 1 | High land (HL) | Duzi | 11 | 22 |
| Arussi Bala | 11 | |||
| 2 | Midland (ML) | Senget | 36 | 72 |
| Guza | 36 | |||
| 3 | Lowland (LL) | Shota | 22 | 44 |
| Hagel-01 | 22 | |||
| Total | 138 | 138 | ||
Table 1: Sampling frame work of study site and house hold in study area.
Sources and methods of data collection
Both qualitative and quantitative data were collected by employing the following methods.
Formal survey: A formal survey was conducted with the help of the structured questionnaire, with open-ended and closed-ended questions using trained enumerators. A semi structured questionnaire was prepared and pre-tested before administration and some rearrangement, reframing and correcting in accordance with respondents perception were made. The questionnaire was administered to the randomly selected household heads by enumerators recruited and trained for this purpose with close supervision by the researcher. The questionnaire was designed to have information on the socio economic characteristics of households including the sex, marital status, age and occupation of the respondents, small ruminant production systems, production constraints and opportunities, major available feed resources, management practices including; feeding, watering, breeding and health condition and reproductive performance of small ruminants in the study area.
Secondary data collection: Previous studies, guidelines, manuals, policies and regulations, literatures and documented data were reviewed to assess small ruminant production system, production constraints and opportunities and major feed resources. The secondary data pertaining to the investigation were collected from Esera woreda livestock and fishery development office, agricultural office, finance development office, kebele administrative office and various stockholders.
Focus group discussion: Elders, village leaders and individuals who have knowledge about the small ruminant production systems, production opportunities and constraints and identify major small ruminant feed resource in the area were selected by the help of agricultural extension workers as a complementary to survey work. One Group discussions consisting of 10-12 people were made per each identified study site to support questionnaires’ data and the researcher facilitates the discussion at all sites. The main points included in discussion were production practices, feed resources and production constraints and opportunities of small ruminants in study site.
Field observation: During the questionnaire administrations, production practices, major feed resources and any other event pertaining to investigations were observed to strengthen the information obtained by using questionnaire.
Key informants interview: Primary data also were generated by informal interview with local extension agents in addition to direct field observations and one informal discussion per kebele with village elders, and farmers groups. The informal interview were conducted with extension agents intended to gather information about the small ruminants production system, major available feed resources, opportunities and constraints small ruminant production in study site.
Data management and statistical analysis
The computer software Excel was used for data management and entry. The SPPS software, version 20 was used for data analysis, SPSS. The descriptive statistical analysis was employed for data analysis, which refers to the use of figures, percentages, means, standard error and charts in the process of examining and describing small ruminant production practices, production constraints and opportunities, reproductive performance and major available feed resources. The quantitative data means between study sites were compared by means of one way analysis of variance (One-Way ANOVA) in SPSS). The differences between means was declared significant at (P<0.05) ANOVA will be carried out using GLM procedure of SPSS. Mean difference were assessed using Tukeys. Standard error of mean was used while describing mean. Chi-square test was employed to see statistical differences between qualitative variables. Statistical differences between qualitative variables was proclaimed significant at (P<0.05). Priority Index =Sum (n x number of HHs ranked first) + (n-1) x number of HHs ranked second + (n-2) x number of HHs ranked third +...+ 1x number of HHs ranked last) for one factor divided by the sum of (n x number of HHs ranked first+ (n-1) x number of HHs ranked second+.... +1x number of HHs ranked last) for all factors, and where n=number of factors under consideration and HH =Households.
Statistical model for survey
Model statements for sheep and goat study regarding the effect of agro-ecologies on various parameters of sheep and goat production practice
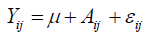
Where
Yij = the value of respective variable or response for a given variable for jth small ruminants in ith agro-ecologies.
μ = overall mean
Ai= fixed effect of agro-ecology (i=3; High land, mid land and lowland) ɛij= residual error.
Socio-economic characteristics of the households
The socio economic characteristics of house hold were summarized in Tables 2 and 3.The proportion of sex of respondents was 72.7% and 27.3%, 69.4% and 20.6%, 90.9 and 9.1% male and female for high land, midland and low land respectively. In the study area, the majority of the small ruminants owning households were male headed (76.8%) while (23.2%) were headed by females. This result revealed that most of small ruminant producers in the area were male headed and there was no variation between agro ecology of the Study district. This finding was in line with [30] Sisay and Kefyalew, in Degahabur zone and the ratio of male to female was lower than the finding of Dhaba, et al. [31] in Illu abba Bora Zone of Oromia regional state.
| Variables | Agro- ecology | |||
|---|---|---|---|---|
| High land | Midland | Lowland | Overall | |
| n=22 | n=72 | n=44 | N=138 | |
| Age of the respondents (M ± SE) | 39 ± 1.382 | 32 ± 0.924 | 41 ± 1.079 | 36 ± 0.717 |
| Family size (M ± SE) | 6.23b ± 0.5 | 4.35a ± 0.29 | 6.18b ± 0.18 | 5.23 ± 0.195 |
| Sex of the respondents (%) | ||||
| Male | 72.7 | 69.4 | 90.9 | 77.7 |
| Female | 27.3 | 30.6 | 9.1 | 22.3 |
| Total | 100 | 100 | 100 | 100 |
| Education status (%) | ||||
| Illiterate | 72.7 | 73.6 | 84.1 | 76.8 |
| Read and write only | 9.1 | 5.6 | 4.5 | 6.4 |
| Primary school | 0 | 1.4 | 0 | 0.47 |
| Junior primary school | 4.5 | 5.6 | 6.8 | 5.6 |
| Secondary school | 9.1 | 9.7 | 2.3 | 7 |
| College and above | 4.5 | 4.2 | 2.3 | 3.7 |
| Total | 100 | 100 | 100 | 100 |
M=mean; SE=standard error; n=number of sample; N= total sample
Table 2: Socio-economic characteristics of respondents.
| Variables | Agro-ecology | ||
|---|---|---|---|
| High land | Midland | Lowland | |
| n=22 | n=72 | n=44 | |
| Marital status (%) | |||
| Single | 9.1 | 13.9 | 4.5 |
| Married | 72.7 | 70.8 | 86.4 |
| Widowed | 9.1 | 9.7 | 4.5 |
| Divorced | 9.1 | 5.6 | 4.5 |
| Total | 100 | 100 | 100 |
| Occupation of the respondents (%) | |||
| Farmer | 81.8 | 81.9 | 93.2 |
| House wife | 4.5 | 4.2 | 2.3 |
| Student | 4.5 | 9.7 | 2.5 |
| Trader | 4.5 | 0 | 0 |
| Government employed | 4.5 | 4.2 | 2.3 |
| Total | 100 | 100 | 100 |
n= sample population; N=total sample
Table 3: Marital status and occupation of respondents.
The overall average family size of the respondents was 5.23 ± 0.195 persons per household which was in line with average family size (5.54 ± 0.16) per household reported by Belete [32] in Goma district of Jimma zone and lower than average family size (11 ± 0.55) per household reported by Sisay and Kefyalew in Degahabur Zone of Eastern Ethiopia. Relatively small family size reported in current study might be due to awareness creation for family planning measures and by changing the local perception of respondents on large family size to make better life of house hold. The average family sizes of respondents were 6.23 ± 0.505, 4.35 ± 0.287 and 6.18 ± 0.182 persons per households in high land, midland and low land respectively. The average family size in midland was significantly lower (p<0.01) (4.35 ± 0.287)than highland (6.23 ± 0.505) and lowland(6.18 ± 0.182) person per household but the average family size per household of highland and midland agro ecology was not statically different in the study area.
The average age of respondents was 39 ± 1.382, 32 ± 0.924 and 41 ± 1.079 years in highland, midland and lowland agro-ecology respectively with overall average ages of the respondents in the study district was 36 ± 0.717 years. On average (72.7%, 73.6% and 84.1%) of the respondents were illiterate, (9.1%, 5.6% and 4.5%) were Read and write only, (0%, 1.4% and 0%) have attended primary school, (4.5%, 5.6% and 6.8%) have attended junior.
Primary school (9.1%, 9.7% and 2.3%) completed secondary school and (4.5%, 4.2% and 2.3%) was higher education for the highland, midland and lowland agro ecology, respectively.
According to the respondents the overall average education status of respondents were 76.8%, 6.4%, 0.47%, 5.6%, 7.0% and 3.7% illiterate, read and write only, primary school, junior primary school, completed secondary school and college and above respectively in study District. This current study revealed that on average majority of small ruminant keepers in study area was illiterate followed respondents who completed secondary school and attended primary school.
Land holding and land use pattern in study area
The average land holding and use pattern were summarized in Table 4. The average land holding per household in study were 3.1625 ± 0.69, 2.2632 ± 0.20 and 4.5284 ± 0.28 hectares in highland, midland and lowland agro-ecology respectively with 3.1288 ± 0.19 ha overall average landholding per household in study woreda. This result revealed that there was significant difference (p<0.01) in landholding between agro-ecologies in study disrict. This result was in line with 3.23 ha reported by Dawit and Ajebu in Adami Tullu, Oromia region, Higher than 2.5 hectare reported by [31] Belay et al in Dandi District of Oromia Region,1.29 ha reported by Beyero et al. in Badawacho district of Hadiya zone, southern Ethiopia, Lower than 3.6 ha reported by [33] Seid and Berhan in Burji district, southern Ethiopia and 3.68 ha reported by sisay and Kefyalew in Degahabur zone of eastern Ethiopia. The average land allocated for crop production, grazing land and fallow land per HH were 1.9371 ± 0.13, 1.0725 ± 0.07 and 0.0986 ± 0.02 respectively.
| Variables | Agro- ecology | ||||
|---|---|---|---|---|---|
| High land | Midland | Lowland | Overall | p-value | |
| n=22 | n=72 | n=44 | N=138 | ||
| Total land holding (ha) | 3.1625b ± 0.69 | 2.2632a ± 0.20 | 4.5284c ± 0.28 | 3.1288 ± 0.19 | 0.001 |
| Crop land (ha) | 1.8784a ± 0.42 | 1.3993a ± 0.13 | 2.846b ± 0.20 | 1.9371 ± 0.13 | 0.001 |
| Grazing land (ha) | 1.1705ab ± 0.29 | 0.7813a ± 0.06 | 1.500b ± 0.10 | 1.0725 ± 0.07 | 0.001 |
| Fallow land (ha) | 0.1136 ± 0.09 | 0.0431 ± 0.02 | 0.1818 ± 0.05 | 0.0986 ± 0.02 | 0.041 |
Means with the same letter within the same row and class are not significantly different at p (0.05)
M=mean; SE=standard error ha=hectare, n=sample population, N=total sample
Table 4: Land holding and land use pattern in Esera woredas (M ± SE)
The average size of total landholding was significantly (p<0.01) different in lowland (4.5284 ± .28 ha), highland (3.1625 ± 0.69 ha) and midland (2.2632 ± 0.20 ha) in study area. Similarly the land size allocated for cropland was significantly higher (p<0.01) in lowland (2.8466 ± 0.20 ha) agro-ecology than that of highland (1.8784 ± 0.42 ha) and midland (1.3993 ± 0.13 ha) agro-ecology but land size allocated for crop in highland and midland was not statically different in study area. The average land size allocated for grazing was higher(P<0.01) in lowland (1.500 ± 0.10 ha) than midland (0.7813 ± 0.06 ha ) but the average land size allocated for grazing in highland was between lowland and midland in study area.
This result shows that the large proportion of land was allocated for crop production followed by pasture for grazing in the study woreda. This implies that large proportion of respondents depends on crop production as a source of food item and source of cash income and livestock production as source of food for Home consumption, Cash income, Manure, Draft power and traction.
Livestock holding and composition in study area
The average livestock holding per household was summarized by Table 5. Farmers of the study area keep a mix of different livestock species namely cattle, sheep, goats, equines and chicken, integrated with crop farming and also engaged in off-farm activities. The average number of cattle herd size per households was 7.9 ± 0.647, 5.95 ± 0.336 and 9.855 ± 0.640 for highland, midland and lowland altitude respectively. The average number of cattle was significantly different (p<0.01) in highland (7.9 ± 0.647), midland (5.95 ± 0.336) and lowland (9.855 ± 0.640) in study area. The average cattle number was higher in lowland than that of highland and midland might be due to relatively high natural grazing land, high requirement for oxen to use for traction power in low land agro ecology. The overall average cattle herd size per households was 7.51 in study woreda. This result was higher than 2.4 reported by Selamawit and Matiwos [34] in Gedio Zone of Southern Ethiopia, 6.5 reported Deriba, G in Alaba Southern Ethiopia,3.3 reported by Abera et al. [35] in Baresa Watershed, Ethiopia and lower than 14.8 reported by Kassahun 2011 in Chilega Woreda, North Gondar.
| Category | Agro ecology | ||||
|---|---|---|---|---|---|
| Highland | Midland | Lowland | Overall | P value | |
| (n=22) | (n=72) | (n=44) | (N=138) | ||
| Cattle | 7.9b ± 0.647 | 5.95a ± 0.336 | 9.855c ± 0.640 | 7.51 ± 0.323 | 0.001 |
| Sheep | 7.27c ± 0.551 | 6.60b ± 0.225 | 4.64a ± 0.216 | 6.08 ± 0.183 | 0.001 |
| Goat | 2.90a ± 0.293 | 4.90b ± 0.257 | 8.38c ± 0.278 | 5.69 ± 0.236 | 0.001 |
| Equine | 1.18 ± 0.204 | 0.71 ± 0.107 | 1.14 ± 0.115 | 0.92 ± 0.076 | 0.014 |
| Chickens | 7.68a ± 1.056 | 8.26a ± 0.38 | 16.95b ± 0.774 | 10.95 ± 0.50 | 0.001 |
Different subscripts indicates significant differences at p<0.05 between means with in rows; M=mean; SE=standard error
Table 5: Mean and stand error of livestock holding and composition in study area.
The average size of sheep and goat flock in study area was 7.27 ± 0.551, 6.60 ± 0.225 and 4.64 ± 0.216 and 2.90 ± 0.293, 4.90 ± 0.257 and 8.38 ± 0.278 in highland, midland and lowland agro ecology respectively. The average size of both sheep and goat was significantly different (p<0.01) in highland (7.27 ± 0.551 and 2.90 ± 0.293), midland (6.60 ± 0.225 and 4.90 ± 0.257) and lowland (4.64 ± 0.216 and 8.38 ± 0.278) respectively in the study area. The overall average flock size of sheep and goat per households was 6.08 ± 0.183 and 5.69 ± 0.236 in the study woreda. This current finding was in line with average sheep flock size 6.10 reported by Deriba in Alaba Southern Ethiopia, higher than 5.33 reported by Selamawit and Matiwos in Gedio Zone of southern Ethiopia, 4.8 reported by Dhaba, et al. in Illu Abba Bora Zone of oromia region and 3.6 reported by Belete [36] in Goma District of Jimma zone (Table 6).
| Variables | Agro-ecology | ||||
|---|---|---|---|---|---|
| High land | Midland | Lowland | Overall | p-value | |
| n=22 | n=72 | n=44 | N=138 | ||
| Cows | 2.95b ± 0.223 | 1.97a ± 0.136 | 2.91b ± 0.205 | 2.43 ± 0.110 | 0.001 |
| Bulls | 1.32b ± 0.179 | 0.47a ± 0.077 | 1.50b ± 0.164 | 0.93 ± 0.082 | 0.001 |
| Heifers | 1.14 ± 0.211 | 0.92 ± 0.177 | 1.36 ± 0.108 | 1.09 ± 0.079 | 0.04 |
| Male calves | 0.45 ± 0.127 | 0.44 ± 0.059 | 0.73 ± 0.105 | 0.54 ± 0.051 | 0.034 |
| Female calves | 0.73 ± 0.188 | 0.53 ± 0.077 | 0.77 ± 0.112 | 0.64 ± 0.062 | 0.172 |
| Oxen draft | 1.00a ± 0.197 | 1.44b ± 0.086 | 1.91c ± 0.078 | 1.52 ± 0.065 | 0.001 |
| Oxen fatten | 0.68b ± 0.096 | 0.32a ± 0.121 | 0.17a ± 0.044 | 0.36 ± 0.047 | 0.001 |
| Mean holding/HH | 7.9b ± 0.647 | 5.95a ± 0.336 | 9.855c ± 0.64 | 7.51 ± 0.323 | 0.001 |
| Stallion | 0.41b ± 0.107 | 0.25b ± 0.051 | 0.00a | 0.20 ± 0.034 | 0.001 |
| Mare | 0.64c ± 0.14 | 0.31b ± 0.067 | 0.00a | 0.26 ± 0.045 | 0.001 |
| Female donkey | 0.00a | 0.00a | 0.36b ± 0.073 | 0.12 ± 0.027 | 0.001 |
| Male donkey | 0.05a ± 0.045 | 0.08a ± 0.033 | 0.77b ± 0.064 | 0.30 ± 0.039 | 0.001 |
| Mules | 0.709 ± 0.063 | 0.06 ± 0.027 | 0 .00 | 0.04 ± 0.017 | 0.182 |
| Mean holding/HH | 1.18 ± 0.204 | 0.71 ± 0.107 | 1.14 ± 0.115 | 0.92 ± 0.076 | 0.014 |
| Chickens | 7.68a ± 1.056 | 8.26a ± 0.38 | 16.95b ± 0.774 | 10.95 ± 0.50 | 0.001 |
Different subscripts indicates significant differences at p<0.05 between means with in rows
SE=standard error; n=sample population; N=total sample
Table 6: Mean and standard error of different cattle herd and Equines category and chickens in study area.
The average goat flock size was higher than 4.5 reported Deriba in Alaba Southern Ethiopia, 3.99 reported by Dhaba, et al in Illu abba bora Zone of oromia region, 3.46 reported by Selamawit and Matiwos in Gedio Zone of southern Ethiopia and 2.1 reported by Belete in Goma District of Jimma zone.
Equines (donkeys, horses and mule) were the most valuable pack animals for transportation of people and other goods in many parts of the study area especially where other means of transportation are limited. Equines were also used for threshing and transporting agricultural inputs and products, drinking water for animals and human beings, wood, crop residues and charcoal which is consistent with the report of Lemma [37]. The average number equine was 1.18 ± 0.204, 0.71 ± 0.107 and 1.14 ± 0.115 in highland, midland and low land agro ecology respectively with overall average number was 0.92 ± 0.076 in study woreda. The average number of equine in midland was significantly (p<0.01) sized (0.71 ± 0.107) lower than highland (1.18 ± 0.204) and low land (1.14 ± 0.115) but the average number of equines in highland and lowland was not statistically different in study woredas (Table 7).
| Sheep and goat flock category | Agro ecology | ||||
|---|---|---|---|---|---|
| Highland | Midland | Lowland | Overall | P value | |
| (n=22) | (n=72) | (n=44) | (N=138) | ||
| Lambs (<3 months) | 0.55 ± 0.225 | 0.39 ± 0.075 | 0.0.43 ± 0.114 | 0.43 ± 0.064 | 0.697 |
| Male lambs (3-6 months) | 1.41b ± 0.225 | 1.14b ± 0.116 | 0.59a ± 0.127 | 1.01 ± 0.084 | 0.001 |
| Female lambs (6-12 month) | 1.09b ± 0.245 | 1.21b ± 0.134 | 0.34a ± 0.092 | 0.91 ± 0.091 | 0.001 |
| Ewes | 3.55b ± 0.252 | 3.08b ± 0.076 | 1.68a ± 0.092 | 2.7 ± 0.089 | 0.001 |
| Rams (intact) (>6months) | 0.50a ± 0.127 | 0.56a ± 0.071 | 1.05b ± 0.092 | 0.70 ± 0.055 | 0.001 |
| Ram Castrates/fattening | 0.18a ± 0.084 | 0.22a ± 0.049 | 0.57b ± 0.076 | 0.33 ± 0.040 | 0.001 |
| Mean holding/HH of sheep | 7.27b ± 0.551 | 6.60b ± 0.225 | 4.64b ± 0.216 | 6.08 ± 0.183 | 0.001 |
| Kids (<3 months) | 0.18a ± 0.084 | 0.19a ± 0.073 | 0.59b ± 0.109 | 0.32 ± 0.055 | 0.003 |
| Male Kids (3-6 months) | 0.50a ± 0.143 | 1.19b ± 0.109 | 1.68b ± 0.139 | 1.24 ± 0.082 | 0.001 |
| Female Kids (6-12 month) | 0.55a ± 0.143 | 0.89a ± 0.102 | 1.95b ± 0.121 | 1.17 ± 0.084 | 0.001 |
| Does | 1.32a ± 0.021 | 2.28b ± 0.101 | 2.98c ± 0.147 | 2.35 ± 0.086 | 0.001 |
| Bucks (intact) (>6months) | 0.36a ± 0.124 | 0.24a ± 0.054 | 0.82b ± 0.059 | 0.44 ± 0.045 | 0.001 |
| Bucks Castrates/fattening | 0.09a ± 0.063 | 0.11a ± 0.037 | 0.41b ± 0.075 | 0.20 ± 0.034 | 0.001 |
| Mean holding/HH of goat | 2.90a ± 0.293 | 4.90b ± 0.257 | 8.38c ± 0.278 | 5.69 ± 0.236 | 0.001 |
Different subscripts indicates significant differences at p<0.05 between means with in rows
SE=standard error, n=sample population N=total sample
Table 7: Mean and stand error different age category of sheep and goat flock in study area.
The average number of chicken was significantly (p<0.01) higher in lowland (16.95 ± 0.774) than highland (7.68 ± 1.056) and midland (8.26 ± 0.38) but the average number of chicken in highland and midland agro ecology was statistically the same and the overall average number of chicken was 10.95±0.50 in the study area.
Small ruminant production system
Purpose of keeping small ruminants in the study area: Purpose of small ruminant keeping/rearing in the study area was shown in Table 8. Farmers in the study area keep small ruminants for meat production for home consumption, source of income, insurance, wealth and source of manure. Respondents revealed that the primary purpose of keeping small ruminant was sources of cash income followed by insurance purpose (sources of cash income without plan or in emergency case) and ranked as cash income 1st, Insurance 2nd, Meat production for home consumption 3rd, Manure 4th and Wealth 5th in study area. This implies that the primary reason for keeping small ruminants to generate cash income for the households through the sale of live animals. Small ruminants are considered as assets that can be converted readily into cash to meet immediate household financial obligations such as to Buy school material for the student, fertilizers, improved breeds of chickens, medicine to total livestock species, and to pay land rent. This current finding was in line with small ruminants are reared in many parts of the country primarily for generating income [38-41].
| Altitude | Purpose | Rank (n) | |||||||
|---|---|---|---|---|---|---|---|---|---|
| 1st | 2nd | 3rd | 4th | 5th | F value sum | Index | Rank | ||
| High land | Meat | 1 | 3 | 17 | 1 | 0 | 70 | 0.22 | 3rd |
| Cash income | 19 | 3 | 0 | 0 | 0 | 107 | 0.34 | 1st | |
| Manure | 0 | 1 | 1 | 17 | 3 | 44 | 0.14 | 4th | |
| Wealth | 0 | 0 | 0 | 1 | 4 | 6 | 0.02 | 5th | |
| Insurance | 3 | 15 | 4 | 0 | 0 | 87 | 0.28 | 2nd | |
| Midland | Meat | 0 | 2 | 52 | 8 | 4 | 132 | 0.14 | 4th |
| Cash income | 62 | 10 | 0 | 0 | 0 | 350 | 0.37 | 1st | |
| Manure | 0 | 0 | 12 | 54 | 0 | 140 | 0.14 | 3rd | |
| Wealth | 0 | 0 | 0 | 4 | 38 | 46 | 0.04 | 5th | |
| Insurance | 10 | 60 | 2 | 0 | 0 | 296 | 0.31 | 2nd | |
| Lowland | Meat | 0 | 2 | 12 | 2 | 28 | 76 | 0.12 | 5th |
| Cash income | 10 | 18 | 6 | 0 | 0 | 140 | 0.23 | 2nd | |
| Manure | 0 | 0 | 0 | 40 | 2 | 82 | 0.14 | 4th | |
| Wealth | 0 | 6 | 24 | 2 | 12 | 112 | 0.19 | 3rd | |
| Insurance | 20 | 22 | 2 | 0 | 0 | 194 | 0.32 | 1st | |
| Overall | Meat | 1 | 7 | 81 | 11 | 32 | 330 | 0.166 | 3rd |
| Cash income | 101 | 31 | 6 | 0 | 0 | 647 | 0.325 | 1st | |
| Manure | 0 | 1 | 13 | 111 | 5 | 270 | 0.136 | 4th | |
| Wealth | 0 | 6 | 24 | 7 | 54 | 164 | 0.083 | 5th | |
| Insurance | 33 | 97 | 8 | 0 | 0 | 577 | 0.29 | 2nd | |
Index=the sum of (5 times First order +4times second order + 3times third order + 2 times fourth order + 1 times fifth order) for individual variables divided by the sum of (5 times First order +4 times second order + 3 times third order + 2 times fourth order + 1 times fifth order) for all variables.
Table 8: Purpose of keeping small ruminants and ranked by the respondents in study area.
Farming system of the respondents: Esera district was known to be a mixed crop-livestock production system dominant farming system. Livestock production is subsistence-oriented and is an important component of the mixed farming system and well integrated with crop production (Table 9). Land use is dominated by mixed smallholder rain fed agriculture producing cereals, pulses and livestock. Crop production and livestock husbandry are commonly integrated in the mixed farming system of the low to highland zones of study area.
| Variables | Agro-ecology | |||
|---|---|---|---|---|
| Production system (%) | High land | Midland | Lowland | Overall |
| n=22 | n=72 | n=44 | N=138 | |
| Mixed crop live stock | 100 | 100 | 100 | 100 |
| Extensive | 36.4 | 70.8 | 100 | 69.1 |
| Semi-intensive | 63.6 | 29.2 | 0 | 30.9 |
| Total | 100 | 100 | 100 | 100 |
Table 9: Production system of small ruminant.
The study area more lands were covered by annual grain or cereal crops mainly wheat, barley, teff, maize and pulse crops like as beans (Phaseolus vulgare), peas (Pisum sativum). Perennial crops like Enset (Ensete Ventricosum) were cultivated vastly in highland and midland and represent the major root and tuber crops of the study area), banana (Musa paradisiaca), coffee (CoffeeArabica), sugar cane (Saccharum officinarum), avocado (Persea americana),mango (Mangifera indica), papaya (pawpaw) (Carica papaya), different agro-forestry tree species and eucalyptus plantations and root crop (potatoes (Solanum tuberosum), In sweet potatoes (Ipomoea batatas), cassava (Manihot cassave), yam (Dioscorea) and taro (Colocasia esculenta)) are also grown in considerable amounts. This was in line with the report of Asrat et al in Boditti, Wolaita zone of southern Ethiopia. Cash crops, which many farmers grow at back yard, are pumpkins (Cucurbita spp.), geeshoo (Rhamnus prinoides) for preparation of local alcoholic drinks, garlic (Allium sativum), onions (Allium cepa), ginger (Zingibere officinale Rosc.) and pepper (Piper nigrum).
Two types of small ruminant production systems namely extensive (69.1%) and semi-intensive (30.9%) were commonly practiced in the study area shown in Table 10. On average 36.4%, 70.8% and 100% and 63.6%, 29.2% and 0% extensive and semi-intensive production system in highland, midland and lowland agro-ecology respectively in the study area. Although, the extensive production system was the most dominant in small ruminant production systems under smallholder farmers, there were a significant number of farmers practicing semiintensive system. Semi-intensive system was mostly practiced in highland and midland agro-ecology of the study district where there was serious land shortage problem and hence lack of browsing and/or grazing areas.
| Altitude | Sources of feed | Rank(n) | |||||||||
|---|---|---|---|---|---|---|---|---|---|---|---|
| 1st | 2nd | 3rd | 4th | 5th | 6th | 7th | F Value sum | Index | Rank | ||
| High land | Natural pasture | 22 | 0 | 0 | 0 | 0 | 0 | 0 | 154 | 0.26 | 1st |
| Crop residue | 0 | 2 | 4 | 6 | 3 | 0 | 0 | 65 | 0.1 | 5th | |
| Crop aftermath | 0 | 12 | 10 | 6 | 0 | 0 | 0 | 146 | 0.24 | 2nd | |
| River and road side grazing | 0 | 7 | 9 | 3 | 1 | 0 | 0 | 102 | 0.17 | 3rd | |
| Atela | 0 | 1 | 0 | 4 | 10 | 0 | 0 | 52 | 0.09 | 6th | |
| Hay | 0 | 0 | 3 | 11 | 5 | 0 | 0 | 74 | 0.12 | 4th | |
| Cultivated forages | 0 | 0 | 0 | 0 | 0 | 2 | 12 | 16 | 0.02 | 7th | |
| Midland | Natural pasture | 72 | 0 | 0 | 0 | 0 | 0 | 0 | 504 | 0.27 | 1st |
| Crop residue | 0 | 0 | 0 | 10 | 20 | 0 | 0 | 100 | 0.05 | 7th | |
| Crop aftermath | 0 | 22 | 44 | 6 | 0 | 0 | 0 | 376 | 0.19 | 3rd | |
| River and road side grazing | 0 | 50 | 18 | 18 | 0 | 4 | 0 | 462 | 0.24 | 2nd | |
| Atela | 0 | 0 | 0 | 16 | 30 | 6 | 0 | 166 | 0.08 | 5th | |
| Hay | 0 | 0 | 6 | 38 | 18 | 4 | 0 | 240 | 0.12 | 4th | |
| Cultivated forages | 0 | 0 | 0 | 0 | 8 | 40 | 6 | 110 | 0.05 | 6th | |
| Lowland | Natural pasture | 44 | 0 | 0 | 0 | 0 | 0 | 0 | 308 | 0.28 | 1st |
| Crop residue | 0 | 0 | 0 | 0 | 0 | 2 | 0 | 8 | 0.008 | 7th | |
| Crop aftermath | 0 | 0 | 42 | 2 | 0 | 0 | 0 | 218 | 0.2 | 3rd | |
| River and road side grazing | 0 | 42 | 2 | 0 | 0 | 0 | 0 | 262 | 0.24 | 2nd | |
| Atela | 0 | 2 | 0 | 34 | 8 | 0 | 0 | 172 | 0.15 | 4th | |
| Hay | 0 | 0 | 0 | 8 | 26 | 4 | 0 | 118 | 0.1 | 5th | |
| Cultivated forages | 0 | 0 | 0 | 0 | 0 | 14 | 0 | 28 | 0.03 | 6th | |
| Overall | Natural pasture | 138 | 0 | 0 | 0 | 0 | 0 | 0 | 966 | 0.26 | 1st |
| Crop residue | 0 | 2 | 4 | 16 | 23 | 2 | 0 | 173 | 0.05 | 6th | |
| Crop aftermath | 0 | 34 | 96 | 14 | 0 | 0 | 0 | 740 | 0.2 | 3rd | |
| River and road side Grazing | 0 | 99 | 0 | 21 | 1 | 4 | 0 | 840 | 0.23 | 2nd | |
| Atela | 0 | 3 | 0 | 54 | 48 | 13 | 0 | 390 | 0.1 | 5th | |
| Hay | 0 | 0 | 9 | 57 | 49 | 8 | 0 | 432 | 0.12 | 4th | |
| Cultivated forages | 0 | 0 | 0 | 0 | 8 | 56 | 18 | 154 | 0.04 | 7th | |
Index=the sum of (7 times First order +6times second order + 5 times third order + 4 times fourth order + 3 times fifth order + 2 times six order + 1 times seventh order) for individual variables divided by the sum of (7times First order +6 times second order + 5 times third order +4 times fourth order + 3 times fifth order+ 2 times six order + 1 times seventh order) for all variables
Table 10: Source of small ruminants feeds and ranked by the respondents.
Sheep and goat husbandry practice
Feeds and feeding practice of small ruminant in study area: The feed resources for small ruminants were natural pasture, crop residue, crop after math, river and road side grazing; local brewery product called Atela, Hay and improved or cultivated forages ranked as 1st , 6th , 3rd , 2nd , 5th ,4th and 7th respectively. 100% of respondents confirmed that the primary and major feed resources of small ruminant was natural pasture either private and communal pasture land followed by river and road side grazing and browsing in study area (Table 11). The finding of the present study was in agreement with previous finding of Adugna, Abera et al. and Samuel who reported that, natural pasture, crop residues, aftermath grazing, hay, agro-industrial by-products, commercial concentrate and non-conventional feeds were the most important feed resources used in different parts of Ethiopia.
| Reason for feed shortage | Agro ecology | ||||
|---|---|---|---|---|---|
| High land | Midland | Low land | Overall | ||
| (n=22) | (n=72) | (n=44) | (N=138) | ||
| Do you have shortage of feed (%) | Yes | 77.3 | 97.3 | 86.4 | 87 |
| No | 22.7 | 2.7 | 13.6 | 13 | |
| Reason for feed shortage (%) Expanding crop cultivation and Increase human population | 0 | 0 | 4.5 | 1.5 | |
| Expanding crop cultivation, increase human and Animal population | 9.1 | 0 | 0 | 3 | |
| Decline in productivity grazing land and shortage of grazing land | 0 | 0 | 4.5 | 1.5 | |
| Expanding crop cultivation, shortage of grazing land , weather condition, increase in animal and human population | 27.3 | 66.7 | 59.1 | 51 | |
| Decline in productivity of grazing land and increase human population | 0 | 0 | 4.5 | 1.5 | |
| Expanding crop cultivation, decline in productivity and shortage of grazing land , climatic condition, increase animal and human population | 40.9 | 30.6 | 13.6 | 28.4 | |
| Total | 77.3 | 97.3 | 86.4 | 87 | |
Table 11: Feed shortage and reason for feed shortage.
According to respondents rank the primary feed resources available to small ruminants in the study district was natural grazing pasture from (communal grazing land, private grazing pasture land and fallow land). According to the respondents, small ruminant production in the study area was heavily dependent on grazing from natural grazing pasture. But these feed resources are generally poor in quality and their productivity and supply is seasonal and low particularly during the critical time of the dry season (Table 12).
| Variables | Agro ecology | |||
|---|---|---|---|---|
| Highland | Midland | Lowland | Overall | |
| (n=22) | (n=72) | (n=44) | (N=138) | |
| Feeding system (%) | ||||
| Tethered grazing and browsing | 72.7 | 94.4 | 27.3 | 64.8 |
| Free grazing and browsing | 27.3 | 5.6 | 72.7 | 35.2 |
| Total | 100 | 100 | 100 | 100 |
| Grazing and browsing system (%) | ||||
| Sheep alone | 9.1 | 2.8 | 4.5 | 5.5 |
| Goat alone | 9.1 | 2.8 | 4.5 | 5.5 |
| Sheep and goat | 22.7 | 15.3 | 54.5 | 30.9 |
| Sheep and goat with other livestock species | 59.1 | 79.2 | 36.5 | 58.1 |
| Total | 100 | 100 | 100 | 100 |
Table 12: Feeding practice of small ruminants.
According to respondents the crop residue was the sixth ranked available feed resources used for small ruminants’ in study area. Crop residues were the main source of feed during the dry season when pastures from grazing area were not able to provide reasonable quantity of feed in the study districts. The major crop residues used as source of small ruminants feed in the study area are teff straw, barley straw, wheat straw, pulse straw, maize stover in highland and midland agro ecology and teff straw and maize stover in lowland agro ecology.
Crop aftermath grazing of cereal crops occurred after harvest from mid-September to December in lowland and from November to January in midland and highland in study area. Aftermath grazing is reserved and grazed privately for some period and then after it became accessible to the community in the locality (Table 13). This is probably to exploit the potential of crop aftermath at individual level since land available for stubble grazing is private resource. Moreover, small ruminants have to be herded closely to protect from crop damage until harvesting of food crops is over in season of the year.
| Variables | Agro ecology | ||||
|---|---|---|---|---|---|
| Highland | Midland | Lowland | Overall | ||
| (n=22) | (n=72) | (n=44) | (N=138) | ||
| Supplementation of feed (%) | |||||
| Do you supplement small ruminants | Yes | 100 | 91.7 | 86.4 | 92.7 |
| No | 0 | 8.3 | 13.6 | 7.3 | |
| Total | 100 | 100 | 100 | 100 | |
| Season of supplementation | |||||
| Dry season only | 31.8 | 22.2 | 9.1 | 21 | |
| Wet season | 0 | 0 | 2.3 | 0.7 | |
| Both dry and wet season | 68.2 | 69.5 | 75 | 71 | |
| Total | 100 | 91.7 | 86.4 | 92.7 | |
| Frequency of supplementation | Once in a day | 45.5 | 55.6 | 86.4 | 62.5 |
| Twice in a day | 54.5 | 36.1 | 0 | 30.2 | |
| Total | 100 | 91.7 | 86.4 | 92.7 | |
| Types of feed supplemented | |||||
| Home refusal, salt/local mineral and maize grain | 0 | 9.7 | 0 | 3.23 | |
| Atela, home refusal, salt/local mineral and maize grain | 31.8 | 13.9 | 8.9 | 18.2 | |
| Atela, home refusal, salt/local mineral, tree legumes and maize grain | 68.2 | 56.9 | 77.5 | 67.53 | |
| Home refusal, salt/local mineral, tree legumes and maize grain | 0 | 11.2 | 0 | 3.74 | |
| Total | 100 | 91.7 | 86.4 | 92.7 | |
n=sample population; N=total sample
Table 13: Supplementation of small ruminant in addition to browsing or grazing in study area.
The main improved forage species widely distributed were Elephant grass, Desho grass, sesbania and leucaena in the study area Elephant grass and Desho grass was the dominant improved forage species cultivated in study woreda (Table 14). However, Growing of improved forage was not a common practice in the study area. According to respondents, this was might be due to lack awareness of farmers on improved forage species, shortage of land for cultivation and lack of improved forge seed supply and adoption of farmers to cultivate improved forages. This result is in line with Samuel in southern Ethiopia and Abate et al who indicated that no special effort is made to grow feed for farm animals in subsistence-oriented smallholder production system in the highlands of Ethiopia.
| Variables | Agro ecology | |||||
|---|---|---|---|---|---|---|
| High land | Mid land | Low land | Overall | |||
| (n=22) | (n=72) | (n=44) | (N=138) | |||
| Common Source of water (%) River, Rain and water harvest | 27.3 | 8.3 | 59.1 | 31.6 | ||
| River, Rain, Tap water and water harvest | 72.7 | 91.7 | 40.9 | 68.4 | ||
| Total | 100 | 100 | 100 | 100 | ||
| During dry season (0%) | River water and water harvest | 27.3 | 8.3 | 59.1 | 31.6 | |
| River , Tap and water harvest | 72.7 | 91.7 | 40.9 | 68.4 | ||
| During wet season (%) | Rain water | 9.1 | 25 | 0 | 11.4 | |
| River and rain water | 27.3 | 36.1 | 63.6 | 42.3 | ||
| Tap and rain water | 40.9 | 22.2 | 36.4 | 33.2 | ||
| River, tap and rain water | 22.7 | 16.7 | 0 | 13.1 | ||
| Total | 100 | 100 | 100 | 100 | ||
| Availability of Water Constraint | Yes | 63.6 | 91.7 | 81.8 | 79 | |
| No | 36.4 | 8.3 | 18.2 | 21 | ||
| Total | 100 | 100 | 100 | 100 | ||
| Means Over coming Water shortage | Going long distance to the river with their livestock and Harvesting water from different sources | 100 | 100 | 100 | 100 | |
| Distance to water sources from home (M ± SE) | 1.321 | 1.62 | 1.376 | 1.439 | ||
| Frequency of watering per day | Dry season | Once in a day | 0 | 2.8 | 5.5 | 2.8 |
| Twice in a day | 100 | 97.2 | 94.5 | 97.2 | ||
| Wet season | Once in a day | 100 | 100 | 100 | 100 | |
Table 14: Common Source and frequency of water, means of alleviating water shortage (%) and distance (M ± SE) to water source.
Feed shortage in the study area
Feed shortage is major limiting factor in small ruminant productivity in study area due to seasonal availability and poor quality of feeds. About 77.3%, 97.3% and 86.4% of the respondents in highland, midland and lowland respectively reported feed shortage problem with overall 87 percentages of respondents suffered feed shortage for their small ruminant. According to key informants discussion and respondents feed shortage problem was found in both dry and wet season and major reason of feed shortage reported was expansion of crop cultivation, shortage and decline in production grazing land,weather condition, increment in number of animal and human population. The month of feed shortage in study area were during dry season (December-January) in this season the main reason of feed shortage is due to weather condition and shortage and lack of rain fall and during wet season( June-August)the main reason was expansion crop cultivation in study area .
All respondents described that the main reason for feed shortage was not only a single reason it might be due to combination of different reason in study area and about 51% reported respondents the main reason of feed shortage were (Expanding crop cultivation, shortage of grazing land, climatic condition, and increase animal and human population), 28.4% (Expanding crop cultivation, shortage of grazing land, decline in productivity of grazing land, climatic condition, increase animal and human population), 3.0% (Expanding crop cultivation, increase human and animal population), 1.5% (Expanding crop cultivation and increase human population), 1.5% (Decline in productivity and shortage of grazing land and 1.5% (Decline in productivity of grazing land and increase human population). This was not only a single reason it might be due to combination of different reason in study area and about 51% reported respondents the main reason of feed shortage were (Expanding crop cultivation, shortage of grazing land, climatic condition, and increase animal and human population), 28.4% (Expanding crop cultivation, shortage of grazing land, decline in productivity of grazing land, climatic condition, increase animal and human population), 3.0% (Expanding crop cultivation, increase human and animal population), 1.5% (Expanding crop cultivation and increase human population), 1.5% (Decline in productivity and shortage of grazing land and 1.5% (Decline in productivity of grazing land and increase human population). This current finding was in line with Tsedeke who reported the major reason of feed shortage for livestock was expansion of crop cultivation followed by declining yield and carrying capacity of the grazing lands in in Alaba southern Ethiopia, Also Dhaba, et al reported the main reason for shortage of feed were Expanding crop cultivation, shortage of grazing land, decline in productivity of grazing land, increase animal and human population in Ilu Abba Bora Zone of Oromia Regional State, Ethiopia, Belete., who reported the main reason of feed shortage was intensity of annual and perennial crop cultivation and shrinkage of grazing land in Goma district of Jimma Zone, South western Ethiopia.
Feeding practice of small ruminant in study area: According to respondent feeding system of small ruminant were 72.7%, 94.4% and 27.3% and 27.3%, 5.6% and 72.7% tethered grazing and browsing and free grazing and browsing in highland, midland and low land respectively. In highland and midland agro ecology tethered feeding system was common and dominant one this might be due to shortage of private grazing land, unavailability of communal grazing and protection of crop damage by small ruminants and the free grazing and browsing tendency was high in low land agro ecology which might be due to the presence high amount of natural private and communal grazing land which consists of enough amount grazing and browsing grass, shrubs, legumes and plant species. This result was in line with Endeshaw, Tsedeke, Getahun, Belete and Tesfaye [14,25,26,39,32]. From the interviewed households 5.5% of them herd sheep alone, 5.5% goat alone, 30.9% sheep and goats together and 58.1% keep small ruminants with livestock while grazing and browsing. According to group discussion with participants, majority of farmers prefer feeding small ruminant with other livestock due to shortage grazing land and presence a single private grazing land in the study district.
Feed supplementation of small ruminants: Natural pasture and crop residues do not fulfill the nutritional requirements of animals particularly in the dry season due to poor management and poor quality [42]. Thus, provision of supplementary feeds to increase the productivity of livestock is essential.
According to the respondents about 92.7% of farmer’s practice supplementing feeds for small ruminant’s animal in the study area. About 21% of the respondents supplement their small ruminant during dry season only, 0.7% supplement during wet season only and 71% supplement in both dry and wet season of the year in study area. This finding was in line with Getahun in highland Ethiopia and Belete in Goma district of Jimma zone, Western Ethiopia. According to respondent’s proportion of households who supplement their small ruminants once a day and twice in a day are 62.5% and 30.2% respectively.
According to the respondents the major feed source used for supplementation of small ruminant was Atela, home refusal, salt/ local mineral, tree legumes and maize grain after and before grazing or browsing in study area. About 67.53.2% of respondent supplement Atela, home refusal, salt/local mineral, tree legumes and maize grain, 18.2% supplement Atela, home refusal, salt/local mineral and maize grain, 3.74% supplement Home refusal, salt/local mineral, tree legumes and maize grain and 3.23% supplement Home refusal, salt/local mineral and maize grain in study area.
Water source for sheep and goat
Water is very crucial nutrient required by livestock large amount to transport nutrient around the body, regulation of body temperature, formation and maintenance of body tissue. The major source of water in the study area was river water, tape water, water harvest and rain fall water. According to respondents the major sources of water during dry season was river water and water harvest (31.6%) and river water, tap water and water harvest (68.4%) and during wet season was rain water (11.4%), rain and river water (42.3%) ,tap and rain water (33.2%) and river, tap and rain water (13.1%) across all study area. One hundred percent of the respondents in study area water their small ruminant both in dry and wet season of the year either by harvesting water from different water source or going long distance to the river with their livestock. On average 1.439 ± .09 km distance from homestead to the water source was reported in study area. There was no significant difference (P>0.05) between the three agro ecology in distance of watering points from home-stead. About 79% of respondent reported there was shortage of water for small ruminant in dry season in study woreda and they use means of alleviating water shortage by harvesting water from river to homestead by using draft animal and family labour and going long distance to the river with their livestock to water their livestock in general and small ruminants in particular. This current finding was in line with Abule., pastoralist area reported water is main limiting factor in livestock production,
According to respondent’s proportion of households that water their small ruminants once a day and twice in a day are 2.8% and 97.2% in dry season and 100% and 0% in wet season respectively in study woreda. Higher watering frequencies were used to water small ruminants in the study area. Watering frequencies were higher in dry season which is related with less moisture content of the feed during dry season. This study was higher than Belete who reported the watering frequency during wet season 46.7% watered freely and 29.7% and in dry season 29.7% and 26.9% of small ruminants watered freely, once in two days, once in two days and once in three days respectively.
Small ruminant housing system
Housing of small ruminant was summarized in Table 15. One hundred percent of respondents were experienced on sheep and goat housing system in study area. About 80.7% of respondents confine their flocks in the main houses together with the family members with other livestock (57.2% of the respondents confine small ruminants in the main house with separate barn which is attached to main house and 23.5% of the respondents confine in the main house with same barn with other livestock) and 19.3% of the respondents confine sheep and goat in separate house alone .100% of the respondents confirmed that the main reason for housing small ruminant was provide night shelter, protect from cold weather, hot weather, predator and theft in study area. Lambs and kids are kept around the homestead until two three weeks to avoid walking long distances in search of feed and water and to minimize exposure to predators. One hundred percent of the respondents have experience on cleaning small ruminant house. The frequency of cleaning house was 82.3% of the respondents once in day while 17.7% of respondents twice in a day in study area.
| Variables | Agro ecology | |||||
|---|---|---|---|---|---|---|
| Experience of housing | Highland | Midland | Lowland | Overall | ||
| (n=22) | (n=72) | (n=44) | (N=138) | |||
| Yes | 100 | 100 | 100 | 100 | ||
| No | 0 | 0 | 0 | 0 | ||
| total | 100 | 100 | 100 | 100 | ||
| Do you have separate House | Yes | 27.3 | 30.6 | 0 | 19.3 | |
| No | 72.7 | 69.4 | 100 | 80.7 | ||
| total | 100 | 100 | 100 | 100 | ||
| Reason of housing small ruminants (%) | ||||||
| Provide night shelter | 100 | 100 | 100 | 100 | ||
| Protect from cold weather | 100 | 100 | 100 | 100 | ||
| Protect from hot weather | 100 | 100 | 100 | 100 | ||
| Prevent from predator | 100 | 100 | 100 | 100 | ||
| Prevent from predator | 100 | 100 | 100 | 100 | ||
| Total | 100 | 100 | 100 | 100 | ||
| Types of house (%) | ||||||
| Family house with separate barn | 54.5 | 30.9 | 86.4 | 57.2 | ||
| Family house with the same barn | 18.2 | 38.9 | 13.6 | 23.5 | ||
| Separate house | 27.3 | 30.6 | 0 | 19.3 | ||
| Total | 100 | 100 | 100 | 100 | ||
| Experience of cleaning house | Yes | 100 | 100 | 100 | 100 | |
| No | 0 | 0 | 0 | 0 | ||
| Total | 100 | 100 | 100 | 100 | ||
| Cleaning frequency per lay | Once | 79.8 | 80.6 | 86.4 | 82.3 | |
| twice | 20.2 | 19.4 | 13.6 | 17.7 | ||
| total | 100 | 100 | 100 | 100 | ||
Table 15: Housing, reason of housing, cleaning and cleaning frequency of house of small ruminant in study woreda
Breeding and selection small ruminant for breeding and production
Breeds and breeding system of sheep and goat in study area: One hundred percent of the respondents owned local breeds of small ruminants in study area. Similarly 100% of the respondents in study area practiced natural breeding system with no significant difference between three agro ecology of the study area. Nighty eight point five percent respondents of small ruminant owners practiced selection criteria of rams or bucks for breeding who mate their small ruminants by selecting superior rams and bucks mate their ewe and doe and one point five percent of small ruminant owners was not practiced selection of rams or bucks for breeding, they simply use uncontrolled mating system in communal or private grazing land during the time when females and males are allowed to run together with free movement on pasture (Table 16).
| Parameters | Agro ecology | ||||
|---|---|---|---|---|---|
| High land | Midland | Lowland | Overall | ||
| (n=22) | (n=72) | (n=44) | (N=138) | ||
| Breeding system (%) | |||||
| Natural breeding | 100 | 100 | 100 | 100 | |
| Breeding mechanism (%) | |||||
| Select best type of ram or bucks and mate their sheep and goat | 100 | 100 | 95.5 | 98.5 | |
| No selection activity for mating | 0 | 0 | 4.5 | 1.5 | |
| Experience of selection (%) | yes | 100 | 100 | 100 | 100 |
| No | 0 | 0 | 0 | 0 | |
| Parameters of selection of sheep and goat For breeding and production purpose (%) | |||||
| Coat color and Body conformation | 0 | 0 | 18.2 | 6 | |
| Behavior and Body conformation | 0 | 0 | 4.5 | 1.5 | |
| Coat color, Body conformation and meat production potential | 4.5 | 13.9 | 40.9 | 19.8 | |
| Coat color, Behavior, Body conformation and Meat production potential | 95.5 | 86.1 | 36.4 | 72.7 | |
Table 16: Breeding system and selection criteria for sheep and goat production in study area.
One hundred percent of the respondents in study area practice selection of sheep and Goat for production based on Coat color and Body conformation (6.0%), Behavior and Body conformation (1.5%), Coat color, Body conformation and meat production potential(19.8%) and Coat color, Behavior, Body conformation and Meat production potential (72.7%). Majority of respondents were select small ruminants for production based on Coat color, Behavior, Body conformation and Meat production potential and small amount of respondents select based on behavior and body conformation only in study area.
Weaning, castration and culling of sheep and goat
Weaning and castration of small ruminants in study area: Weaning and Castration practice in Esera district shown in Table 17. About 88% of respondents practiced weaning of lambs or kids while 12% of respondents were not practiced weaning of lambs and kids in study area. The overall average age of weaning of lambs and kids was 3.55 ± 0.088 months in study area. The average age of weaning of lams and kids in midland was significantly (P<0.01) lower aged (2.72 ± 0.18 months) than highland (3.68 ± 0.351) and lowland (3.55 ± 0.088) but the average age of weaning lambs and kids in highland and low land was statistically not different in study area.
| Variables | Agro ecology | ||||
|---|---|---|---|---|---|
| Highland | Midland | Lowland | Overall | p- value | |
| (n=22) | (n=72) | (n=44) | (N=138) | ||
| Do you practice weaning of lambs or Kids | |||||
| Yes | 86.4 | 77.8 | 100 | 88 | |
| No | 13.6 | 22.2 | 0 | 12 | |
| Average age of weaning in Months (M+SE) | |||||
| Lamb | 3.68 ± 0.351 | 2.72 ± 0.18 | 3.55 ± 0.088 | 3.15 ± 0.119 | 0.001 |
| Kid | 3.68 ± 0.351 | 2.72 ± 0.18 | 3.55 ± 0.088 | 3.15 ± 0.119 | 0.001 |
| Do you practice castration of RamsOr Bucks (%) | |||||
| yes | 100 | 100 | 100 | 100 | |
| Method of castration (%) | |||||
| Local method | 13.6 | 12.5 | 15.9 | 14 | |
| Burdizo | 59.1 | 54.2 | 40.9 | 51.4 | |
| Local method and burizo | 27.3 | 33.3 | 43.5 | 34.6 | |
| Total | 100 | 100 | 100 | 100 | |
| Average age of castration in months (M+SE) | |||||
| Ram | 8.04b ± 0.258 | 7.08a ± 0.10 | 7.0a ± 0.134 | 7.21 ± 0.084 | 0.001 |
| Buck | 8.18b ± 0.233 | 7.08a ± 0.10 | 7.0a ± 0.134 | 7.23 ± 0.084 | 0.001 |
| Reason of castration (%) | |||||
| For fattening purpose | 40.9 | 25 | 4.5 | 23.5 | |
| For fattening and avoid mating of their flock | 59.1 | 75 | 95.5 | 76.5 | |
| Selection criteria for castration and fattening | |||||
| Body conformation, physical characteristics and age | 100 | 97.2 | 100 | 99.06 | |
| Body conformation, Physical characteristics, Breed and age | 0 | 2.8 | 0 | 0.94 | |
| Total | 100 | 100 | 100 | 100 | |
Table 17: Castration and weaning practice of small ruminants in study area.
According to focus group discussion and respondents the main reasons for castration of Rams and bucks were to fatten and to avoid mating of the same flock. About 40.9%, 25% and 4.5% of households from highland, mid land and lowland areas castrated their animals before market in order to fetch higher prices after fattening respectively and about 59.1%, 75% and 95.5% of households from highland, mid land and lowland areas castrated their rams and Bucks before marketing in order to fetch higher prices after fattening and to avoid mating of the same flock respectively in study district. About 51.4% of the respondent perform castration in veterinary clinics by using Burdizo, 14% perform castration only by local methods by using stone and stick while 34.6% of the respondent use both local method and Burdizo for castration of their ram or buck in study district. In this finding the usage of burdizo was lower and the usage of local method was higher than Dhaba [31] who reported 91.1% and 8.9% of respondent performed castration at veterinary clinics by using burdizo and local method respectively in Illu Abba Bora Zone of Oromia region.
During selecting rams or bucks for castration 100%, 97.2% and 100% of respondents in high land, midland and lowland agro ecology respectively consider body conformation, physical characteristics and age and only 2.8% of respondents in midland agro ecology consider body conformation, physical characteristics, breed (local eco type) and age of the rams and bucks in study area. This finding was in line with Takele et al and Belete in Goma district of Jimma zone, western Ethiopia Selamawit and Matiwos [34] in Gedio Zone, southern Ethiopia.
The overall average age of castration of rams and bucks were 7.2101 ± 0.084 months and 7.2319 ± 0.084 months respectively. The average age of castration of ram and bucks was significantly higher (p<0.01) in highland aged (8.0455 ± 0.258 and 8.1818 ± 0.233) months than midland (7.0833 ± 0.10 and 7.0833 ± 0.10) and lowland (7.0 ± 0.134 and 7.0 ± 0.134) months respectively, But the average age of castration of both Rams and bucks in midland and lowland agro ecology were statistically similar in study area. This finding was lower than Tsedeke who reported the average age of castration for ram and bucks were 1.1 year and 1.6 year respectively in Alaba Southern Ethiopia, Belete who reported the average age castration was 12.2 ± 0.3 for ram and 12.8 ± 0.4 for bucks in Goma district of Jimma zone, western Ethiopia and Dhaba, et al. who reported the average castration age of both ram and bucks were 13% of respondent (6-12 months), 69% of respondent (12- 18 months) and 18 of respondent (>24 months) in in Illu Abba Bora Zone of Oromia region.
Selection of rams or bucks for castration and fattening were shown in Table 18. Majority of respondents select rams and bucks for castration and fattening based on combination of conformation, physical characteristic, breed and age of rams and bucks in study district. The primary criteria used for selection of rams and bucks for castration and fattening were body conformation followed age which determine market demand and tenderness of meat respectively in study district.
| Altitude | Criteria of selection | Rank(n) | ||||||
|---|---|---|---|---|---|---|---|---|
| 1st | 2nd | 3rd | 4th | F value sum | Index | rank | ||
| High land | Conformation | 11 | 7 | 3 | 1 | 72 | 0.32 | 1st |
| Breed | 0 | 6 | 11 | 4 | 44 | 0.2 | 3rd | |
| Physical characteristics | 0 | 4 | 5 | 15 | 37 | 0.17 | 4th | |
| Age | 11 | 5 | 4 | 2 | 69 | 0.31 | 2nd | |
| Midland | Conformation | 32 | 24 | 14 | 2 | 230 | 0.31 | 2nd |
| Breed | 2 | 22 | 27 | 18 | 146 | 0.2 | 3rd | |
| Physical characteristics | 2 | 14 | 14 | 42 | 120 | 0.17 | 4th | |
| Age | 40 | 16 | 6 | 8 | 232 | 0.32 | 1st | |
| Lowland | Conformation | 34 | 6 | 4 | 0 | 162 | 0.37 | 1st |
| Breed | 0 | 20 | 4 | 20 | 88 | 0.2 | 3rd | |
| Physical characteristics | 2 | 6 | 16 | 18 | 76 | 0.17 | 4th | |
| Age | 8 | 12 | 20 | 4 | 112 | 0.26 | 2nd | |
| Overall | Conformation | 77 | 37 | 21 | 3 | 464 | 0.33 | 1st |
| Breed | 2 | 48 | 42 | 42 | 278 | 0.2 | 3rd | |
| Physical characteristics | 4 | 24 | 35 | 75 | 233 | 0.17 | 4th | |
| Age | 59 | 33 | 30 | 14 | 413 | 0.3 | 2nd | |
Index=the sum of (4 times First order +3times second order + 2 times fourth order + 1 times fifth order) for individual variables divided by the sum of (4 times First order +3 times second order + 2 times third order + 1 times fourth order + 1) for all variables.
Table 18: Selection of rams and bucks for castration and fattening ranked by respondents in study area.
Culling of small ruminant for production: Culling was used to improve the overall productivity of the flock and also reasons for culling could be different for different systems and agro-ecologies. The main reason of culling small ruminant was age followed by low production potential, age followed by sickness and sickness followed by age in highland, midland and low land agro ecology of study area respectively (Table 19). In overall the primary reason of culling small ruminant from the flock was due to age followed by sickness in the study area. Animals already finished the productive age and have no value by staying in the flock. This current finding was in line with Belete who reported the main reason culling small ruminant from flock were due to old agein Bale zone of Oromia regional state.
| Altitude | Reason of culling | Rank(n) | ||||||||
|---|---|---|---|---|---|---|---|---|---|---|
| Rank(n) | 1st | 2nd | 3rd | 4th | 5th | 6th | F value sum | Index | rank | |
| High land | Age | 11 | 10 | 1 | 0 | 0 | 0 | 120 | 0.26 | 1st |
| Sickness | 2 | 2 | 17 | 1 | 0 | 0 | 98 | 0.21 | 3rd | |
| Lambing and kidding problem | 1 | 2 | 1 | 15 | 2 | 1 | 74 | 0.16 | 4th | |
| Physical defects | 0 | 0 | 0 | 1 | 4 | 17 | 28 | 0.06 | 6th | |
| Unwanted physical characteristics | 0 | 0 | 0 | 3 | 16 | 3 | 38 | 0.08 | 5th | |
| Low production | 8 | 8 | 3 | 1 | 0 | 2 | 105 | 0.23 | 2nd | |
| Midland | Age | 38 | 30 | 4 | 0 | 0 | 0 | 394 | 0.27 | 1st |
| Sickness | 22 | 10 | 28 | 12 | 0 | 0 | 330 | 0.22 | 2nd | |
| Lambing and kidding problem | 0 | 10 | 20 | 42 | 0 | 0 | 214 | 0.15 | 4th | |
| Physical defects | 0 | 0 | 0 | 2 | 10 | 56 | 82 | 0.05 | 6th | |
| Unwanted physical characteristics | 0 | 0 | 0 | 6 | 52 | 10 | 132 | 0.09 | 5th | |
| Low production | 12 | 24 | 20 | 12 | 4 | 0 | 316 | 0.22 | 3rd | |
| Lowland | Age | 14 | 12 | 2 | 14 | 2 | 0 | 198 | 0.21 | 2nd |
| Sickness | 22 | 10 | 8 | 2 | 2 | 0 | 224 | 0.24 | 1st | |
| Lambing and kidding problem | 4 | 16 | 10 | 14 | 0 | 0 | 186 | 0.2 | 3rd | |
| Physical defects | 2 | 0 | 14 | 2 | 2 | 24 | 102 | 0.11 | 5th | |
| Unwanted physical characteristics | 0 | 2 | 2 | 26 | 12 | 2 | 122 | 0.13 | 4th | |
| Low production | 2 | 4 | 8 | 0 | 14 | 16 | 100 | 0.11 | 6th | |
| Overall | Age | 63 | 52 | 7 | 14 | 2 | 0 | 712 | 0.25 | 1st |
| Sickness | 46 | 22 | 53 | 14 | 2 | 0 | 652 | 0.23 | 2nd | |
| Lambing and kidding problem | 5 | 28 | 31 | 71 | 2 | 1 | 474 | 0.17 | 4th | |
| Physical defects | 2 | 0 | 14 | 5 | 16 | 97 | 212 | 0.07 | 6th | |
| Unwanted physical characteristics | 0 | 2 | 2 | 35 | 80 | 15 | 292 | 0.1 | 5th | |
| Low production | 22 | 31 | 31 | 13 | 18 | 28 | 521 | 0.18 | 3rd | |
Index=the sum of (6 times First order +5 times second order + 4 times third order + 3 times fourth order + 2 times fifth order+ 1 times sixth order) for individual variables divided by the sum of (6 times First order +5 times second order + 4 times third order + 3 times fourth order + 2 times fifth order+ 1 times sixth order) for all variables.
Table 19: Culling of small ruminants for production and ranked by respondents.
Reproductive performance of small ruminants in study area
The reproductive performances of sheep and goat were shown Tables 20 and 21 respectively. The overall average marketing age of male and female lambs and kids was 4.125 ± 0.06, 4.228 ± 0.81 months and 4.28 ± 0.08, 4.326 ± 0.07 months respectively. The average marketing age of male and female lams and kids was significantly different (p<0.01) highland (5.0 ± 0.17, 5.636 ± 0.21, 5.136 ± 0.16 and 5.591 ± 0.16), midland (4.306 ± 0.05, 4.389 ± 0.05, 4.389 ± 0.49 and 4.444 ± 0.05 months) and lowland (3.455 ± 0.08, 3.455 ± 0.08, 3.5 ± 0.66 and 3.5 ± 0.10 months) respectively in study district.
| Variables | Agro ecology | |||||
|---|---|---|---|---|---|---|
| Highland | Midland | Lowland | Overall | P value | ||
| (n=22) | (n=72) | (n=44) | (N=138) | |||
| AFL | 12.727b ± 0.16 | 12.319a ± 0.07 | 12.091a ± 0.04 | 12.312 ± 0.05 | 0.001 | |
| LI | 8.455c ± 0.17 | 7.722b ± 0.05 | 7.318a ± 0.07 | 7.710 ± 0.05 | 0.001 | |
| MA | Male | 5.0c ± 0.17 | 4.306b ± 0.05 | 3.455a ± 0.08 | 4.125 ± 0.06 | 0.001 |
| Female | 5.636c ± 0.21 | 4.389b ± 0.05 | 3.455a ± 0.08 | 4.28 ± 0.0811 | 0.001 | |
| AAP | Male | 6.682b ± 0.12 | 6.792b ± 0.06 | 6.409a ± 0.07 | 6.652 ± 0.04 | 0.001 |
| Female | 7.727b ± 0.16 | 7.278a ± 0.06 | 7.091a ± 0.04 | 7.290 ± 0.04 | 0.001 | |
| ALS | 1.55a ± 0.109 | 1.51a ± 0.503 | 1.89a ± 0.048 | 1.64 ± 0.041 | 0.001 | |
AFL=Age at first lambing; LI=lambing interval; MA=Marketing age; AAP=Ageat puberty; ALS=Average litter size
Table 20: Reproductive performance of sheep in study woreda.
| Variables | Agro ecology | |||||
|---|---|---|---|---|---|---|
| Highland | Midland | Lowland | Overall | P Value | ||
| (n=22) | (n=72) | (n=44) | (N=138) | |||
| AFK | 13.045b ± 0.16 | 12.958b ± 0.06 | 12.364a ± 0.07 | 12.783 ± 0.05 | 0.001 | |
| KI | 8.5b ± 0.127 | 8.236a ± 0.05 | 8.045a ± 0.318 | 8.217 ± 0.036 | ||
| MA | Male | 5.136c ± 0.16 | 4.389b ± 0.49 | 3.5a ± 0.66 | 4.228 ± 0.81 | 0.001 |
| AAP | Female | 5.591c ± 0.16 | 4.444b ± 0.05 | 3.5a ± 0.10 | 4.326 ± 0.07 | 0.001 |
| Male | 7.045c ± 0.10 | 6.722b ± 0.06 | 6.295a ± 0.06 | 6.638 ± 0.04 | 0.001 | |
| Female | 7.409c ± 0.10 | 6.986b ± 0.06 | 6.50a ± 0.07 | 6.899 ± 0.05 | 0.001 | |
| ALS | 1.55a ± 0.10 | 1.51b ± 0.059 | 1.82b ± 0.05 | 1.62 ± 0.042 | 0.001 | |
AFK=Age at first kidding, KI=kidding interval, MA=Marketing age, AAP=Age at puberty, ALS=Average litter size
Table 21: Reproductive performance of goat in study woreda.
The overall average age at puberty for male and female sheep and goat was 6.652 months, 7.290 months, 6.638 months and 6.899 months respectively in study area. This current finding was in line with the finding of Tsedeke who reported the average at puberty of sheep (6.7 months for male and 6.9 months for female) and 7 month for female goat and 6.6 month for male goat in Alaba Southern Ethiopia, lower than Markos who reported 300 days for male sheep and 12 months male goat in in Awassa zuria woreda and higher than [43] Combellas who reported 231 days for female tropical sheep breeds and Payne and Wilson reported tropical male goats reach sexual maturity at 132 days.
The average age at puberty of male lambs in lowland was significantly lower (p<0.01) aged (6.409 ± 0.07) than highland (6.682 ± 0.12) and midland (6.792 ± 0.06) months but the average age at puberty of male lambs in highland and midland agro ecology was not statically different. The average age at puberty of female lambs in highland was significantly higher (p<0.01) aged (7.727 ± 0.16 month) than midland (7.278 ± 0.06 months) and lowland (7.091 ± 0.04 months) but the average age at puberty of female lambs in midland and lowland agro ecology was statically the same. The average age at puberty of male and female goat was significantly different (p<0.01) in high land (5.136 ± 0.1 and 5.591 ± 0.16 months), midland (4.389 ± 0.49 and 4.444 ± 0.05 months) and lowland (3.5 ± 0.66 and 3.5 ± 0.66 months) respectively in study area.
The overall average age at first lambing for Ewe and kidding Doe was 12.312 ± 0.05 months and 12.783 ± 0.05 months respectively. This c finding in line with Tsedeke who reported 12.7 months for lambing and 12.1 months for kidding in Alaba Southern Ethiopia, Belete who reported 12.5 ± 0.3 for kidding in Goma district of Jimma zone, Lower than [44] FAO reported age at first lambing ranges between 16.2 and 16.9 months and that of at first kidding from 13.5 to 17.5 months in mixed farming systems of sub-Sahara African countries, Also Mamabolo and Webb reported average age at first kidding 16 months, Selamawit and Matiwos who reported average age at first lambing of 13 month and kidding of 12.9 month in Gedio zone Southern Ethiopa, Lower than age at first lambing (8.4 months) of Menz sheep in Ethiopian highlands [46] and higher than an average age at first parturition of 13 ± 0.3 months for sheep reported by Belete in Goma district of Jimma zone.
The average age at first Lambing of sheep and kidding of goat in highland was significantly higher (p<0.01) aged (12.727 ± 0.16 and 13.045 ± 0.16) than midland (12.319 ± 0.07 and 12.958 ± 0.06) and lowland (12.091 ± 0.04 and 12.364 ± 0.07) months but the average age at first lambing of sheep and kidding of goat in midland and lowland agro ecology was not statically different respectively.
The overall average lambing interval of Ewe and kidding interval of Doe was 7.710 ± 0.05 and 8.217 ± 0.036 months, respectively. This finding was in line with Tsedeke who reported 7.8 month for ewes in Alaba Southern Ethiopia, Belete who reported the average lambing and kidding interval 8.04 months and 7.84 months for sheep and goat respectively in Goma district of Jimma zone of Oromia region, Belete who reported average kidding interval 8.0 ± 0.12 months for goat in Bale zone Oromia Ethiopia, Selamawit and Matiwos who reported the average lambing and kidding interval 8.01 ± 0.22 month for sheep and 8.3 ± 1.6 months for goat in Gedio Zone of Southern Ethiopia, Lower than Deiribe [47] who reported the average lambing and kidding interval of 9.19 ± 0.08 months for sheep and 9.05 ± 0.08 for goat in Alaba southern Ethiopia. The average lambing interval of sheep was significantly different (p<0.01) in high land (8.455 ± 0.17 months), midland (7.722 ± 0.05 months) and lowland (7.318 ± 0.07 months) in study area. The average kidding interval of goat in highland was significantly higher (p<0.01) aged (8.5 ± 0.127 month) than midland (8.236 ± 0.05 months) and lowland (8.045 ± 0.318 months) but the average kidding interval of goat in midland and lowland agro ecology was not statically different.
The overall average litter size of Ewe and Doe was 1.64 ± 0.041 and 1.62 ± 0.042 respectively observed in study area. This study was lower than Tsedeke who reported the average liter size 1.7 and 1.75 sheep and goat respectively in Alaba southern Ethiopia, Selamawit and Matiwos who reported the average liter size 1.78 ± 0.5 and 1.7 ± 0.63 for sheep and goat in Gedio Zone of southern Ethiopia, Endashawu who reported the average liter size 2.07 for goat in dale district southern Ethiopia, Higher than Getahun reported litter size of 1.42 and 1.24 for Adilo sheep and goats, respectively, Deiribe who reported litter size of 1.51 ± 0.04 for sheep and 1.47 ± 0.04 for goat in Alaba southern Ethiopia and Mukasa Mugrewa et al. reported litter size (1.14) for Horro sheep in western Ethiopia.
The average litter size of ewe and doe in lowland was significantly higher (p<0.01) aged (1.89 ± 0.048 months and 1.82 ± 0.05 months) than highland (1.55 ± 0.109 months and 1.55 ± 0.10 months) and midland (1.51 ± 0.503 months and 1.51 ± 0.059 months) but the average litter size of Ewe and Doe in highland and midland agro ecology was not statically different.
Small ruminant disease occurrence in study area
Diseases are a major constraint to the improvement of livestock industry in the tropics as they decrease production and increase the morbidity and mortality Mwacharo and Drucker. The most commonly prevailing diseases which hinder small ruminant production in the study area are presented in Table 22. Disease and parasite are the major limiting factor which hinder the production and productivity of livestock in general and small ruminant in particular. All respondents’ reported that there was occurrence of small ruminant disease in study area. In current study, major small ruminant diseases and parasites were identified through, house hold questioner and focus group discussion involving key informant farmers, development agents and veterinary technicians were occurrence of food and mouth disease, mastitis, ORF (sour mouth), Pasteurellosis, internal and external parasite with index of 0.06, 0.10, 0.09, 0.22, 0.25 and 0.28 respectively in study area. This result revealed that the three major disease and parasite which affect small ruminant production was internal parasite, external parasite and Pasteurellosis respectively accordingly to its economic importance in study area. Small ruminant owners use means of preventing and treating disease and parasite problem by 8% (Good management and Hygiene), 44.9% (Good management, Hygiene and vaccination) and 47.1% (Good management, Hygiene, vaccination and treatment) in study District.
| Altitude | Purpose | Rank(n) | ||||||||
|---|---|---|---|---|---|---|---|---|---|---|
| 1st | 2nd | 3rd | 4th | 5th | 6th | F value sum | Index | Rank | ||
| High land | FMD | 0 | 1 | 4 | 3 | 3 | 1 | 37 | 0.08 | 6th |
| Mastitis | 0 | 0 | 6 | 9 | 3 | 0 | 57 | 0.14 | 4th | |
| ORF | 0 | 3 | 2 | 3 | 3 | 0 | 38 | 0.09 | 5th | |
| Pasteurellosis | 2 | 1 | 7 | 5 | 3 | 2 | 68 | 0.16 | 3rd | |
| External parasite | 6 | 14 | 1 | 0 | 0 | 1 | 111 | 0.26 | 2nd | |
| Internal parasite | 14 | 3 | 2 | 2 | 0 | 2 | 115 | 0.27 | 1st | |
| Midland | FMD | 0 | 0 | 0 | 26 | 10 | 0 | 98 | 0.07 | 6th |
| Mastitis | 0 | 0 | 18 | 26 | 10 | 0 | 170 | 0.12 | 4th | |
| ORF | 2 | 0 | 10 | 6 | 18 | 0 | 106 | 0.08 | 5th | |
| Pasteurellosis | 8 | 8 | 28 | 10 | 14 | 0 | 258 | 0.18 | 3rd | |
| External parasite | 10 | 48 | 14 | 0 | 0 | 0 | 356 | 0.25 | 2nd | |
| Internal parasite | 52 | 16 | 2 | 2 | 0 | 0 | 406 | 0.3 | 1st | |
| Lowland | FMD | 0 | 0 | 0 | 0 | 8 | 2 | 18 | 0.02 | 6th |
| Mastitis | 0 | 0 | 0 | 12 | 2 | 2 | 42 | 0.05 | 5th | |
| ORF | 0 | 0 | 2 | 28 | 0 | 2 | 94 | 0.12 | 4th | |
| Pasteurellosis | 38 | 0 | 4 | 0 | 0 | 0 | 244 | 0.3 | 2nd | |
| External parasite | 0 | 16 | 28 | 0 | 0 | 1 | 181 | 0.23 | 3rd | |
| Internal parasite | 14 | 26 | 4 | 0 | 0 | 0 | 230 | 0.28 | 1st | |
| Overall | FMD | 0 | 1 | 4 | 29 | 21 | 3 | 153 | 0.06 | 6th |
| Mastitis | 0 | 0 | 24 | 47 | 15 | 2 | 269 | 0.1 | 4th | |
| ORF | 2 | 3 | 14 | 37 | 21 | 2 | 238 | 0.09 | 5th | |
| Pasteurellosis | 48 | 1 | 39 | 15 | 17 | 2 | 570 | 0.22 | 3rd | |
| External parasite | 16 | 78 | 43 | 0 | 0 | 1 | 648 | 0.25 | 2nd | |
| Internal parasite | 80 | 45 | 8 | 3 | 0 | 2 | 751 | 0.28 | 1st | |
Index=the sum of (6 times First order +5 times second order + 4 times third order + 3 times fourth order + 2 times fifth order+ 1 times sixth order) for individual variables divided by the sum of (6 times First order +5 times second order + 4 times third order + 3 times fourth order + 2 times fifth order+ 1 times sixth order) for all variables
Table 22: Small ruminant disease ranked by respondents in study area.
Constraints and opportunities of small ruminant production constraints of small ruminant production
Small ruminant production in the study area was constrained by interlinked technical, socioeconomic and institutional bottlenecks (lack of regular supervision of animal science expert and veterinarians). Constraints requiring proper and timely intervention towards improved smallholder sheep and goat production were identified. Constraints hindering performances of smallholder sheep and goat are presented in Table 23. .Disease and parasite, feed shortage and grazing land shortage, water shortage, drought and predators were the most pertinent constraint of small ruminant production study area in order of its importance. According to the respondents 76.9% of small ruminant constraints were disease and parasite, feed shortage and grazing land shortage, water shortage, drought and predators, 8.2% disease and parasite, water shortage, drought and predators, 6.4% were disease and parasite, feed shortage and grazing land shortage, drought and predators and 8.5% were disease and parasite, drought and predators in study area (Table 24). This finding was in line with Tsedeke [14] in Alaba southern Ethiopia, [21,27] Tesfaye, Solomon, Dhaba, in Ilu Abba Bora zone of Oromia Regional State, Tsegaye et al. Belete in Bale zone Ethiopia) and Yohannes et al. [48] in North Western Lowlands of Amhara Region, Ethiopia.
| Variables | Agro ecology | |||
|---|---|---|---|---|
| Highland | Midland | Lowland | Overall | |
| (n=22) | (n=72) | (n=44) | (N=138) | |
| Constraints of small ruminant production (%) Disease and parasite, drought and predator | 18.2 | 2.8 | 4.5 | 8.5 |
| Disease and parasite, water shortage, drought and Predator | 4.5 | 11.1 | 9.1 | 8.2 |
| Disease and parasite, feed and grazing land hortage, drought and predator |
4.5 | 5.6 | 9.1 | 6.4 |
| Disease and parasite, feed and grazing land hortage, Water shortage, drought and predator | 72.7 | 80.6 | 77.3 | 76.9 |
| Total | 100 | 100 | 100 | 100 |
Table 23: Constraints of small ruminant production.
| Altitude | purpose | Rank(n) | |||||||
|---|---|---|---|---|---|---|---|---|---|
| 1st | 2nd | 3rd | 4th | 5th | F value sum | Index | rank | ||
| High land | HMD | 4 | 6 | 4 | 8 | 0 | 72 | 0.22 | 4th |
| RSSIC | 7 | 2 | 9 | 4 | 0 | 78 | 0.23 | 2nd | |
| SGI | 5 | 11 | 6 | 0 | 0 | 87 | 0.26 | 1st | |
| RLL | 6 | 4 | 3 | 9 | 0 | 73 | 0.22 | 3rd | |
| AHEC | 0 | 0 | 0 | 0 | 22 | 22 | 0.07 | 5th | |
| Midland | HMD | 36 | 8 | 12 | 16 | 0 | 280 | 0.26 | 2nd |
| RSSIC | 8 | 22 | 26 | 16 | 0 | 238 | 0.22 | 3rd | |
| SGI | 18 | 30 | 22 | 2 | 0 | 280 | 0.27 | 1st | |
| RLL | 10 | 12 | 12 | 38 | 0 | 210 | 0.19 | 4th | |
| AHEC | 0 | 0 | 0 | 0 | 72 | 72 | 0.06 | 5th | |
| Lowland | HMD | 16 | 0 | 20 | 2 | 6 | 150 | 0.23 | 3rd |
| RSSIC | 18 | 12 | 6 | 8 | 0 | 172 | 0.26 | 2nd | |
| SGI | 10 | 24 | 8 | 2 | 0 | 174 | 0.27 | 1st | |
| RLL | 0 | 8 | 10 | 26 | 0 | 114 | 0.17 | 4th | |
| AHEC | 0 | 0 | 0 | 0 | 43 | 43 | 0.07 | 5th | |
| Overall | HMD | 56 | 14 | 36 | 26 | 6 | 502 | 0.24 | 2nd |
| RSSIC | 33 | 36 | 41 | 28 | 0 | 488 | 0.23 | 3rd | |
| SGI | 33 | 65 | 36 | 4 | 0 | 541 | 0.26 | 1st | |
| RLL | 16 | 24 | 25 | 73 | 0 | 397 | 0.2 | 4th | |
| AHEC | 0 | 0 | 0 | 0 | 137 | 137 | 0.07 | 5th | |
Table 24: Opportunities of small ruminant production ranked by respondents in study area.
Opportunity of small ruminant production
Tsedeke who reported the main opportunity of goat production was high market demand, low Despite constrains of small ruminant production there is a lot of opportunities which makes the small ruminant owner to expand small ruminant production at large in Dawro zone generally and study district particularly. According to respondents and focus group discussion with key informants all respondents reported to expand small ruminant production by considering opportunity of small production compared with other livestock production as well as crop production in study area. The major opportunity of small ruminant production identified and prioritized were high market demand for small ruminants and its product, requiring small space and initial capital for investment, short generation interval and multiple birth, low labour requirement and adaptation of harsh environment in study area. In general from listed opportunities of small ruminant production respondents identified and prioritized the major and primary opportunity of small ruminant production was short generation interval followed by high market demand with index of 0.26 and 0.24 respectively in study area [49-52]. Short generation interval of small ruminants were the primary opportunities considered by the respondents which might be due to quick turn over which was related with twinning rate of small ruminants and are advantages to enhancing household incomes which has led to diversification of agricultural activities and High market demand of small ruminant and small ruminant products were the second opportunities of small ruminant production which might be due to increase in population, urbanization and increase in household income [53]. This current finding was in line with Belete who reported the main opportunity of small ruminant production was high turnover, low labour and small space requirement and high market demand in Goma District Jimma zone Western Ethiopia and Okpebholo and Kahan [54] startup cost, low labour requirement and short generation interval or prolific nature. So, considering these emerging and existing opportunities, the extension system needs to organize and guide to focus on sheep and goats production in order to improve income and enhance smallholder livelihoods, by minimizing flock loss through diseases and parasites control protection against predators and proper.
Conclusion
This study was conducted in Esera districts of Dawuro Zone of southern Ethiopia to assess sheep and goat production system based on agro ecology (high, mid and lowland) of the area. The survey study was implemented by interviewing selected individual small ruminant producer, key informants and focus group discussion. Esera district of Dawuro zone were selected for this study purposively based on potential for small ruminant production.
In Esera District, cattle, goats, donkeys, sheep and chickens are reared. Among these livestock species, cattle, goats and sheep’s are the most dominant animal species reared in the district. The result of this study demonstrated that, sheep and goat production system were affected by agro ecology in study district. Results of the study showed that the main purpose of keeping sheep and goat were cash income, insurance, meat, manure and wealth in the study area. The result showed that mixed crop- livestock production system was the dominant farming system and natural mating was also the common mating system practiced in the study area. Majority of respondents were selecting sheep and goat for production, based body conformation, Age, breed and physical characteristics and selecting rams and bucks for breeding coat based on color, behavior, body conformation and Meat production potential. Selection is done the superior one, which is important for enhancement of production potential for the next generation. This result also indicated that almost all respondent castrate their ram and bucks to fatten and to avoid mating of the same flock and majority sheep and goat owner cull their sheep and goat from flock based on age, disease related problem, lambing and kidding problem, physical defects and low production to improve the overall flock productivity.
Sheep and goat production are faced by the shortage feed especially during dry season, poor in quality and decreasing its productivity for grazing and in wet season expansion of crop cultivation on grazing areas are the majors problems. River water, tap water and harvested water including spring water are the main source for small ruminants and other livestock in the study area.
The result showed that the major constraint sheep and goat production were disease and parasite, feed and shortage of grazing land shortage of water, drought. Predators attack is the major ounces. Opportunity are short generation interval, high market demand, requirement of small space and less investment capital requirement less labor and adaptation to harsh environmental condition are encouraging. Age at puberty, first lambing, kidding interval. Litter size and marketing age are the major factors limiting or enhancing the productivity of small ruminants, so improving the management will help in enhance the production potentials of small ruminants.
The study revealed that the sheep and goat production system in the area was traditional management system which was heavily depends up on available local breeds of sheep and goat. Therefore, Provision of strong extension services and training on sheep and goat production and management practices and the potential of existing breed for sheep and goat production etc. need to be identified, so that specialization in improving should be done for each spacious of animals
To minimize feed shortage in study area the following solutions are proposed like giving advice for sheep and goat owners to enrich their way of feed preservation will solve the feed scarcity including strong extension services will be helpful in solving the problems associated with small ruminant production .housing Sheep and goats do not tolerate mud well; therefore yards and shelters should be built only on well drained ground In areas of high rainfall it may be desirable to keep the animals off the ground and the health aspect need to be addressed properly by extension services.