Journal of Chromatography & Separation Techniques
Open Access
ISSN: 2157-7064
ISSN: 2157-7064
Research Article - (2017) Volume 8, Issue 5
Aim: UHPLC method was developed and validated for the determination of Paracetamol, Aceclofenac and Chlorzoxazone in pharmaceutical dosage form. Methods: Separation was performed in Agilent technologies 1220 infinity LC system equipped with open lab CDS Chemstation software using Eclipse plus C18 (50 × 4.6 mm id, 1.8 μm) column with mobile phase containing 0.05% orthophosphoric acid, adjusted to pH 6.0 with triethylamine and acetonitrile in the ratio of 70:30 v/v with a flow rate of 0.5 mL/min and detection wavelength 270 nm. Results: The method was found to be linear in the concentration range of 161.59-484.77 μg/mL for paracetamol, 49.69-149.09 μg/mL for aceclofenac and 124.81-374.43 μg/mL for chlorzoxazone with correlation coefficient of 0.999 for all the three drugs respectively. The %RSD of 0.57, 0.45 and 0.60 for intra-day and 0.96, 0.88 and 0.84 for inter-day precision, respectively for of Paracetamol, Aceclofenac and Chlorzoxazone suggest the precision of the method as all these values are less than 2%. The method has shown good, consistent recoveries for of Paracetamol (99.90-99.95%), Aceclofenac (99.83-99.92%) and Chlorzoxazone (99.39-99.59%) which are close to 100%. Conclusion: The method was found to be accurate, precise, specific, robust and linear for the determination of Paracetamol, Aceclofenac and Chlorzoxazone in pharmaceutical dosage form.
Keywords: UHPLC; Validation; Paracetamol; Aceclofenac; Chlorzoxazone
Aceclofenac is 2-[2-[2-(2, 6-dichlorophenyl) aminophenyl] acetyl] oxyacetic acid is a highly effective anti-inflammatory drug. It has been widely used for the treatment of arthritis. It works by blocking the action of a substance in the body called cyclooxygenase. Cyclooxygenase is involved in the production of various chemicals in the body, some of which are known as prostaglandin. Paracetamol is N- (4-hydroxyphenyl) acetamide is a well-known analgesic drug, which is very effective treatment for the relief of pain and fever in adults and children. Paracetamol is mostly converted to inactive compounds via Phase II metabolism by conjugation with sulfate and glucuronide, with a small portion being oxidized via the cytochrome P450 enzyme system. Cytochrome P450 2E1 (CYP2E1) converts paracetamol to a highly reactive intermediary metabolite, N-acetyl-pbenzoquinone imine (NAPQI). Chlorzoxazone is 5-chloro-2- benzoxazolone is an effective muscle relaxant. Chlorzoxazone is a centrally acting agent for painful musculoskeletal conditions. Both I.P. and B.P. suggests titrimetric and UV spectrophotometric assay method for PARA in bulk and tablet formulations [1]. The literature survey reveals that PARA is estimated individually or in combination with other drugs by UV, HPLC, and in plasma by RP-HPLC method. In addition, LC-MS, HPTLC and stability-indicating GC/MS methods have also been reported. For ACF, spectrofluorimetric, colorimetric, densitometric and HPLC methods have been reported in pharmaceutical dosage forms. For CHZ, UV method, RP-HPLC, HPLC/UV method for analysis of plasma/serum samples and HPTLC methods have been reported. To the best of our knowledge there is no UHPLC method reported for the simultaneous estimation of PARA, ACF and CHZ in combined dosage forms. The structure of Paracetamol, Aceclofenac and Chlorzoxazone is represented in Figure 1 [2].
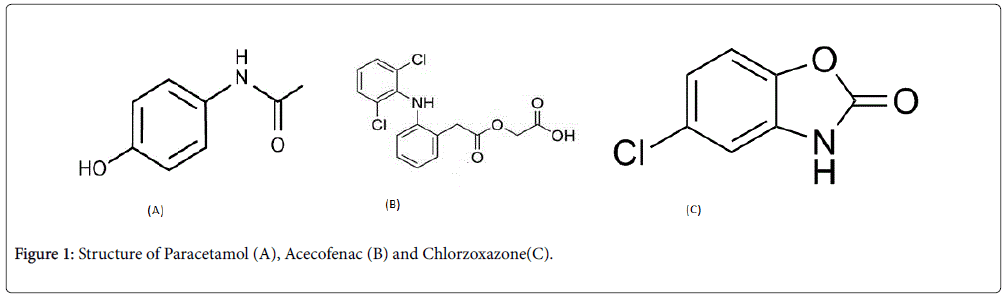
Figure 1: Structure of Paracetamol (A), Acecofenac (B) and Chlorzoxazone(C).
Reagents and chemicals
Qualified standard of PARA, ACF and CHZ were obtained as gift samples from Reddy's Laboratories, Hyderabad, India. Methanol, Acetonitrile and Water (HPLC grade), triethylamine and orthophosphoric acid were obtained from Merck Chemicals, Mumbai, India. Commercially available tablets (Acceclowoc-MR, PARA 325 mg, ACF 100 mg and CHZ 250 mg) were procured from local market [3].
Chromatography instruments and conditions
The chromatograph consisted of an Agilent technology, model 1220 infinity LC system with binary solvent manager, auto injector and UV detector. The data were evaluated by Open lab CDS Chemstation software. The separation was accomplished using an Eclipse plus C18 (50 × 4.6 mm × 1.8 μm particle size) column and a mobile phase (0.05% orthophosphoric acid, adjusted to pH 6.0 with triethylamine and acetonitrile in the ratio of 70:30 v/v with a flow rate of 0.5 mL/min. The column eluents were monitored at 270 nm. All the solutions were filtered and degassed before use [4].
Preparation of standard solution
Weighed accurately and transferred 162.5 mg of PARA, 50 mg of ACF and 125 mg of CHZ in a 100 mL volumetric flask, dissolved with 20 mL of mobile phase and sonicated for 10 min and finally made up the volume with the mobile phase. This was further diluted to obtain the concentration range of 161.59-484.77 μg/mL for PARA, 49.69-149.09 μg/mL for ACF and 124.81-374.43 μg/mL for CHZ. This solution was filtered through a 0.45 mm filter before use.
Preparation of sample solution
An amount of sample containing equivalent to 162.5 mg of PARA, 50 mg of ACF and 125 mg of CHZ mg was transferred to a 100 mL volumetric flask, dissolved with 30 mL of mobile phase and sonicated for 10 min and finally made up the volume with the mobile phase. The solution was filtered through a Whatman filter paper and from the filtrate, 10 mL was transferred in a 50 mL volumetric flask and the volume was made up with the mobile phase. This solution was filtered again through a 0.45 mm filter before use [5].
Optimization of chromatographic conditions
To develop an effective method for the analysis of the drugs, preliminary tests were performed in order to select adequate and optimum conditions. Parameters such as detection wavelength, ideal mobile phase and its combination, optimum pH and concentration of the standard solutions were studied. Mobile phase consisting of acetonitrile and 0.05% orthophosphoric acid previously adjusted to pH 6.0 with triethylamine (30:70 v/v). The flow rate was adjusted to 0.5 mL/min and UV detection at 270 nm was selected for analysis after the preliminary tests. The retention time of PARA, ACF and CHZ were found to be 0.94, 3.84 and 1.92 min respectively [6]. The blank chromatogram and standard Chromatogram of PARA, ACF and CHZ was shown in Figures 2 and 3.
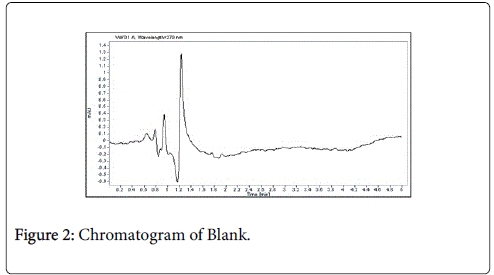
Figure 2: Chromatogram of Blank.
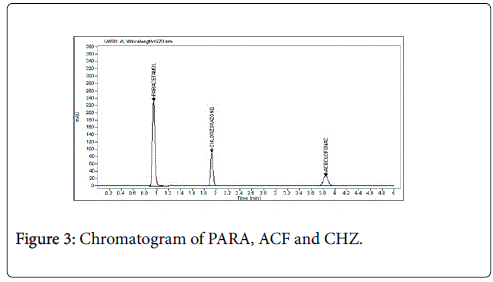
Figure 3: Chromatogram of PARA, ACF and CHZ.
Method validation
System suitability: Six replicate of sample containing PARA, ACF and CHZ were given to evaluate equipment, analytical operations and samples suitability. Parameters calculated for system suitability were %RSD of retention time, number of theoretical plates and tailing factor [7].
Linearity: The calibration curve for PARA, ACF and CHZ was linear over the concentration range of 161.59-484.77 μg/mL for Paracetamol, 49.69-149.09 μg/mL for Aceclofenac and 124.81-374.43 μg/mL for Chlorzoxazone. The data for the peak area against the concentration were treated by linear regression analysis and the correlation coefficient value obtained was 0.999 for all the three drugs respectively and the calibration curve was shown in Figures 4-6 (Table 1).
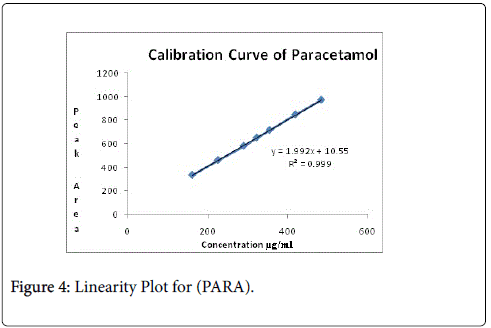
Figure 4: Linearity Plot for (PARA).
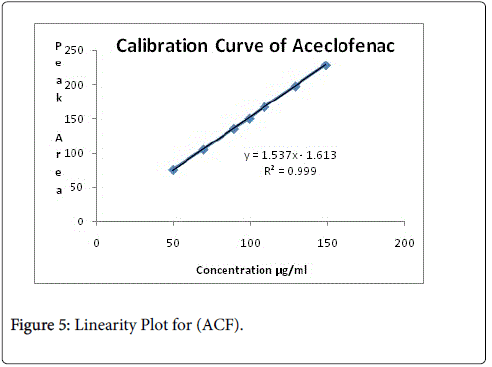
Figure 5: Linearity Plot for (ACF).
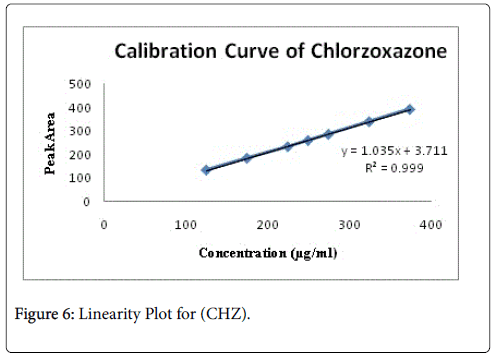
Figure 6: Linearity Plot for (CHZ).
| Concentration (µg/mL) | Peak Area | ||||
|---|---|---|---|---|---|
| PARA | ACF | CHZ | PARA | ACF | CHZ |
| 161.59 | 49.69 | 124.81 | 335.2 | 75.70 | 134.8 |
| 226.23 | 69.57 | 174.74 | 462.5 | 104.80 | 185.3 |
| 290.86 | 89.45 | 224.66 | 583.3 | 135.60 | 234.2 |
| 323.18 | 99.39 | 249.62 | 653.9 | 150.20 | 260.8 |
| 355.50 | 109.33 | 274.58 | 718.2 | 167.10 | 287.0 |
| 420.13 | 129.21 | 324.51 | 851.9 | 197.50 | 340.6 |
| 484.77 | 149.09 | 374.43 | 976 | 227.80 | 393.0 |
| Correlation Coefficient | 0.999 | 0.999 | 0.999 | ||
Table 1: Linearity of Paracetamol, Aceclofenac and Chlorzoxazone.
Precision: The precision of the method was determined by intra-day and inter-day precision studies at 100% test concentration by taking six separate weights of the sample. Values of %RSD for intra-day were 0.57, 0.45 and 0.60 and for inter-day 0.96, 0.88 and 0.84 for PARA, ACF and CHZ respectively, which is well within the acceptance criteria as shown in Tables 2 and 3.
| S.No | Sample | PARA | ACF | CHZ | |||
|---|---|---|---|---|---|---|---|
| Area | Assay % | Area | Assay % | Area | Assay% | ||
| 1 | Low-1 | 396 | 99.08 | 90.2 | 99.56 | 156.9 | 99.23 |
| 2 | Low-2 | 393.5 | 99.19 | 90.4 | 99.33 | 156.2 | 99.36 |
| 3 | Low-3 | 395.8 | 98.66 | 89.8 | 99.1 | 157 | 99.897 |
| 4 | Mid-1 | 673.4 | 100.71 | 153.7 | 100.91 | 266.6 | 100.68 |
| 5 | Mid-2 | 668.8 | 101.61 | 154.6 | 101.32 | 265.7 | 101.51 |
| 6 | Mid-3 | 669.7 | 100.72 | 152.4 | 100.47 | 264.8 | 100.52 |
| 7 | High-1 | 923.8 | 99.15 | 212.7 | 99.2 | 370.8 | 100.17 |
| 8 | High-2 | 920 | 99.23 | 211.3 | 99.47 | 368.5 | 100.96 |
| 9 | High-3 | 918.9 | 99.27 | 210.9 | 99.95 | 364.7 | 100.33 |
| Average: | 99.67 | 99.97 | 100.03 | ||||
| S.D: | 0.31 | 0.13 | 0.07 | ||||
| % R.S.D: | 0.57 | 0.45 | 0.6 | ||||
Table 2: Data for Intraday Precision.
| S.No | PARA | ACF | CHZ | |
|---|---|---|---|---|
| % Assay | %Assay | %Assay | ||
| 1 | 98.95 | 99.19 | 100.96 | |
| 2 | 99.49 | 99.21 | 100.33 | |
| 3 | 99.69 | 98.65 | 99.30 | |
| 4 | 100.16 | 99.16 | 100.80 | |
| 5 | 100.51 | 98.69 | 99.79 | |
| 6 | 100.52 | 98.95 | 99.79 | |
| Average: | 99.67 | 99.97 | 100.03 | |
| S.D: | 0.96 | 0.88 | 0.84 | |
| % R.S.D: | 0.96 | 0.88 | 0.84 | |
Table 3: Data for Intermediate Precision.
Accuracy: The accuracy of the method was proven by recovery test. Known amounts of PARA, ACF and CHZ standard (10, 20 and 30% level were added to the already analyzed sample solutions and the analysis was carried out. The method has shown good, consistent recoveries for PARA, ACF and CHZ (99.90-99.95%, 99.83-99.92% and 99.39-99.59%) which are close to 100% as shown in Table 4 [8,9].
| Level (%) | Conc. of formulation (µg/mL) | Conc. of std drug spiked (µg/mL) | *%Recovery ± RSD | |||||||
|---|---|---|---|---|---|---|---|---|---|---|
| PARA | ACF | CHZ | PARA | ACF | CHZ | PARA | ACF | CHZ | ||
| 10 | 323.94 | 99.97 | 250.07 | 32.55 | 9.96 | 25.02 | 99.95 ± 0.44 | 99.83 ± 0.31 | 99.39 ± 0.42 | |
| 20 | 323.94 | 99.97 | 250.07 | 65.1 | 19.89 | 50.04 | 99.67± 0.32 | 99.68 ± 0.2 | 99.49 ± 0.54 | |
| 30 | 323.94 | 99.97 | 250.07 | 97.66 | 29.92 | 75.06 | 99.90 ± 0.26 | 99.92 ± 0.29 | 99.59 ± 0.3 | |
Table 4: Recovery study.
Robustness: The robustness of the method was checked by deliberately varying the mobile phase composition, wavelength and flow rate which shows that the small changes of the method parameters do not affect the performance of the method. All the results obtained were in accordance with the results for original conditions. The %RSD value obtained for the assay in the changed condition was less than 2% which indicates the robustness of the proposed method.
Solution stability: The %RSD of the peak areas of the test samples were less than 1% for 24 hrs which indicates that the sample was stable under proposed mobile phase condition within this period only.
LOD and LOQ: The LOD for PARA, ACF and CHZ were found to be 0.08 μg/mL, 0.02 μg/mL and 0.06 μg/mL respectively. LOQ for PARA, ACF and CHZ were found to be 0.25 μg/mL, 0.06 μg/mL and 0.18 μg/mL respectively.
Analysis of commercial formulations
The developed method was applied for the determination of PARA, ACF and CHZ in pharmaceutical dosage form (Acceclowoc MR) and the results obtained were presented in Table 5. The assay value of 99.70%, 99.94% and 100.63% for PARA, ACF and CHZ indicates that the method is selective for the assay of PARA, ACF and CHZ without interference from any of the excipients of the tablet dosage form [10].
| Drug | Label Claim (mg/tab) | Amount found (mg/tab) | *%Label Claim ± S.D | ||||||
|---|---|---|---|---|---|---|---|---|---|
| Acceclowoc MR |
PARA | ACF | CHZ | PARA | ACF | CHZ | PARA | ACF | CHZ |
| 325 | 100 | 250 | 324.02 | 99.93 | 251.57 | 99.70 ± 0.4806 | 99.94 ± 0.1738 | 100.63± 0.256 | |
*Average of three determinations
Table 5: Assay of PARA and ACF and CHZ.
The newly developed method is simple and cost effective as it uses simple mobile phase without ion-pairing reagent which was previously unreported, to effect the separation in 5 minutes only. The method was validated as per ICH guidelines. All other parameters such as specificity, linearity, precision, accuracy, robustness passes the criteria set forth by ICH guidelines. There was no interference from any components of the formulation. Statistical validated and can be used for routine quality control analysis of PARA, ACF and CHZ (Table 6).
| Parameter | PARA | ACF | CHZ | |
|---|---|---|---|---|
| System suitability | Tailing factor | 1.01 | 1.23 | 0.84 |
| Theoretical plates/meter | 2532.5 | 10457.5 | 9906.9 | |
| % RSD of 6 injections | 0.838 | 0.557 | 0.598 | |
| System Precision | 0.677 | 0.423 | 0.63 | |
| Method Precision | 0.57 | 0.45 | 0.6 | |
| Ruggedness | 0.96 | 0.88 | 0.84 | |
| Accuracy (Mean) | 99.67 | 99.97 | 99.83 | |
| Linearity (r2) | 0.999 | 0.999 | 0.999 | |
| Robustness | Within Acceptance criteria | Within Acceptance criteria | Within Acceptance criteria | |
| Specificity | No Interference due to blank and placebo | No interference due to blank and placebo | No interference due to blank and placebo | |
Table 6: Summary of Validation Parameters.