Journal of Chromatography & Separation Techniques
Open Access
ISSN: 2157-7064
ISSN: 2157-7064
Research Article - (2017) Volume 8, Issue 6
A newly developed micellar liquid chromatographic analysis technique was utilized for the determination of Terbinafine HCl (TRH). A 150 mm × 4.6 mm i.d., Shim-pack Cyanopropyl-bonded stationary phase was used for analysis. A mixture of 0.15 M sodium dodecyl sulphate (SDS), 0.3% triethylamine(TEA), 10% n-propanol all prepared in 0.02 M orthophosphoric acid was the mobile phase. The pH of the mobile phase was adjusted to 5.5 and pumped at a flow rate of 1 mL/min. The column temperature was set at 45°C. A fluorescence detection of (TRH) at 336 nm emission λ after excitation at 236 nm. Chlorzoxazone (CLZ) was used as an internal standard (IS). The method was linear over the range of 0.4-8.0 μg/mL. The limit of detection (LOD) and limit of quantification (LOQ) were 0.07 μg/ mL and 0.22 μg/mL, respectively. The method was further applied for analysis of the studied drug in its tablet, spray, cream and gel formulations. Not only this, but extending the application of the method for determination of terbinafine hydrochloride in spiked human plasma without prior extraction. Statistical analysis through comparison of the data obtained by the proposed and comparison methods, showed good accuracy and precision of the proposed method.
Keywords: Micellar liquid chromatography; Terbinafine HCl; Chlorzoxazone; Dosage forms; Human plasma
Terbinafine hydrochloride (Figure 1); (E)-N-(6,6-dimethyl-2- hepten-4-ynyl)-N-methyl-1-naphthalenemethanamine hydrochloride [1]. Terbinafine is an allylamine derivative reported to have a broad spectrum of antifungal activity. It is considered to act through inhibition of fungal sterol synthesis. It is fungicidal against dermatophytes, moulds, and certain dimorphic fungi and some yeast [2,3]. Terbinafine is given by mouth as the hydrochloride in the treatment of dermatophyte infections of the skin and nails. It is also applied, as the hydrochloride, to the skin in dermatophytosis, in pityriasis versicolor and in cutaneous candidiasis.
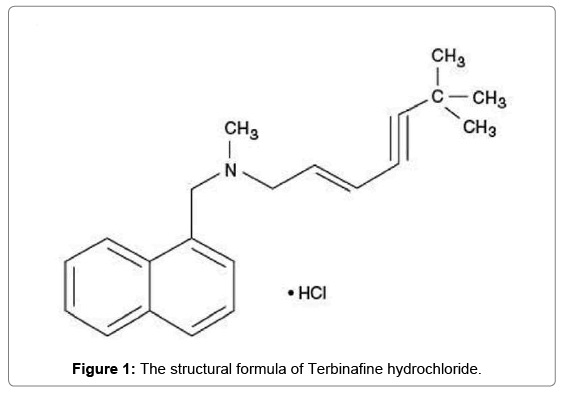
Figure 1: The structural formula of Terbinafine hydrochloride.
TRH is official in the United State Pharmacopoeia (USP) [4], in the British Pharmacopoeia (BP) [5], and in the European Pharmacopoeia (EP) [6].
Reviewing the literature revealed that, numerous analytical methods were developed for the assay of TRH, chromatographic methods including TLC [7-9], GC [10,11], and HPLC. Different HPLC methods were reported for the assay of TRH either in dosage forms as cream [12-14], Tablets [15-17] and liniment [18], or in biological fluids [19-25]. Various spectrophotometric methods have also been used for the analysis of TRH (23-25). This in addition to capillary electrophoresis [26,27] and electrochemical methods [28-31].
To the best of our knowledge, up till now no micellar liquid chromatographic methods have been reported for the determination of TRH in pharmaceutical preparations or in human plasma. Recently, interest in the use of micellar mobile phases in reversed liquid chromatography has grown. In such a system, complex interactions (electrostatic, hydrophobic, and steric) exist between the solute and both the stationary and the mobile phase [32]. Micellar liquid chromatography is an alternative method to conventional liquid chromatography. The use of micellar liquid chromatography for the separation of different samples is increasing due to some advantages with respect to conventional liquid chromatography such as the low cost and low toxicity of the mobile phases due to the small amount of solvent employed in the mobile phases, the enhanced selectivity and rapid elution capability and simultaneous separations of hydrophobic and hydrophilic compounds as a result of the large number of interactions of the solutes with the stationary and mobile phases [33]. The solubilizing ability of micelles is one of the most important properties of this technique; in addition, it allows direct injection of untreated samples, including biological fluids like serum. Direct injection of physiological samples is feasible owing to solubilization of proteins by the micelles and monomers of surfactant. Thus, the proteins are eluted in the solvent front rather than being highly retained or precipitated. In addition, the protein bound drugs are also displaced by the surfactant and released for partitioning to the stationary phase [34].
In addition, none of the methods applied for the determination of TBH utilized fluorescence detection, although when referring to the chemical structure of TRH with a naphthalene ring it could be predicted that a compound of such structure would have a native fluorescence. One major advantage of fluorometric detection is the possibility of obtaining three orders of magnitude increased sensitivity over absorbance detection and its ability to discriminate analyte from interference and background peaks, contrary to absorbance fluorescence is a “low back ground” technique. Another major advantage of fluorometric detection is selectivity; the increased selectivity of fluorescence vs. absorbance is mainly due to the following reasons: (a) most organic molecules will absorb UV/ visible light but not all will fluoresce. (b) Fluorescence makes use of two different wavelengths (excitation and emission) as opposed to one in absorbance, thus decreasing the chance of detecting interfering chromatographic peaks [35].
In the present work, a micellar HPLC method with fluorescence detection was utilized for the determination of TRB with retention times less than 6 min. This method could be applied for the quantitative determination of the studied drug in its different dosage forms, as well as in human plasma. The results obtained were promising.
Apparatus
1. HPLC experiments were performed with a Shimadzu LC-20AD Prominence liquid chromatogram equipped with a Rheodyne injector valve with a 20 μL loop. The detection of analyte was monitored at emission 336 nm after excitation at 236 nm by a spectrofluorometric detector RF-10AXL. Mobile phases were degassed using a prominence degasser DGU-20A5.
2. A Consort NV P-901 pH –Meter (Belgium) was used for pH measurements.
3. Ultrasonic bath, model SS 101 H 230, USA.
Materials and reagents
All the chemicals used were of Analytical Reagent Grade, and the solvents were of HPLC grade.
1. Terbinafine HCl was kindly provided by LKT Laboratories, lot# 2594805. The purity percentage of TRB was 100.17 ± 1.19. The purity was established by applying the USP method [4].
2. Chlorzoxazone, used as the internal standard (IS), was kindly donated by Alexandria CO. for Pharmaceuticals, Alexandria, Egypt.
3. Pharmaceutical preparations containing the drug were purchased from different commercial sources in the local pharmacy.
4. Lamisil® 250 mg tablet (Produced by Novartis Pharma S.A.E Cairo- C.C.R. under license from Novartis Pharma AG., Basle, Switzerland), labelled to contain 250 mg of terbinafine as hydrochloride, batch # Y0018.
5. Lamisil® 125 mg tablet (Produced by Novartis Pharma S.A.E Cairo-C.C.R.111108 under license from Novartis Pharma AG., Basle, Switzerland), labeled to contain 125 mg of terbinafine as hydrochloride, batch # Y0002.
6. Lamisil® 1% cream (Produced by Novartis Pharma S.A.E Cairo- C.C.R. 111108 under license from Novartis consumer Health SA, Nyon, Switzerland) batch # Y0150.
7. Lamisil® spray (Produced by Novartis Pharma SAS, Huningue, France, for Novartis Pharma AG. Basle, Switzerland) labeled to contain 10 mg of terbinafine as hydrochloride/1 gm spray, batch # H5264.
8. Lamisil® derm gel (Produced by Novartis Pharma S.A.E Cairo- C.C.R. 111108 under license from Novartis consumer Health SA, Nyon, Switzerland) labeled to contain 10 mg of terbinafine /1 gm gel, batch # Y0013.
9. Sodium dodecyl sulphate (SDS) 90%, triethylamine (TEA) and orthophosphoric acid 85% were obtained from Riedel-deHaen (Sleeze, Germany).
10. Methanol, n-propanol and acetonitrile (HPLC grade) were obtained from Sigma- Aldrich (Germany).
11. Human plasma was kindly provided by Mansoura University Hospitals, Mansoura, Egypt and kept frozen (-5 °C) until used after gentle thawing.
Chromatographic conditions
Column: Shim-Pack (150 mm × 4.6 mm i.d CLC-Cyanopropyl packed column. The column holds up value was the first deviation of the base line obtained. Mobile phase: a solution consists of 0.15 M SDS, 10% n-propanol, 0.3% TEA, prepared in 0.02 M orthophosphoric acid. The pH of the mobile phase was adjusted to pH 5.5 using orthophosphoric acid and the flow rate was 1 mL/min. The column was operated at 45 °C and the wavelength was monitored at 336 nm after excitation at 236 nm. Chlorzoxazone was selected as the internal standard.
Standard solutions
Stock solutions of 400 μg/mL TRH and CLZ (IS) were prepared by dissolving 10 mg of each in 25 mL methanol with the aid of an ultrasonic bath. Working standard solutions were prepared by appropriate dilution of the stock solutions with methanol. Solutions of TRH were protected from light with aluminium foil. All solutions were stored in the refrigerator and found to be stable for at least 10 days without alteration.
Procedures
Construction of calibration graph: Accurately measured aliquot volumes of the suitable drug working standard solutions were transferred into a series of 10 mL volumetric flasks so that the final concentration was in the range of 0.4-8.0 μg/mL. To each flask, 0.5 mL of CLZ standard solution was added so that, the final concentration was 20.0 μg/mL. Then, the solutions were completed to the volume with the mobile phase. Aliquots of 20.0 μL were injected (triplicate) and eluted with the mobile phase under the optimum chromatographic conditions. The average peak area ratio (Drug/I.S.) versus the final concentration of the drugs in μg/mL was plotted. Alternatively, the corresponding regression equations were derived.
Analysis of TRH in tablets: An accurately weighed quantity of the mixed contents of 10 powdered Lamisil® tablets equivalent to 10.0 mg TRH was transferred into a 25-mL volumetric flask and about 15 mL of methanol were added. The contents of the flask were sonicated for 30 min, completed to the mark with the same solvent and filtered through syringe filter. Further dilution with the same solvent was performed to get working standard solution to be assayed by subjecting to the general procedure as described under “construction of calibration graph”. The nominal content was calculated either from a previously plotted calibration graph or using the corresponding regression equation.
Analysis of TRH in cream and gel: An accurately weighed quantity of the cream or gel equivalent to 10.0 mg TRH was transferred into a clean dry 25 mL beaker and about 15 mL of methanol were added. The contents of the beaker were sonicated for 30 min, and then quantitatively transferred into 25 mL volumetric flask, completed to the mark with the same solvent, cooled in ice bath to solidify the base and filtered through syringe filter. Further dilution with the same solvent was performed to get working standard solution to be assayed by subjecting to the general procedure as described under “construction of calibration graph”. The nominal content was calculated either from a previously plotted calibration graphs or using the corresponding regression equations.
Analysis of TRH in spray: An accurately weighed quantity of the spray equivalent to 10.0 mg TRH was transferred into a clean dry 25 mL beaker and about 15 mL of methanol were added. The contents of the beaker were sonicated for 30 min, and then quantitatively transferred into 25 mL volumetric flask, completed to the mark with the same solvent. Further dilution with the same solvent was performed to get working standard solution to be assayed by subjecting to the general procedure as described under “construction of calibration graph”. The nominal content was calculated either from a previously plotted calibration graphs or using the corresponding regression equations.
Analysis of TRH in spiked human plasma: Different volumes of TRH working standard solution were transferred into a series of 10 mL volumetric flasks to give final concentrations in the range of 0.4-1.0 μg/mL. To each flask, 0.5 mL of CLZ standard solution was added so that, the final concentration was 20.0 μg/mL. To prevent precipitation of plasma protein by methanol (solvent of TRH and CLZ), 5 mL of mobile phase (pH 5.5) were added to each flask. 1 mL of human plasma was then added, and the final volume was adjusted by adding mobile phase. 20 μL aliquots were injected (triplicate) and eluted with the mobile phase under the specified chromatographic conditions. A blank experiment was carried out simultaneously. The peak area ratio was plotted versus the drug concentration in μg/mL.
Atypical chromatogram for TRH 8.0 μg/mL and CLZ IS 20.0 μg/mL under the described chromatographic condition is shown in Figure 2. The retention times for TRB and CLZ were 5.6 and 3.9 min., respectively. The proposed method showed high sensitivity, concentration of 0.4 μg/mL of TRH could be determined accurately. The method also permitted the accurate analysis of TRH in its tablet, cream, gel and spray formulations as well as in human plasma.
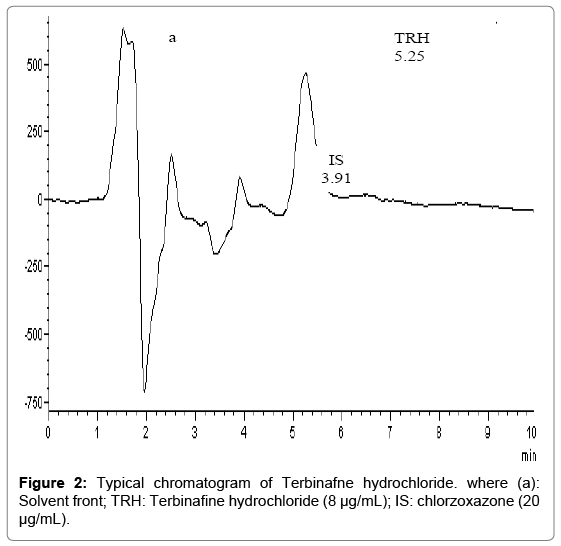
Figure 2: Typical chromatogram of Terbinafne hydrochloride. where (a): Solvent front; TRH: Terbinafine hydrochloride (8 μg/mL); IS: chlorzoxazone (20 μg/mL).
Optimization of the chromatographic performance and system suitability
A well-defined symmetrical peak was obtained after thorough experimental trials that can be summarized as follows:
Choice of column: Two different columns were used for performance investigations, including: Shim-Pack Cyanopropyl column (150 mm × 4.6 mm i.d, 5 μm particle size), Shimadzu, Kyoto, Japan and Shimadzu VP-ODS column (150 mm × 4.6 mm i.d., 5 μm particle size), Shimadzu, Kyoto, Japan. Trials revealed that the first column was more suitable, drug was eluted within a short time. No detectable peak was obtained even after 45 min with the second column. This could be attributed to the high lipophilicity of the drug that restricted the choice of the stationary phase to the mid-polarity type, e.g., cyanopropyl bonded stationary phase, rather than the nonpolar stationary phases such as C8 or C18 columns to which the drug has a high affinity, particularly when using micellar mobile phase. Reviewing the literature, it was noted that most of the HPLC methods used for analytical determination of TRH, using C8 or C18 columns, employed mobile phases of high elution strength containing more than 70% of organic solvents.
Effect of temperature: Different column temperature settings were studied over the range of 20°C-50°C, it was found that increasing column temperature greatly enhanced peak shape and resulted in reduced retention time and increased number of theoretical plates. Optimum Column temperature of 45 °C was chosen for the analysis of TRH; higher temperature was avoided to reserve the column longer time. The results obtained are summarized in Table 1.
| Parameter | No. of theoretical plates (N) | Resolution (Rs) | Capacity factor (ќ) | |
|---|---|---|---|---|
| pH of the mobile phase | 2.5 | 541 | 7.28 | 4.19 |
| 3 | 595 | 7.60 | 3.99 | |
| 4 | 700 | 7.95 | 3.89 | |
| 5 | 455 | 6.95 | 4.11 | |
| 5.5 | 511 | 7.21 | 4.01 | |
| 6 | 649 | 7.88 | 3.82 | |
| 7 | 605 | 7.93 | 4.11 | |
| Column temperature | Room temp. | 511 | 7.21 | 4.01 |
| 30 | 693 | 7.71 | 3.36 | |
| 40 | 955 | 8.30 | 2.82 | |
| 45 | 1176 | 7.99 | 2.56 | |
| 50 | 1187 | 8.50 | 2.37 | |
| Conc. of SDS(M) | 0.05 | 268 | 6.39 | 3.71 |
| 0.10 | 1135 | 8.95 | 2.98 | |
| 0.125 | 1150 | 8.12 | 2.88 | |
| 0.15 | 1176 | 7.99 | 2.56 | |
| 0.175 | 834 | 6.50 | 2.05 | |
| Conc. of n-propanol (%v/v) |
5 | 573 | 7.62 | 3.50 |
| 8 | 947 | 8.44 | 3.63 | |
| 10 | 1176 | 7.99 | 2.56 | |
| 12 | 834 | 7.49 | 2.19 | |
| Flow rate (mL/min) |
0.8 | 1000 | 8.23 | 2.97 |
| 1.0 | 1176 | 7.99 | 2.56 | |
| 1.2 | 1157 | 8.77 | 2.32 | |
Table 1: Effect of different experimental conditions on chromatographic parameters.
Mobile phase composition: Several modifications in the mobile phase composition were performed in order to study the possibilities of improving the performance of the chromatographic system. These modifications included the change of the type and % concentration of the organic modifier, the concentration of SDS, and the pH. The results obtained are abridged in Table 1.
pH: The effect of changing the pH of the mobile phase on the selectivity and retention time of the test solute was investigated using mobile phases of pH ranging from 2.5-7. It was found that changing the pH over the range 2.5-7 using increasing amounts of triethylamine in phosphoric acid have no significant effect on the retention factors of the drug. Hence pH of 5.5-6 was the pH of choice since it is mostly the pH of the prepared micellar mobile phase without the need for pH adjustment with either orthophosphoric acid or triethylamine.
Concentration of SDS: The effect of changing the concentration of SDS on the selectivity and retention time of the test solute was investigated using mobile phases containing a concentration of 0.05- 0.175 M SDS. It was found that the retention time of TRH decreased upon increasing the % concentration of SDS. The study revealed that the optimum chromatographic performance was achieved upon using 0.15 M SDS regarding the capacity factor and number of theoretical plates. Concentrations less than 0.05 M SDS resulted in great increase in the retention time.
Concentration of organic modifier (%): Varying % concentrations of n-propanol ranging from 5-12% were tested, where, the effect of changing the % concentration on the selectivity and retention time of TRH was investigated. It was found that increasing the % concentration of n-propanol resulted in shorter retention times of TRH. The study revealed that the optimum chromatographic performance was achieved upon using 10% n-propanol regarding the retention time and number of theoretical plates.
Type of organic modifier: Different organic modifiers of 10% concentration were tried during the experimental study to choose the most suitable one. The organic modifiers utilized were acetonitrile, methanol, n-propanol and tetrahydrofuran. Methanol and tetrahydrofuran, both increased retention time and reduced peak area of TRH. Acetonitrile and n-propanol showed approximately the same result however the peak was more symmetric in case of using n-propanol. So, n-propanol was the organic modifier of choice giving good symmetric and highly sensitive peak within a reasonable time (less than 6 min.).
Flow rate: The effect of flow rate on the formation of the peak of the studied compound was investigated over the range of 0.8-1.2 mL/min. A flow rate of 1 mL/min. was optimal for highest plate count and good peak shape in a reasonable time (Table 1).
The nature of internal standard: Chlorzoxazone with a native fluorescence [36] and being highly hydrophobic that makes it quite similar to the analyzed drug was chosen as an internal standard.
Method validation
Linearity and range: Under the above described experimental conditions, a linear relationship was established by plotting the peak area ratio [drug/I.S.] against the drug concentration in μg/mL. The concentration range was found to be 0.4-8 μg/mL for TRH. Linear regression analysis of the data gave the following equation:
P=0.013+0.992 C (r=0.9999)
Where: P is the peak area ratio, C is the concentration of the drug in μg/mL and r is the correlation coefficient.
Statistical analysis [37] of the data obtained by the proposed method, gave high value of the correlation coefficient (r) of the regression equation. Values of standard deviation of residuals (Sy/x), of intercept (Sa), and of slope (Sb) were low, indicating low scattering of the points around the calibration curve. Table 2 summarizes all values in addition to the values of the percentage relative standard deviation (RSD%) and the percentage relative errors (% Er).
| Parameter | Results |
|---|---|
| Linearity range (µg/mL) | 0.4-8.0 |
| Intercept (a) | 0.013 |
| Slope (b) | 0.992 |
| Correlation coefficient (r) | 0.9999 |
| S.D. of residuals (Sy/x) | 3.77 × 10⁻² |
| S.D. of intercept (Sa) | 2.22 × 10⁻² |
| S.D. of slope (Sb) | 0.52 × 10⁻² |
| Percentage relative standard deviation, % RSD | 1.25 |
| Percentage relative error, %Error | 0.42 |
| Limit of detection, LOD (µg/mL) | 0.07 |
| Limit of quantitation, LOQ (µg/mL) | 0.22 |
Table 2: Analytical performance data for the determination of Terbinafine HCl by the proposed method.
Limit of Quantitation (LOQ) and Limit of Detection (LOD): The limit of quantitation (LOQ) was determined by establishing the lowest concentration that can be measured according to ICH Q2R1 recommendations [38] below which the calibration graph is nonlinear. The limit of detection (LOD) was determined by establishing the minimum level at which the analyte can be reliably detected [37].
LOQ=10Sa/b LOD=3.3Sa/b
Where Sa=Standard deviation of the intercept of the calibration curve; b=Slope of the calibration curve.
LOQ value was found to be 0.22 μg/mL while LOD value was found to be 0.07 μg/mL, respectively as shown in Table 2.
Accuracy and precision: Accuracy of the proposed method was checked by comparing the results of assay of the studied drug with those obtained using the official method [4]. Where, Student's t-test and variance ratio F-test [37] showed no significant difference in performance of the two methods regarding the accuracy and precision, respectively (Table 3).
| Proposed method | Comparison method [4] | ||||||
|---|---|---|---|---|---|---|---|
| Amount taken (µg/mL) |
Amount found (µg/mL) |
% Found | Amount taken (µg/mL) 50 |
Amount found (µg/mL) |
% Found | ||
| 0.4 | 0.39 | 98.45 | 50.0 | 50.68 | 101.36 | ||
| 0.8 | 0.79 | 98.51 | 100.0 | 98.98 | 98.98 | ||
| 1.6 | 1.63 | 101.74 | 200.0 | 200.34 | 100.17 | ||
| 2.4 | 2.43 | 101.35 | |||||
| 3.2 | 3.18 | 99.24 | |||||
| 4.0 | 3.96 | 99.03 | |||||
| 4.8 | 4.84 | 100.86 | |||||
| 6.4 | 6.34 | 99.13 | |||||
| 8.0 | 8.03 | 100.43 | |||||
| Mean ± S.D. | 99.86 ± 1.25 | 100.17 ± 1.19 | |||||
| t-test | 0.38 (2.23) | ||||||
| F-test | 1.10 (19.37) | ||||||
N.B. Each result is the average of three separate determinations; The figures between parentheses are the tabulated t and F values at P=0.05 (37).
Table 3: Assay results for the determination of the studied drug in pure form.
The official method depends on using reversed phase HPLC for determination of TRH in pure form and ion pair Chromatography for determination of TRH in tablets with U.V. detection at 280 and 220 nm respectively [4]. The proposed procedure offers additional advantages over the official one in that the former allow short analysis time of the drug with higher sensitivity, in addition of being extended to the analysis of TRH in human plasma. Moreover, using micellar mobile phase has the advantage of being low toxic due to the small amount of solvent employed, and the omission of preliminary extraction procedure for analysis of human plasma.
Intra-day precision was assessed by analyzing three concentrations and three replicates of each concentration in one day. Also, the interday precision was assessed by analyzing three concentrations and three replicates of each concentration over three successive days. The relative standard deviations were found to be very small indicating reasonable repeatability and intermediate precision of the proposed method (Table 4).
| Parameters | Terbinafine HCl concentration (µg/mL) |
|||
|---|---|---|---|---|
| 0.8 | 1.6 | 2.4 | ||
| Intraday | % Found | 98.51 | 101.74 | 101.35 |
| 99.58 | 101.12 | 98.67 | ||
| 99.72 | 99.86 | 99.15 | ||
 |
99.27 | 100.91 | 99.72 | |
| ± S.D. | 0.66 | 0.96 | 1.43 | |
| %RSD | 0.67 | 0.95 | 1.43 | |
| %Error | 0.39 | 0.55 | 0.83 | |
| Interday | % Found | 98.51 | 101.74 | 101.35 |
| 99.76 | 100.34 | 99.53 | ||
| 97.88 | 101.58 | 98.66 | ||
|
98.71 | 101.22 | 99.85 | |
| ± S.D. | 0.96 | 0.77 | 1.37 | |
| %RSD | 0.97 | 0.76 | 1.38 | |
| %Error | 0.56 | 0.44 | 0.79 | |
Table 4: Precision data for the determination of Terbinafine HCl by the proposed method.
Robustness of the method: The robustness of the proposed method was indicated by the constancy of the peak area ratio with deliberate changes in the experimental parameters. These parameters included n-propanol concentration (10 ± 0.5% (v/v)), SDS concentration (0.15 M ± 0.002) and pH of the mobile phase (5.5 ± 0.5). These minor changes didn’t greatly affect the peak area ratios of TRH.
Selectivity: To check the method selectivity, the interference from common excipients in different formulations was observed carefully through the analysis. It was obvious from the analysis results that these compounds did not affect the results of the proposed method. Additionally, there was not any interference encountered from human plasma matrix although no prior extraction procedure was performed.
Applications
1. Pharmaceutical Application,
2. Dosage Form Analysis.
The proposed method was successfully applied to the analysis of TRH in its different dosage forms. This includes, tablets where he results of applying the proposed method were compared with those obtained using the USP method [4] (Figure 3 and Table 5).
| Parameter | Proposed method | comparison method | ||||
|---|---|---|---|---|---|---|
| Amount taken (µg/mL) |
Amount found (µg/mL) |
% Found | Amount taken (µg/mL) |
Amount found (µg/mL) |
% Found | |
| Lamisil® 250 mg Tablet | 4.8 | 4.93 | 102.65 | 25 | 24.69 | 98.79 |
| 6.4 | 6.41 | 100.08 | 50 | 50.32 | 100.63 | |
| 8.0 | 7.99 | 99.86 | 200 | 204.95 | 102.47 | |
| Mean ± S.D. | 100.86 ± 1.55 | 100.63 ±1.84 | ||||
| t-test | 0.19 | (2.78) | ||||
| F-test | 1.49 | (19.0) | ||||
| Lamisil® 125 mg Tablet | 4.8 | 4.94 | 102.86 | 25 | 25.71 | 102.85 |
| 6.4 | 6.39 | 99.78 | 50 | 50.31 | 100.62 | |
| 8.0 | 8.11 | 101.43 | 200 | 202.76 | 101.38 | |
| Mean ± S.D. | 101.36 ± 1.54 | 101.62 ± 1.13 | ||||
| t-test | (2.78) | |||||
| F-test | (19.0) | |||||
| Lamisil® spray | 4.8 | 4.73 | 98.61 | 0.8 | 0.81 | 101.25 |
| 6.4 | 6.27 | 97.94 | 1.6 | 1.56 | 97.38 | |
| 8.0 | 7.98 | 99.70 | 2.4 | 2.37 | 98.71 | |
| Mean ± S.D. | 98.75 ± 0.89 | 99.11 ± 1.97 | ||||
| t-test | 1.83 | (2.78) | ||||
| F-test | 3.40 | (19.0) | ||||
| Lamisil ®cream | 4.8 | 4.87 | 101.36 | 1 | 0.99 | 99.66 |
| 6.4 | 6.43 | 100.51 | 2 | 1.99 | 99.82 | |
| 8.0 | 8.24 | 102.94 | 4 | 4.04 | 100.89 | |
| Mean ± S.D. | 101.60 ± 1.23 | 100.12 ± 0.67 | ||||
| t-test | 1.83 | (2.78) | ||||
| F-test | 3.40 | (19.0) | ||||
| Lamisil ®gel | 4.8 | 4.86 | 101.28 | 0.8 | 0.81 | 101.13 |
| 6.4 | 6.53 | 101.97 | 1.6 | 1.58 | 98.44 | |
| 8.0 | 8.18 | 102.28 | 2.4 | 2.39 | 99.46 | |
| Mean ± S.D. | 101.84 ± 0.51 | 99.68 ± 1.36 | ||||
| t-test | 2.59 | (2.78) | ||||
| F-test | 7.04 | (19.0) | ||||
N.B. Each result is the average of three separate determinations. *Figures between parentheses are the tabulated t and F values, respectively at p=0.05 (37)
Table 5: Assay results for the determination of Terbinafine HCl in its pharmaceutical formulations.
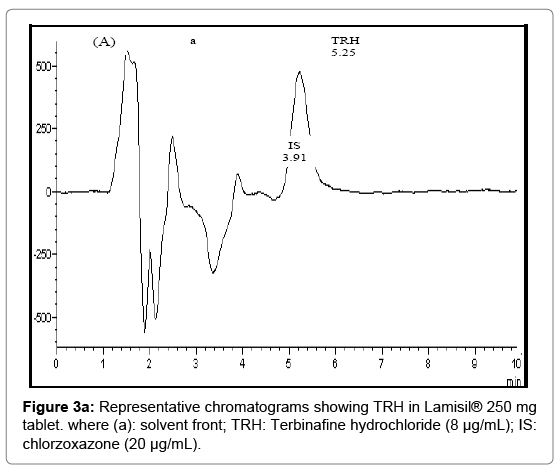
Figure 3a: Representative chromatograms showing TRH in Lamisil® 250 mg tablet. where (a): solvent front; TRH: Terbinafine hydrochloride (8 μg/mL); IS: chlorzoxazone (20 μg/mL).
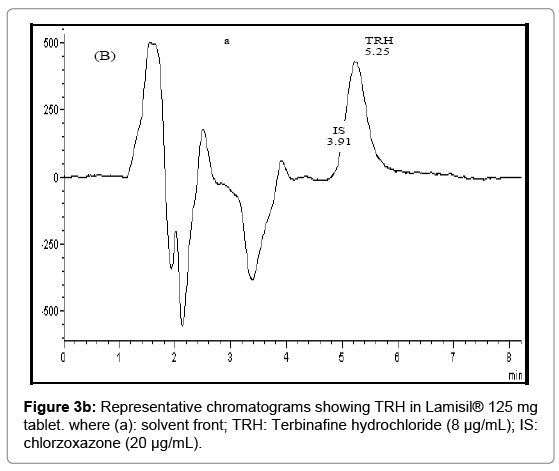
Figure 3b: Representative chromatograms showing TRH in Lamisil® 125 mg tablet. where (a): solvent front; TRH: Terbinafine hydrochloride (8 μg/mL); IS: chlorzoxazone (20 μg/mL).
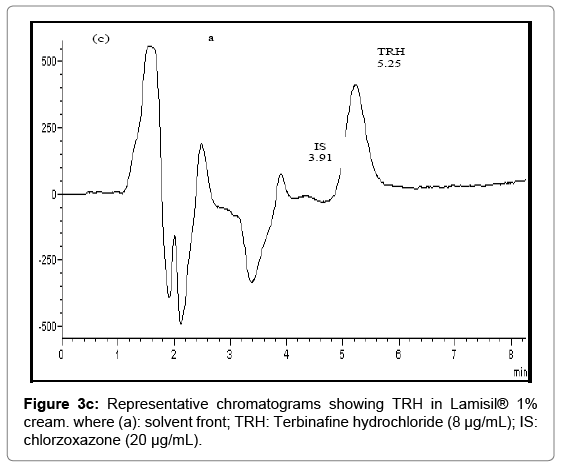
Figure 3c: Representative chromatograms showing TRH in Lamisil® 1% cream. where (a): solvent front; TRH: Terbinafine hydrochloride (8 μg/mL); IS: chlorzoxazone (20 μg/mL)./p>
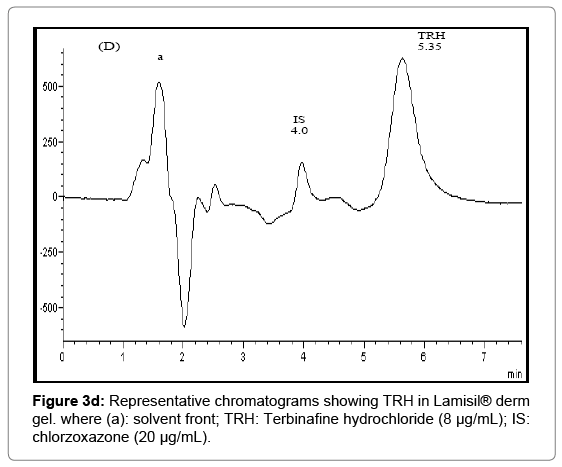
Figure 3d: Representative chromatograms showing TRH in Lamisil® derm gel. where (a): solvent front; TRH: Terbinafine hydrochloride (8 μg/mL); IS: chlorzoxazone (20 μg/mL).
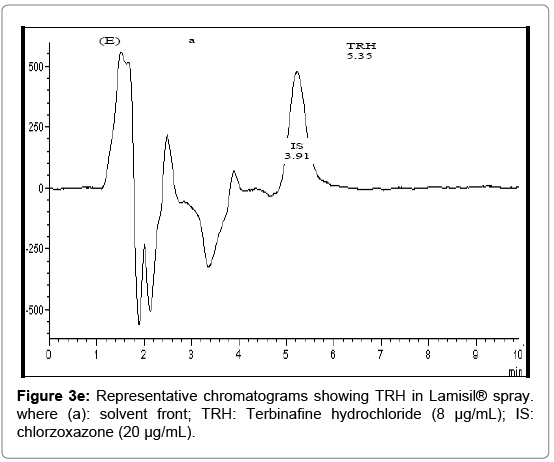
Figure 3e: Representative chromatograms showing TRH in Lamisil® spray. where (a): solvent front; TRH: Terbinafine hydrochloride (8 μg/mL); IS: chlorzoxazone (20 μg/mL).
The proposed method was further also applied to determine TRH in cream, where the results were compared with those obtained using the comparison method [39]. The method was further extended for analysis of TRB in derm gel and spray. There was no reported method for the determination of such dosage forms, hence, The results of the proposed method were compared by using standard addition technique of the same method (Table 5).
Statistical analysis [37] of the results abridged in Table 5. Figure 3 show chromatograms indicating good symmetric peaks of TRH in its different dosage forms.
Application to biological fluid
Terbinafine HCl is well absorbed from the gastrointestinal tract. The bioavailability is about 40% because of first-pass hepatic metabolism. Mean peak plasma concentrations of about 1 μg/mL occur within 2 hours of a single oral dose of 250 mg. Steady state concentrations are about 25% higher than those seen after a single dose and are reached in 10 to 14 days. Terbinafine is extensively bound to plasma proteins [2].
Analysis of spiked human plasma
Figure 4 shows TRH peak obtained from spiked human plasma. Table 6 shows the results obtained from spiked plasma. Under the above described experimental conditions, a linear relationship was established by plotting the peak area ratio (Drug/ IS) against the drug concentration in μg/mL. Linear regression analysis of the data gave the following equation:
| Parameter | Amount taken (µg/mL) |
Amount found (µg/mL) |
% Found |
|---|---|---|---|
|
0.4 | 0.40 | 101.08 |
| 0.8 | 0.79 | 98.43 | |
| 1.0 | 1.01 | 100.86 | |
| 100.12 | |||
| ± SD | ± 1.47 | ||
| % RSD | 1.47 | ||
| % Error | 0.85 |
Table 6: Assay results for the determination of Terbinafine HCl in spiked human plasma using the proposed method.
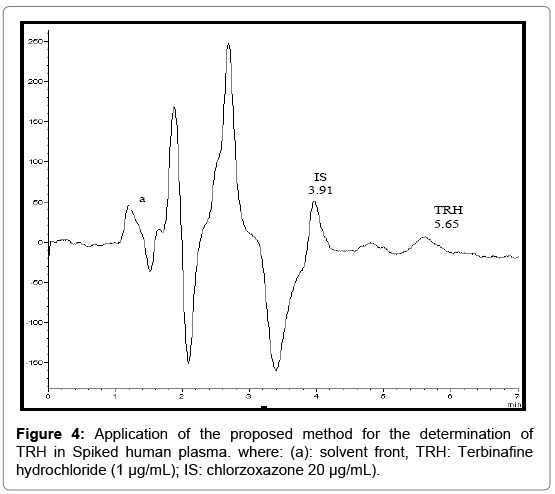
Figure 4: Application of the proposed method for the determination of TRH in Spiked human plasma. where: (a): solvent front, TRH: Terbinafine hydrochloride (1 μg/mL); IS: chlorzoxazone 20 μg/mL).
P=0.132+0.877C (r=0.9993)
Where: P is the peak area ratio, C is the concentration of the drug in μg/mL and r is the correlation coefficient.
The high value of the correlation coefficient (r) indicates the good linearity of the calibration graph constructed in human plasma.
A micellar liquid chromatographic method was developed for the determination of TRH in pure form, different dosage forms and in spiked human plasma as well. The method limit of detection and limit of quantitation were 0.07 μg/ mL and 0.22 μg/mL, respectively. The good validation criteria of the proposed method allow its use in quality control laboratories. The proposed procedure, by virtue of its high sensitivity, could be applied to the analysis of TRH in spiked human plasma without prior extraction procedure.