Journal of Chromatography & Separation Techniques
Open Access
ISSN: 2157-7064
ISSN: 2157-7064
Research Article - (2021)Volume 12, Issue 9
Hydrotrophy is a unique molecular phenomenon that possess the power to extend the solubility of sparingly soluble and poorly soluble drugs in water. A hydrotrophic solution is defined as adding a solute, that is Hydrotrope, (eg: urea, Nicotinamide, Sodium benzoate, Sodium citrate etc.) to the solvent and is used as mobile phase for RP-HPLC. This concept minimizes the use of harmful and costly oragnic solvents to a larger extend which makes drugs analysis ecofriendly and less expensive. The methods was developed using 3% sodium benzoate (pH 5.5) as single mobile phase to review and conclude this subject. Welch ultisil ODS-3(C18) coloumn is used as stationary phase. The flow rate was maintaibed at 1 ml/min and detection was performed at 233 nm using DAD detector. The retension time was 4.5 min and method was detected to be linear over a concentration range of 25-100 microgram/ml with correlation coefficients of 0.9990. The developed method was well validated as per ICH Q2 (R1) guidelines and thereby confirmed that the proposed method can be applied for the routine analysis of furosemide in bulk and other pharmaceutical dosage forms and the objectives of the study are successfully achieved.
Hydrotropy is a concept of accelerating solubility of a solute in water by adding an chemical substance termed as hydrotropes[7-9]. Its reported that Hydrotropic solutions are often used as solvent in spectrophotometry and chromatography for accurate, rapid and precise drug analysis[9-13].In the present study its applying the concept of Hydrotropy in Mobile phase for RP-HPLC and its quite safe, ecofriendly and very costeffective compared to the use of toxic and costly organic solvents as mobile phase[2-5]. Hydrotropes are amphiphilic substances composed of hydrophilic functional group used as a tool for enhancing solubilization of sparingly soluble substances in aqueous solution. Hydrotropes are organic salts which present in aqueous solutions can substantially accelerate and improve the solubility of hydrophobic organic substances within the aqueous phase. Commonly used hydrotropes are hydroxy benzenes, hydroxy benzoates, benzene sulfonates, sodium benzoate,urea and sodium Citrate [15-18].
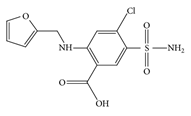
Furosemide, 5-(aminosulfonyl)-4-chloro-2-[(2 furanylmethyl) amino] benzoic acid (fig 1), (FUR) a loop diuretic which is used in the treatment of congestive heart failure and edema (figure 1 ).

Figure 1: Structure of furosemide
The molecular formula of Furosemide is C12H11ClN2O5S. Furosemide acts on thick ascending limb of the loop of Henley leading to a loss of sodium, potassium, and chloride that are discharged in the urine [1].
This results in a decrease in sodium and chloride reabsorption, along with increasing the excretion of potassium in the distal renal tubule.
The diuretic effect of orally administered FUR appears within 30 minutes to 1 hour and is at the peak in the first or
Second hour for the treatment of cardiac diseases, its daily dose is 20–80 mg for adults and for pediatric use this dose is ranged from 1 mg•kg−1 up to a maximum of 40 mg daily [6].
Literature surveys regarding quantitative analysis enlighted that various analytical methods have been reported for the estimation of Furosemide. Many Furosemide quantification methods has been reported using methods like RP-HPLC, UV Spectroscopy & HPTLC from bulk and tablet dosage form [13-15]. No any HPLC method has been reported for the estimation or quantification of Furosemide using concept of hydrotropy. Most of the analytical methods uses organic solvents as mobile phase which are toxic to the environment,harmful to humans, increases pollution and costly. In present study, ecofriendly, safe, cost-effective, sensitive and accurate liquid RP_HPLC method has been developed and validated using 3% sodium benzoate solution ( Hydrotropic solvent ) as mobile phase for the estimation of Furosemide from tablets and other dosage forms.
Instrument
HPLC instrument of Agilent 1220 Infinity make with Diode array Detector (Software: Chem Station, Open LAB Control) and stationary phase Welch ultisil ODS-3(C18)-(250 × 4.6 mm × 5 μm particle size) column was used in the study. All drugs and chemicals were weighed on digital balance (Metter Toledo XPR106DUH Semi micro balance) and pH was measured using digital pH meter (Mettler Toledo SevenCopmpact pH meter S220).Mobile phase and samples were sonicated using Ultrasonicator (EIE Instruments Pvt.Ltd., India).
Reagents and chemicals
Furosemide standard from Indian pharmacopoeia commission ( IPRS )
HPLC grade water (milliQ)
Sodium benzoate Analytical grade from Rankem india.
Methanol (HPLC grade) from Rankem India.
Glacial acetic acid from Rankem India.
Preparation of stock solutions of Furosemide
Furosemide (10 mg) was accurately weighed and transferred to 10 ml volumetric flask. Methanol was added and ultrasonicated to dissolve the drug. Volume was made up to the mark with methanol to make a standard stock solution of concentration 1000 μg/ml. 5 ml of this solution was withdrawn in a 50 ml volumetric flask and volume was made to 50 ml with same methanol to obtain working standard solution of 100 μg/ml.
Method Development and Optimization
The mobile phase concentration and pH influences resolution, selectivity and efficiency of separation. In RP-HPLC, usually the mobile phase consists of toxic, volatile and costlier organic solvents. But here an attempt was made with an ecofriendly, cost effective, non-volatile hydrotopic mobile phase for the estimation of poorly water-soluble drug Furosemide. Selection of mobile phase was carried out by trial and error method. Different concentrations of Sodium benzoate solution with different pH were tried as mobile phase; among them 3% Sodium benzoate solution with pH 5.5 (adjusted with glacial acetic acid) gave sharp peak for Frusemide. Finally, the mobile phase was optimized as 3% Sodium benzoate solution (pH 5.5)
HPLC operating conditions
Column: Welch ultisil ODS-3(C18)- (4.6 x250 mm with 5μm particle size)
Detector: DAD detector
Injectionvolume: 20μl
Flow rate: 1 ml per minute
Temperature: Ambient
Run time: 10 Minutes
Mobile phase: 3% sodium benzoate
Wave length: 233 nm
Preparation of Working Standard Solution
From the standard stock solution of Frusemide (100 μg/ml), accurately pipetted out 1 mL and transferred into a 20 ml standard flask and made up the volume using methanol. The resulting solution contains 5μg/ml of Frusemise, make solutions likewise having concentrations ranging from 25-100μg/ml. 50μg/ml concentration was used for system suitability test(SST) and for the preparation of standard chromatogram for assay.
System Suitability test
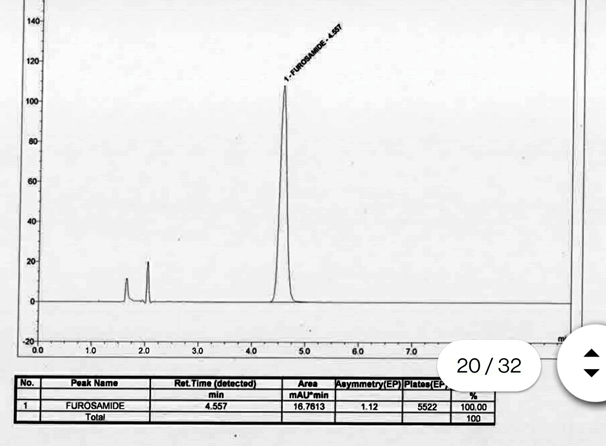
System suitability was performed by injecting Furosemide standard of concentration 50μg/ml. The obtained results confirmed that all the parameters tested were within the acceptable range. Furosemide was repeatedly retained and well separated at 4.5 min. The tailing factor for Furosemide peak never exceeded 1.1 indicating good peak symmetry (acceptance limit is < 2) and the number of theoretical plates were >5000, which ensures good column efficacy throughout the developed separation process.So it is confirmed that the method developed is very suitable and fine to proceed with the method validation .chromatogram of SST is given in fig.2 and data is presented in Table 1.
| Parameter | Result |
|---|---|
| Retension time (min) | 4.557 |
| Theoretical plates (N) | 5470 |
| Tailing factor (T) /Assymetry | 1.1 |
Table 1: SST parameters.

Figure 2: Chromatogram of SST (50ppm)
Method Validation
The proposed method was validated as per ICH guidelines [19].
The parameters studied for validation were, linearity, accuracty, precision, specificity, robustness, ruggedness, limit of detection (LOD) and limit of quantitation (LOQ).
Linearity & Range (Preparation of Calibration Curve)
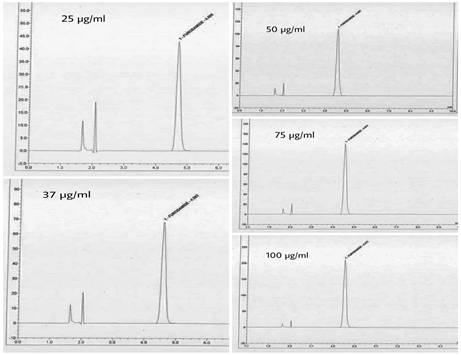
The standard solutions were prepared in a range of 25-100μg/ml. one of each concentration were injected and chromatograms were recorded. Chromatograms showing linearity was given in Fig.3.

Figure 3: Chromatorams showing linearity.
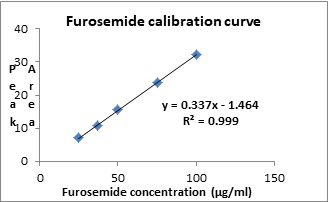
Calibration curve was plotted which is shown in Fig. 4 and data is presented in Table 2.
| Sl No. | Concentration (μg/mL) | Peak area of Frusemide (mAu*min) |
|---|---|---|
| 1 | 25 | 7.2116 |
| 2 | 37 | 10.7153 |
| 3 | 50 | 15.5367 |
| 4 | 75 | 23.7194 |
| 5 | 100 | 32.4113 |
Table 2: Results of linearity study.

Figure 4: Calibration curve of Furosemide.
Accuracy
The accuracy of the method was determined by calculating recovery of Furosemide by method of standard additions. Known amounts of Furosemide (25, 50, 75 μg/ml) standard stock solutions were taken and added to pre-quantified standard sample (50 μg/ml).
Three replicates of each solution was injected into HPLC system and analyzed by the suggested method. The amount of Furosemide was estimated by measuring the areas by fitting these values to the straight-line equations of the calibration curves.
| Spike level | Total amount of drug (μg/ml) | Amount recovered (μg/ml) | %Recovery | Average% recovery |
Standard deviation | % RSD |
|---|---|---|---|---|---|---|
| 74.8 | 99.73 | |||||
| 50% | 75 | 74.6 | 99.46 | 99.59 | 0.1394 | 0.14 |
| 74.7 | 99.6 | |||||
| 99.4 | 99.4 | |||||
| 100% | 100 | 99.5 | 99.5 | 99.53 | 0.1592 | 0.16 |
| 99.7 | 99.7 | |||||
| 124.8 | 99.84 | |||||
| 150% | 125 | 124.7 | 99.76 | 99.73 | 0.1296 | 0.13 |
| 124.5 | 99.6 |
Table 3: Results of accuracy.
Precision
Intra-day precision
Intra- day precision means measurement of the response of 3 concentrations for 3 times in a same day. The method was found to be precise with % RSD 0.39-1.22 according to results shown in table 4. As the % RSD of the Furosemide was less than 2%, it reflects that the developed method is precise.
| Parameters | Concentration | Mean peak area ± SD | RSD |
|---|---|---|---|
| (µg/ml) | (n=3) | ||
| Intra-day precision | 25 | 7.32 ± 0.30 | 1.22 |
| 50 | 15.49 ± 0.62 | 0.67 | |
| 75 | 23.75 ± 1.13 | 0.39 | |
| Inter-day precision | 25 | 7.28 ± 0.22 | 1.19 |
| 50 | 15.66 ± 0.58 | 0.92 | |
| 75 | 23.35 ± 1.24 | 0.18 |
Table 4: Results of precision.
Inter-day Precision
Inter- day precision means measurement of the response of 3 concentrations for 3 consecutive days. The method was found to be precise with % RSD 0.18- 1.19% according to results shown in table 4. As the %RSD of Furosemide was less than 2%, it reflects that the developed method is precise.
Repeatability (System stability study)
Repeatability of sample application was evaluated by analyzing Furosemide (50 μg/ml) six times and peak area was recorded. The percent relative standard deviation (% RSD) of mean peak areas was obtained.table 5.
| Sl No. | Concentration (μg/mL) | Peak area |
|---|---|---|
| 1 | 50 | 15.6367 |
| 2 | 50 | 15.4965 |
| 3 | 50 | 15.6995 |
| 4 | 50 | 15.4369 |
| 5 | 50 | 15.3569 |
| 6 | 50 | 15.2996 |
| Mean | 15.4079 | |
| Standard deviation | 0.1556 | |
| RSD | 1.01 | |
Table 5: Result of repeatability.
Specificity
Specificity is the ability to analyse unequivocally the analyte in the presence of excipients, or impurities which may be expected to be present and causes interfenece . The results shown in table 6 indicate that recovery of drug was above 99% which indicated that developed method is specific.
| Amout of drug taken (µg/ml) | Amount of drug found (µg/ml) (n=3) | %amount of drug found | Mean of % amount of drug found ± SD |
|---|---|---|---|
| 50 | 49.56 | 99.12 | |
| 50 | 49.42 | 98.84 | 99.06 ± 0.53 |
| 50 | 49.61 | 99.22 |
Table 6: Results of specificity
Robustness
Small deliberate changes were introduced in the chromatographic conditions to observe the effect of such changes.
Flow rate and mobile phase composition were changed and the effects on the results were examined.
Robustness of the method was determined at concentration level of 50 μg/ml of Furosemide.
The mean and % RSD values of the peak areas were calculated. The data shown in Table7.
| Parameters | Levels | Retention time (min.) Mean ± SD (n=3) | % RSD |
|---|---|---|---|
| Flow rate (ml/min.) | 0.8 | 4.593 ± 0.1856 | 0.32 |
| 1.2 | 4.315 ± 0.2665 | 0.45 | |
| 5.3 | 4.563 ± 0.1335 | 0.48 | |
| pH | 5.7 | 4.594 ± 0.3556 | 0.52 |
| Concentration | 2 | 4.922 ± 0.1548 | 0.69 |
| of sodiumbenzoate (mobile phase) | 2.5 | 4.783 ± 0.1968 | 0.33 |
| 3.5 | 4.578 ± 0.2367 | 0.19 | |
Table 7: Results of Robestness
Ruggedness
Interday variations were performed by using six replicate injections of sample solutions which were prepared and analysed by different analyst on three different days over a period of one week. Ruggedness also expressed in terms of %RSD and statistical analysis showed no significant difference between results obtained employing different analyst which is presented in Table 8.
| Parameter | Concentration (μg/mL) | Peak area | Mean peak area | Standad Deviation | % RSD |
|---|---|---|---|---|---|
| 50 | 15.4566 | ||||
| Analyst 1 | 50 | 15.3112 | 15.4225 | 0.0987 | 0.64 |
| 50 | 15.4998 | ||||
| 50 | 15.5529 | 15.551 | 0.1041 | 0.67 | |
| Analyst 2 |
Table 8: Results of Ruggedness
Limit of Detection and Quantitation (LOD and LOQ)
The LOD and LOQ were estimated from the set of six calibration curves used to determine the linearity of the developed method. Six calibration curves were drawn for the drugs that come across within its linearity range. From each calibration curve y-intercept and slope were determined and are substituted in the corresponding equation for finding the LOD and LOQ.
LOD = 3.3 (σ/S)
LOQ =10 (σ/S)
Where σ is the standard deviation of the response and ‘S’ is the mean slope of the calibration curve. The LOD and LOQ of Frusemide were 89.306 μg/ml and 270.6260 μg/ml respectively.The data given in table 9.
| Parameters | Result |
|---|---|
| LOD (µg/ml) | 89.306 |
| LOQ (µg/ml) | 270.626 |
Table 9: Results of LOD 7 LOQ
The proposed method well confirms the effect of hydrotropic solution as mobile phase in HPLC, which is quite safe, cost effective and eco-friendly. 3% Sodium benzoate solution was found to be satisfactory in all wise and gives sharp and accurate peaks for Furosemide with retention time of 4.5 minutes. Thus it can be used as a method for analysis of marketed formulations of Furosemide.
| Parameters | Furosemide |
|---|---|
| Absorption maxima (nm) | 276 |
| Retension time (min) | 4.5 |
| Concentration range (μg/ml ) | 25-100 |
| Regression equation (y=mx+c ) | y=0.337x-1.464 |
| Correlation coefficient | 0.999 |
| Specificity | No interference of any peaks |
| Tailing factor | 1.1 |
| Number of Theoretical plates | 5470 |
| Accuracy (% RSD) | |
| 50% | 0.14 |
| 100% | 0.16 |
| 150% | 0.13 |
| LOD (μg/ml) | 89.306 |
| LOQ (μg/ml) | 270.626 |
| Intra-day Presicion(%RSD ) | |
| 1st run | 1.22 |
| 2nd run | 0.67 |
| 3rd run | 0.39 |
| Interday Presicion | |
| Day 1 | 1.49 |
| Day 2 | 0.92 |
| Day 3 | 0.18 |
| Percentage recovery | 99.06 |
| Robustness (%RSD ) | |
| Flow rate | ˂2 |
| Mobile phase composition | ˂2 |
| Ruggedness (%RSD ) | |
| Analyst 1 | 0.64 |
| Analyst 2 | 0.67 |
Table 10: Summary of Results
Analysis of marketed formulation
An aliquot of any furosemide tablet equivalent to 10 mg of standard Furosemide was transferred into a 10 ml volumetric flask and volume was made up to 10 ml with HPLC grade methanol to get 1000 μg/ml. The solution was sonicated for 5 minutes and filtered through whatman filter. Further 1ml aliquot from above solution was transferred in 10 ml volumetric flask and dilutionwas made with methanol to get a solution of 100 μg/ml. A 0.5 ml sample was transferred in 10 ml volumetric flask and diluted with methanol to get the concentration of 5 μg/ml. Solution was injected in a system equilibrated with optimized chromatographic conditions. Peak area and retention time were obtained and quantification was carried out using regression equation.
It may thus concluded that the proposed method of HPLC using hydrotropic solution as mobile phase is a novel, ecofriendly, specific, accurate, precise and robust RP-HPLC method for determination of Furosemide employing the concept of hydrotropy. The reported methods for the estimation of Furosemide use organic solvents which are toxic to the environment and expensive. In developed method hydrotropic solution 3% sodium benzoate solution having pH 5.5 is used as mobile phase which avoids the usage of costlier and corrosive organic solvent as mobile phase. The developed method was validated as per ICH Q2 (R1) guidelines. Detection was performed at 276 nm using diode array detector and retention time of Furosemide was observed to be 4.5 min. Developed method was found to linear over a concentration range of 25 – 100 μg/ml with correlation coefficient 0.999. The developed method can be used for the Analysis of Furosemide formulations.
The study was completely sponsored and done under Indian Pharmacopoeia Commision, Central Drugs Standard Control Organisation (CDSCO), Ministry of Health & Family Welfare, Government of india.
The authors declare to have no conflicts of interests in this research work.
The authors are very thankful to Indian Pharmacopoeia Commission for providing necessary facilities to carry out this research work.
Received: 02-Sep-2021 Accepted: 16-Sep-2021 Published: 23-Sep-2021 , DOI: 10.35248/2157-7064.21.12.450
Copyright: This is an open access article distributed under the terms of the Creative Commons Attribution License, which permits unrestricted use, distribution, and reproduction in any medium, provided the original work is properly cited.