Journal of Chromatography & Separation Techniques
Open Access
ISSN: 2157-7064
ISSN: 2157-7064
Research Article - (2017) Volume 8, Issue 6
In the present study, the partitioning of four model proteins (bovine serum albumin, ovalbumin, α-chymotrypsin and lysozyme) was investigated in polyethylene glycol (PEG)-salt aqueous two-phase systems (ATPS) addressing the effects of PEG molecular weight (MW) and concentration, phase-forming salt type (potassium phosphate/sodium citrate (KPP/NaCit)) and concentration, sodium chloride (NaCl) concentration and pH, as well as MW, isoelectric point, charge and hydrophobicity of the proteins. It was found that protein partitioning was influenced by different coexisting effects, such as hydrophobic and electrostatic interactions, related to the system parameters and physicochemical/surface properties of proteins. Moreover, a rigorous analysis and optimization of the significant forces for protein partitioning in PEG-salt ATPS was performed by design of experiments (DoE). Initially, KPP/NaCit, NaCl and PEG concentrations were considered as statistically significant factors by a fractional factorial design. Subsequently, the optimal values of the significant factors were determined by a central composite face-centered design coupled with response surface methodology. Furthermore, linear and quadratic models were obtained in the experimental designs, respectively, and evaluated by statistical regression analysis and analysis of variance. Finally, a validation of the quadratic model confirmed a good correlation between predicted and experimental results, thus verifying the validity of the model.
Keywords: Aqueous two-phase systems; Bioseparation; Liquidliquid extraction; Protein partitioning; Design of experiments
ATPS: Aqueous two-phase systems; PEG: Polyethylene glycol; MW: Molecular weight; pI: Isoelectric point; DoE: Design of experiments; BSA: Bovine serum albumin; OVA: Ovalbumin; α-CT: α-chymotrypsin; LYZ: Lysozyme; KPP: Potassium phosphate; NaCit: Sodium citrate; fFD: Fractional factorial design; CCF: Central composite face-centered; RSM: Response surface methodology; ANOVA: Analysis of variance; K: Partition coefficient of proteins; YTP (%): Yield/recovery yield of proteins in the top phase; YBP (%): Yield/recovery yield of proteins in the bottom phase; BCA: Bicinchoninic acid; F-test: Fisher's statistical test; p-value: Probability value; SOR: Significance of regression; LOF: Lack-of-fit; R2: Coefficient of determination; R2adj: Adjusted coefficient of determination; Q2: Coefficient of predicted variation; PDB: Protein Data Bank.
Aqueous two-phase systems (ATPS) are generally obtained by mixing either two incompatible hydrophilic polymers (e.g., polyethylene glycol (PEG), dextran), or a polymer and a salt (e.g., phosphate, citrate) beyond a critical concentration in water, leading to the formation of two coexisting immiscible aqueous phases. Both liquid phases are composed predominantly of water, and each phase-forming constituent is enriched in one of the phases. ATPS provide several advantages over conventional downstream processing techniques for separation, recovery and purification of biomolecules, such as biocompatibility, technical simplicity, high capacity, as well as easy scalability. Considering these advantages, ATPS have been used since the mid-1950s as a mild liquid-liquid extraction and bio separation technology of wide applicability in biotechnology, biochemistry, and cell biology, such as large-scale separation, partial purification or primary recovery of various biological products like proteins, enzymes and nucleic acids [1-4]. Among all systems suitable for bio separation, PEG-salt ATPS have been used predominantly concerning the low-cost of the phase-forming constituents, low viscosity and short separation time [1,5].
In spite of the versatile advantages, the application of PEG-salt ATPS has been limited through an inadequate understanding of the mechanism governing the partitioning behavior of biomolecules in ATPS, which is largely empirical, and thus not easily predictable owing to the thermodynamic complexity and influence of various system parameters (e.g., PEG molecular weight (MW) and concentration, phase-forming salt type and concentration, NaCl (additive, neutral salt) concentration, pH) and physicochemical/surface properties of the target biomolecules (e.g., MW, isoelectric point (pI), charge and hydrophobicity), as well as their interactions with the system parameters [1,6-9]. In this context, the partitioning of biomolecules between two aqueous phases is a complex phenomenon according to the interactions between the partitioned biomaterial with the surrounding molecules of the phase-forming constituents, including hydrogen bonds, hydrophobic and ionic/electrostatic interactions, together with van der Waals forces, and other non-covalent interactions, as well as conformational and steric effects, etc. [1,10-12]. Due to the complex dependency of system parameters and biomolecule properties, as well as the resulting empirical, complex, not predictable partitioning mechanism, many laborious and time-consuming experiments have to be carried out for an evaluation and optimization of biomolecule partitioning in PEG-salt ATPS, causing increased overall costs [13]. Nowadays, the multivariate statistical design of experiments (DoE) approach has emerged as a promising, efficient optimization tool for partitioning processes of biomolecules in PEG-salt ATPS, allowing a fast, simultaneous, rigorous and cost-effective evaluation and optimization of system parameters or significant factors on selected response variables and their possible interactions by mathematical models, thus overcoming the limitations of conventional optimization methods [13-17]. Although, several studies have been conducted in the recent years regarding phase formation and characterization of PEGsalt ATPS, as well as biomolecule (e.g., protein) partitioning in PEG-salt ATPS [10,17-22], no exhaustive, systematic study has been available so far encompassing all issues highlighted here.
In the present study, the partitioning of four model proteins: bovine serum albumin (BSA), ovalbumin (OVA), α-chymotrypsin (α-CT) and lysozyme (LYZ) was investigated in several PEG-salt ATPS. In this context, the effect of various system parameters: PEG MW (2,000-8,000 g/mol), PEG concentration (12-18 wt.%), phase-forming salt type: potassium phosphate (KPP) or sodium citrate (NaCit), phase-forming salt concentration (10-16 wt.%), NaCl concentration (0-6 wt.%) and pH (5-9) on the partitioning behavior of each model protein was studied in PEG-salt ATPS at a constant protein concentration (0.1 wt.%) and temperature (23°C) by taking different physicochemical/surface properties of the model proteins (MW, pI, charge and hydrophobicity) into consideration. Furthermore, the partitioning behavior of the model proteins in PEG-salt ATPS was systematically investigated by two DoE approaches including a factorial and response surface design. Thereby, the significant factors or main driving forces for protein partitioning were initially determined in screening experiments using a fractional factorial design (fFD). Afterwards, a central composite facecentered (CCF) design coupled with response surface methodology (RSM) was used in order to optimize the operating conditions for a maximum partitioning and recovery of each model protein in PEG-salt ATPS. Furthermore, linear and quadratic models were obtained in the experimental designs, respectively, which were evaluated by statistical regression analysis and analysis of variance (ANOVA). Additionally, the experimental results of the CCF design were analyzed graphically by using contour plots in order to determine the optimal values of the significant factors. Finally, the quadratic model was validated by additional experiments using the optimal values of the significant factors determined by RSM.
The aim of this study is to investigate the feasibility of several PEG-salt ATPS for partitioning of different model proteins, evaluate the influence of various system parameters and their interactions on the partition of the proteins, as well as identify the significant factors or main driving forces which govern protein partitioning, and finally optimize the partitioning behavior of each model protein in the investigated PEG-salt ATPS.
Materials
Polyethylene glycol (PEG) with an average molecular weight of 2,000 g/mol (PEG 2000) was purchased from Carl Roth GmbH & Co. KG (Germany). PEG with average molecular weights of 4,000, 6,000 and 8,000 g/mol (PEG 4000, 6000 and 8000) were obtained from Sigma- Aldrich (Germany). Potassium dihydrogen phosphate (KH2PO4), dipotassium hydrogen phosphate (KH2PO4), citric acid monohydrate (C6H6O7 ⋅ H2O), tri-sodium citrate dihydrate (C6H5Na3O7 ⋅ 2H2O) and sodium chloride (NaCl) were supplied by Carl Roth GmbH & Co. KG (Germany). Bovine serum albumin (BSA), ovalbumin (OVA) from chicken egg, α-chymotrypsin (α-CT) from bovine pancreas and lysozyme (LYZ) from chicken egg white were purchased from Sigma Aldrich (Germany). All reagents were of analytical grade and therefore used as received, without further purification. Furthermore, pure, deionized water was used throughout this study which was prepared by Arium 611 from Sartorius Stedim Biotech (Germany).
Preparation of PEG-salt ATPS
PEG-salt ATPS were prepared on the basis of binodal curves according to [18] by weighing the appropriate amounts of system components from stock solutions of PEG (50 wt.%), potassium phosphate (KPP) or sodium citrate (NaCit) buffer (40 wt.%), NaCl (25 wt.%), BSA, OVA, α-CT or LYZ (2 wt.%) and pure, deionized water to a final weight of 10 g. Phosphate/citrate stock solutions were composed of a mixture of KH2PO4 and K2HPO4 or C6H8O7 ⋅ H2O and C6H5Na3O7 ⋅ 2 H2O at appropriate pH (6, 7, 8 and 9 or 5, 6, 7 and 8) values, respectively. The desired pH values of buffer solutions were obtained by changing the ratio of corresponding mono- and dibasic salts. All studied PEGsalt ATPS were prepared in 15 mL tubes at 23°C comprising different PEG MWs (2,000-8,000 g/mol), PEG concentrations (12-20 wt.%), KPP/NaCit concentrations (10-18 wt.%), NaCl concentrations (0-6 wt.%) and pH values (pH 5-9), as well as a constant BSA, OVA, α-CT or LYZ concentration (0.1 wt.%). All system components were vortexed and thoroughly mixed with a rotator-mixer (Multi Bio RS- 24, Biosan, Latvia) for 15 min at 100 rpm. Subsequently, the samples were centrifuged at 4,000g and 4°C for 15 min (Heraeus Multifuge X1R, Thermo Fisher Scientific, Germany), accelerating two-phase formation. The systems were allowed to settle down for about 24 h at 23°C in a water bath to ensure complete thermodynamic equilibrium, indicated by the absence of turbidity in each phase. After achieving phase equilibrium, the phases were carefully separated by using a pipette. Finally, the volumes of top and bottom phases were determined and samples from both phases were taken for protein concentration analysis.
Determination of protein concentration
Initially, the samples were conveniently diluted prior to protein determination according to [23] in order to avoid interferences of the phase-forming components. Subsequently, the protein concentration was photometrically quantified using the bicinchoninic acid (BCA) assay [24] at 562 nm according to the microplate test of the BCA Protein Assay Kit from Thermo Fisher Scientific (Germany), as reported previously [23]. All measurements were performed in triplicate, and the average results are reported.
Determination of partitioning parameters
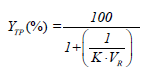
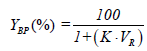
The partitioning behavior of proteins in PEG-salt ATPS was evaluated by different parameters, including the partition coefficient of proteins, K, as well as the yield or recovery yield of proteins in the top or bottom phase, YTP (%) or YBP (%), respectively, which were calculated according to equations 1-3.
 (1)
(1)
 (2)
(2)
 (3)
(3)
Here, CTP and CBP are the protein concentrations (mg/mL) in the top and bottom phases, respectively, while VR corresponds to the volume ratio between the top and bottom phase volumes (VR=VTP/VBP).
Preliminary partitioning experiments
In preliminary experiments, the effect of increasing PEG MW (2,000-8,000 g/mol, at pH 7, 16 wt.% PEG, 14 wt.% KPP/NaCit and 2 wt.% NaCl), PEG concentration (12–18 wt.% at pH 7, PEG 6000, 14 wt.% KPP/NaCit and 2 wt.% NaCl), phase-forming salt type (KPP/ NaCit), KPP/NaCit concentration (10-16 wt.% at pH 7, 16 wt.% PEG 6000 and 2 wt.% NaCl), NaCl (additive, neutral salt) concentration (0-6 wt.% at pH 7, 16 wt.% PEG 6000 and 14 wt.% KPP/NaCit) and pH (5-9 at 16 wt.% PEG 6000, 14 wt.% KPP/NaCit and 2 wt.% NaCl) on the partitioning behavior or K of four model proteins (BSA, OVA, α-CT and LYZ) was investigated in several PEG-salt ATPS at constant protein concentration (0.1 wt.%) and temperature (23°C) by considering different physicochemical/surface properties of the model proteins (MW, pI, charge and hydrophobicity). Overall, these experiments provide fundamental results for a subsequent application of two DoE approaches outlined separately ahead [25,26].
Experimental design and statistical regression analysis
The significant factors for protein partitioning were determined in screening experiments using a 25-1 fractional factorial design (fFD) considering the influence of five factors (independent variables): PEG MW (X1), PEG concentration (X2, wt.%), phase-forming KPP/NaCit concentration (X3, wt.%), NaCl concentration (X4, wt.%), pH (X5) and their interactions, while K, YTP (%) or YBP (%) were selected as the responses (dependent response variables) in all experimental designs involved in this study. The 25-1 fFD was augmented with a center-point (Table 1), which was run in triplicate in order to provide an evaluation of the pure experimental error [27,28]. Furthermore, the range and all three factors levels of this design (Table 1): low (coded value: -1), center (coded value: 0) and high (coded value: +1) level were selected on the basis of the preliminary partitioning experiments, as well as previously obtained binodal curves according to [18]. Overall, the fFD was composed of a design matrix covering 19 screening experiments for each model protein run in random order, as summarized exemplarily for BSA/LYZ in Table 2 including the uncoded values of the factors and the corresponding experimental results, as well as in the Supplementary Data Table S1 for OVA/α-CT, respectively [29].
| Factors (independent variables) | Range and levels | ||
|---|---|---|---|
| Low (-1) | Center (0) | High (+1) | |
| PEG MW (X1) | 4000 | 6000 | 8000 |
| PEG concentration (X2, wt.%) | 14 | 16 | 18 |
| KPP/NaCit concentration (X3, wt. %) | 12 | 14 | 16 |
| NaCl concentration (X4, wt. %) | 0 | 2 | 4 |
| pH (X5) | 6 | 7 | 8 |
Table 1: Range and levels of factors (independent variables) used in the 25-1 fFD.
| Run | X1 | X2 | X3 | X4 | X5 | KBSA | KLYZ | YBP-BSA (%) | YTP-LYZ(%) |
|---|---|---|---|---|---|---|---|---|---|
| 01 | 4000 | 14 | 12 | 4 | 6 | 0.62 | 1.54 | 48.58 | 69.84 |
| 02 | 4000 | 18 | 16 | 0 | 8 | 0.41 | 1.81 | 62.28 | 84.26 |
| 03 | 4000 | 18 | 12 | 4 | 8 | 0.35 | 1.82 | 68.43 | 82.72 |
| 04 | 8000 | 18 | 12 | 4 | 6 | 0.27 | 2.04 | 75.65 | 93.84 |
| 05 | 8000 | 14 | 16 | 0 | 8 | 0.52 | 1.81 | 53.89 | 82.26 |
| 06 | 6000 | 16 | 14 | 2 | 7 | 0.41 | 1.73 | 63.02 | 79.58 |
| 07 | 4000 | 14 | 16 | 0 | 6 | 0.46 | 1.72 | 58.51 | 78.12 |
| 08 | 4000 | 18 | 16 | 4 | 6 | 0.66 | 2.06 | 40.47 | 94.76 |
| 09 | 8000 | 18 | 16 | 0 | 6 | 0.47 | 1.82 | 56.61 | 81.93 |
| 10 | 8000 | 18 | 16 | 4 | 8 | 0.47 | 2.14 | 57.56 | 98.44 |
| 11 | 4000 | 14 | 16 | 4 | 8 | 0.66 | 1.82 | 40.52 | 82.72 |
| 12 | 6000 | 16 | 14 | 2 | 7 | 0.43 | 1.76 | 61.21 | 80.96 |
| 13 | 8000 | 14 | 12 | 0 | 6 | 0.26 | 1.41 | 75.82 | 63.86 |
| 14 | 4000 | 18 | 12 | 0 | 6 | 0.25 | 1.61 | 77.45 | 74.06 |
| 15 | 6000 | 16 | 14 | 2 | 7 | 0.38 | 1.71 | 65.72 | 77.66 |
| 16 | 8000 | 14 | 16 | 4 | 6 | 0.61 | 2.08 | 44.98 | 95.68 |
| 17 | 4000 | 14 | 12 | 0 | 8 | 0.26 | 1.57 | 76.55 | 71.22 |
| 18 | 8000 | 18 | 12 | 0 | 8 | 0.21 | 1.45 | 81.06 | 66.71 |
| 19 | 8000 | 14 | 12 | 4 | 8 | 0.46 | 1.67 | 57.68 | 75.82 |
X1: PEG MW; X2: PEG concentration (wt.%); X3: KPP/NaCit concentration (wt.%); X4: NaCl concentration (wt.%); X5: pH. BSA/LYZ concentration is fixed to 0.1 wt.%
Table 2: Design matrix of the 25-1 fFD and corresponding results for BSA and LYZ.
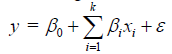
Moreover, a linear/first-order regression model was obtained by the factorial design in the screening experiments according to equation 4.
Moreover, a linear/first-order regression model was obtained by the factorial design in the screening experiments according to equation 4.
 (4)
(4)
Here, y is the predicted response variable, while β0 and βi are the regression coefficients of the model. Furthermore, xi is a variable representing an experimental factor and ε is a random error.
On the basis of the first-order model (equation 4) obtained by the 25-1 fFD, a new series of experiments was carried out in the direction of steepest ascent/descent in order to improve the output response variables and determine the next set of experiments, respectively, thus reaching the vicinity of the optimal experimental region and investigate the experimental direction [13,16,17]. The path of steepest ascent/descent was initially performed at the center-point of the significant factors and each factor level was increased or decreased according to the magnitude of the main effects [13,17], as listed exemplarily for BSA/ LYZ in Table 3 as well as in the Supplementary Data Table S2 for OVA/ α-CT covering the uncoded values of the factors and the corresponding experimental results, respectively.
| Run | X1 | X2 | X3 | KBSA | YBP-BSA (%) | Run | X1 | X2 | X3 | KLYZ | YTP-LYZ(%) |
|---|---|---|---|---|---|---|---|---|---|---|---|
| 01 | 16.0 | 14.0 | 2.0 | 0.39 | 64.82 | 01 | 16.0 | 14.0 | 2.0 | 1.69 | 66.18 |
| 02 | 16.4 | 13.6 | 1.8 | 0.36 | 71.58 | 02 | 16.4 | 14.4 | 2.4 | 1.82 | 68.75 |
| 03 | 16.8 | 13.2 | 1.6 | 0.33 | 78.32 | 03 | 16.8 | 14.8 | 2.8 | 1.87 | 70.68 |
| 04 | 17.2 | 12.8 | 1.4 | 0.29 | 85.09 | 04 | 17.2 | 15.2 | 3.2 | 1.94 | 74.46 |
| 05 | 17.6 | 12.4 | 1.2 | 0.25 | 88.75 | 05 | 17.6 | 15.6 | 3.6 | 2.01 | 77.24 |
| 06 | 18.0 | 12.0 | 1.0 | 0.21 | 91.81 | 06 | 18.0 | 16.0 | 4.0 | 2.15 | 81.73 |
| 07 | 18.4 | 11.6 | 0.8 | 0.27 | 86.15 | 07 | 18.4 | 16.4 | 4.4 | 2.03 | 79.45 |
| 08 | 18.8 | 11.2 | 0.6 | 0.32 | 81.64 | 08 | 18.8 | 16.8 | 4.8 | 1.96 | 75.32 |
| 09 | 19.2 | 10.8 | 0.4 | 0.38 | 68.53 | 09 | 19.2 | 17.2 | 5.2 | 1.92 | 72.81 |
| 10 | 19.6 | 10.4 | 0.2 | 0.42 | 62.36 | 10 | 19.6 | 17.6 | 5.6 | 1.84 | 69.54 |
X1: PEG concentration (wt.%); X2: KPP/NaCit concentration (wt.%); X3: NaCl concentration (wt.%). BSA/LYZ concentration is fixed to 0.1 wt.%. Furthermore, PEG MW and pH are fixed to PEG 6000 and pH 7, respectively.
While the factor levels in run 01 were used as the center-points in screening experiments, the factor levels shown in bold (run 06) were chosen as the new center-points for subsequent optimization experiments of BSA and LYZ, respectively.
Table 3: Experimental design of the steepest ascent/descent and corresponding results for BSA and LYZ.
Subsequently, PEG concentration (X1, wt.%), phase-forming KPP/ NaCit concentration (X2, wt.%) and NaCl concentration (X3, wt.%) were optimized by the response surface methodology (RSM) using a 23 central composite face-centered (CCF) design in order to improve the response variables, K and YTP (%) or YBP (%), and determine the optimal operating conditions for the partitioning of each model protein in PEGsalt ATPS. In order to evaluate and vary the three factors, the 23 CCF design was augmented with three replicated center-points (Table 4) and comprised a range and three factor levels (Table 4) on the basis of the preliminary obtained experimental results and previously determined phase diagrams [18].
| Factors (independent variables) | Range and levels for BSA and OVA | ||
|---|---|---|---|
| Low (-1) | Center (0) | High (+1) | |
| PEG concentration (X1, wt.%) | 16 | 18 | 20 |
| KPP concentration (X2, wt.%) | 10 | 12 | 14 |
| NaCl concentration (X3, wt.%) | 0 | 1 | 2 |
| Factors (independent variables) | Range and levels for LYZ and α-CT | ||
| Low (-1) | Center (0) | High (+1) | |
| PEG concentration (X1, wt.%) | 16 | 18 | 20 |
| NaCit concentration (X2, wt.%) | 14 | 16 | 18 |
| NaCl concentration (X3, wt.%) | 2 | 4 | 6 |
Table 4: Range and levels of factors (independent variables) used in the 23 CCF design.
Overall, the CCF design was comprised of a design matrix containing 17 optimization experiments for each model protein run in random order, as shown exemplarily for BSA/LYZ in Table 5 including the uncoded values of the factors and the corresponding experimental results, as well as in the Supplementary Data Table S3 for OVA/α-CT, respectively.
| Run | X1 | X2 | X3 | KBSA | YBP-BSA (%) | Run | X1 | X2 | X3 | KLYZ | YTP-LYZ(%) |
|---|---|---|---|---|---|---|---|---|---|---|---|
| 01 | 18 | 12 | 2 | 0.29 | 88.69 | 01 | 18 | 16 | 6 | 2.26 | 81.41 |
| 02 | 16 | 14 | 2 | 0.55 | 78.96 | 02 | 16 | 18 | 6 | 2.33 | 82.72 |
| 03 | 16 | 12 | 1 | 0.36 | 85.96 | 03 | 16 | 16 | 4 | 2.14 | 76.17 |
| 04 | 16 | 14 | 0 | 0.49 | 81.26 | 04 | 16 | 18 | 2 | 2.52 | 88.70 |
| 05 | 18 | 12 | 1 | 0.22 | 91.42 | 05 | 18 | 16 | 4 | 2.14 | 75.31 |
| 06 | 18 | 14 | 1 | 0.33 | 87.38 | 06 | 18 | 18 | 4 | 2.33 | 82.19 |
| 07 | 20 | 10 | 2 | 0.31 | 88.14 | 07 | 20 | 14 | 6 | 2.61 | 95.20 |
| 08 | 18 | 10 | 1 | 0.24 | 90.64 | 08 | 18 | 14 | 4 | 2.12 | 74.93 |
| 09 | 16 | 10 | 0 | 0.33 | 87.13 | 09 | 16 | 14 | 2 | 2.18 | 76.84 |
| 10 | 18 | 12 | 1 | 0.20 | 92.17 | 10 | 18 | 16 | 4 | 2.10 | 73.78 |
| 11 | 20 | 10 | 0 | 0.21 | 91.55 | 11 | 20 | 14 | 2 | 2.19 | 77.22 |
| 12 | 20 | 12 | 1 | 0.20 | 91.95 | 12 | 20 | 16 | 4 | 2.38 | 84.11 |
| 13 | 20 | 14 | 0 | 0.44 | 83.17 | 13 | 20 | 18 | 2 | 2.58 | 92.34 |
| 14 | 18 | 12 | 1 | 0.24 | 90.64 | 14 | 18 | 16 | 4 | 2.17 | 76.07 |
| 15 | 20 | 14 | 2 | 0.25 | 83.17 | 15 | 20 | 18 | 6 | 2.62 | 94.96 |
| 16 | 18 | 12 | 0 | 0.22 | 91.59 | 16 | 18 | 16 | 2 | 2.08 | 73.78 |
| 17 | 16 | 10 | 2 | 0.55 | 78.55 | 17 | 16 | 14 | 6 | 2.29 | 81.04 |
X1: PEG concentration (wt.%); X2: KPP/NaCit concentration (wt.%); X3: NaCl concentration (wt.%). BSA/LYZ concentration is fixed to 0.1 wt.%. Furthermore, PEG MW and pH are fixed to PEG 6000 and pH 7, respectively.
Table 5: Design matrices of the 23 CCF design and corresponding results for BSA and LYZ.
Moreover, a quadratic/second-order polynomial regression model was obtained by the response surface design in the optimization experiments according to equation 5.
 (5)
(5)
Here, y is the predicted response variable, β0, βi, βii and βij are the regression coefficients of the intercept, linear, quadratic and interaction (i ≠ j) effects, respectively, while xi and xj are independent variables, and ε is a random error.
Overall, the data obtained from both experimental designs were analyzed by the developed linear and quadratic models, respectively. Thereby, the statistical significance of each model, as well as the magnitude of the main effects of each factor and all their possible linear and quadratic interactions on the response variables were evaluated by the analysis of variance (ANOVA) using Fisher's statistical test (F-test) and standard least squares techniques or multiple linear regression analysis at 95% confidence level. Hence, all effects or parameters with less than 95% significance and a corresponding probability of error or probability value (p-value) higher than 0.05 (p>0.05) were considered as non-significant and excluded or added into the residual error term, and a new ANOVA was performed for the complete and reduced model [30-34].
Moreover, the statistical significance of the obtained models and excluded parameters was examined by the F-test consisting of two parts [15]. Thereby, the first F-test (significance of regression (SOR) test), was fulfilled according to p<0.05, while the second test, also known as the lack-of-fit (LOF) test, was fulfilled according to p>0.05 [15,25]. However, if one of these conditions was not fulfilled by a given model, the model was only accepted when the coefficient of determination (R2) was higher than 0.95 (R2>0.95) meaning that more than 95% of the data were “explained” by the model [20,22]. Furthermore, the adjusted coefficient of determination (R2adj) was employed as a more useful goodness-of-fit-parameter, since R2 is normally decreased through model revision when less useful model terms are removed, whereas R2adj should substantially remain unchanged [15], and models were accepted when R2adj>0.95. Moreover, the coefficient of predicted variation (Q2) was used as a third and primary attractive parameter in regression analysis in order to evaluate the predictive power of a model [15]. Thereby, the value of Q2 should normally increase, even though irrelevant model terms are excluded from the model, thus, confirming an appropriateness of a model revision [15].
Additionally, the obtained quadratic model (equation 5) was analyzed graphically by using contour plots in order to evaluate and obtain the optimal values of the significant factors for maximum response variables. All statistical regression and graphical analyses were carried out by the DoE software MODDE 9.1 from Umetrics AB (Umea, Sweden). Finally, the quadratic model was validated. For this purpose, additional experiments were performed in triplicate by using the optimal values or levels of the significant factors determined by RSM.
Protein characterization and partitioning in PEG-salt ATPS
The potential driving forces for protein partitioning were systematically studied by means of the partition of four model proteins (BSA, OVA, α-CT and LYZ) in several PEG-salt ATPS considering the effect of the previously mentioned system parameters and physicochemical/surface properties of the model proteins in order to relate the observed tendencies with the features of the proteins and the systems themselves. These model proteins were chosen on the basis of commercial availability, solubility and a wide range of physicochemical/ surface properties (Table 6).
| Model Protein | Biological source | PDB code | MW [kDa] | pI | Surface chargea [%] | Surface hydrophobicityb [%] |
|---|---|---|---|---|---|---|
| BSA | Bovine serum | 3V03 | 66.426 | 4.7–4.927,28 | 57 | 9 |
| OVA | Chicken egg white | 1OVA | 42.729 | 4.5430 | 47 | 11 |
| α-CT | Bovine pancreas | 4CHA | 2531 | 8.7532 | 29 | 15 |
| LYZ | Chicken egg white | 1DPX | 14.333 | 11.3534 | 23 | 20 |
aSurface charge: percentage of atoms on the surface belonging to acidic and basic residues (determined by RasMol Software); bSurface hydrophobicity: percentage of atoms on the surface belonging to hydrophobic residues (determined by RasMol Software)
Table 6: Physicochemical/surface properties of four investigated model proteins.
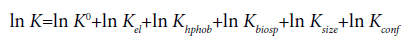
Moreover, since the exposed surface groups of proteins interact with the phase-forming components, partitioning in ATPS is a surfacedependent phenomenon [1]. The larger the protein size, the larger the exposed protein surface which can interact with the surrounding phaseforming components [20]. Overall, protein partitioning is a function of different interacting protein properties and can be expressed in several logarithmic terms by equation 6 according to Albertsson [1], where each term is contributing to the partition coefficient K:
 (6)
(6)
Here, each term or subscript el, hphob, biosp, size and conf denotes the electrochemical, hydrophobic, biospecific, size-dependent and conformational contributions to K, respectively, while K0 includes other factors like the system parameters mentioned above.
Since protein partitioning in PEG-salt ATPS is depending on the protein surface, and consequently protein structure, the threedimensional structures of the four studied model proteins have been investigated using a program for molecular graphics visualization, RasMol [35,36]. Structure data files were downloaded from the RCSB Protein Data Bank (PDB) website (http://www.rcsb.org/pdb) [37], viz., 3V03 [38] for BSA, 1OVA [39] for OVA, 4CHA [40] for α-CT and 1DPX [41] for LYZ. Thereby, the surface hydrophobicity of each model protein was evaluated by determining the percentage of atoms on the surface belonging to hydrophobic residues, while the surface charge of each protein was estimated by determining the percentage of atoms on the surface belonging to acidic or basic residues (Table 6). For both determinations RasMol software was used. According to Table 6, α-CT/ LYZ are more hydrophobic than BSA/OVA which tend to be more hydrophilic. Thereby, LYZ is the most hydrophobic protein in this study, while BSA is the most hydrophilic one. Moreover, since BSA is also the largest protein, its hydrophilic character is even more pronounced. Furthermore, α-CT/LYZ contain much less atoms on the surface belonging to acidic or basic residues than BSA/OVA (Table 6). Hence, hydrophobic interactions will probably play a more important role than electrostatic interactions in the partitioning of α-CT/LYZ in comparison to BSA/OVA.
Factors affecting protein partitioning
Preliminary studies performed with pure protein systems showed that varied PEG MW and concentration, phase-forming salt type (KPP/NaCit) and concentration, as well as NaCl (additive, neutral salt) concentration and pH had a particular influence on the partitioning behavior of BSA, OVA, α-CT and LYZ in different PEG-salt ATPS according to the physicochemical/surface properties of the model proteins, as discussed separately ahead. For instance, the partitioning behavior of the four investigated model proteins (0.1 wt.% BSA, OVA, α-CT and LYZ) in PEG 6000-KPP/NaCit ATPS at pH 7, 23°C and a fixed concentration of each system component (16 wt.% PEG 6000, 14 wt.% KPP/NaCit, 2 wt.% NaCl) is illustrated in Figure 1. As depicted in this figure, BSA/OVA are predominantly partitioned into the saltrich bottom phase (K<1), while a distribution of α-CT/LYZ is favored into the PEG-rich top phase (K>1). The lower or higher the value of K, the more pronounced is the partition of BSA/OVA into the bottom phase or α-CT/LYZ into the top phase, respectively. Furthermore, the larger the value of K, the smaller is the protein size or MW and surface charge, as well as the larger is the pI and surface hydrophobicity of the model proteins (Table 6). Hence, K is ranked in the following order: K (BSA)

Figure 1: Partitioning behavior (K) of four model proteins (0.1 wt.% BSA/ OVA/α-CT/LYZ) in PEG 6000-KPP/NaCit ATPS at pH 7, 23°C and a fixed concentration of each system component (16 wt.% PEG 6000, 14 wt.% KPP/ NaCit, 2 wt.% NaCl), respectively.
Considering the size or MW and pI of the model proteins, the lower concentrations of BSA/ OVA in the PEG-rich top phase are arising from excluded volume effects due to their larger sizes or MWs (MW (BSA): 66.4 kDa, MW (OVA): 42.7 kDa, Table 6), and their net negative charges at pH 7 (pI (BSA): 4.7-4.9 and pI (OVA): 4.54, Table 6), thus decreasing the salting-out effect from the salt-rich bottom phase [41]. Thereby, specific interactions with PEG can be neglected and would be only significant for smaller PEG chains [42], as reported by Farruggia et al. [43]. On the contrary, α-CT/LYZ are strongly directed into the PEG-rich top phase, mainly due to their lower sizes or MWs (MW (α-CT): 25 kDa and MW (LYZ): 14.4 kDa, Table 6), thus diminishing the influence of the excluded volume effects, and their net positive charges at pH 7 (pI (α-CT): 8.75 and pI (LYZ): 11, Table 6) [42]. Additionally, the surface charge or surface charge density of proteins is also influencing their partitioning behavior in terms of electrostatic interactions between ions. Since BSA/OVA have a higher surface charge (BSA: 57% and OVA: 47%, Table 6) than α-CT/LYZ (α- CT: 29% and LYZ: 23%, Table 6), the influence of the surface charge upon protein partitioning is more significant for BSA/OVA than for α-CT/LYZ [42]. Moreover, the surface hydrophobicity of proteins is furthermore affecting their partitioning behavior. Thereby, BSA/OVA have a lower surface hydrophobicity (BSA: 9% and OVA: 11%, Table 6) than α-CT/LYZ (α-CT: 15% and LYZ: 20%, Table 6). Hence, BSA/OVA are more hydrophilic proteins and prefer a partitioning into the saltrich bottom phase, which is the less hydrophobic one [42]. In contrast, α-CT/LYZ are more hydrophobic proteins according to their larger hydrophobic surfaces, and are preferentially distributed into the PEGrich top phase, which is the most hydrophobic one [43]. Overall, the partitioning behavior of the studied model proteins in different PEGsalt ATPS is generally resulting from coexisting effects related to the physicochemical/surface properties of the proteins and system features, as outlined in the following chapters.
For instance, the effects of increasing PEG MW (A), PEG concentration (B), phase-forming salt type (KPP/NaCit) and KPP/ NaCit concentration (C), NaCl concentration (D) and pH value (E) on protein partitioning in different PEG-salt ATPS are summarized for BSA/LYZ in Figure 2, as well as presented in the Supplementary Data Figure S1 for OVA/α-CT, respectively, considering different physicochemical/surface properties of the proteins. According to these figures, BSA/OVA are predominantly partitioned into the salt-rich bottom phase (K<1), while a distribution of α-CT/LYZ is preferred into the PEG-rich top phase (K>1). Thereby, the most effective partition of BSA/OVA (lowest value of K) and α-CT/LYZ (highest value of K) is achieved in PEG-salt ATPS composed of PEG 8000 or 18 wt.% PEG, 10 wt.% KPP or 16 wt.% NaCit, 2 or 6 wt.% NaCl at pH 5/6 or pH 8/9, respectively. Moreover, a distribution of BSA/OVA is promoted by using KPP compared to NaCit, while the contrary is observed for α-CT/ LYZ. Therefore, PEG-KPP ATPS were chosen for a further investigation and optimization of the partitioning behavior of BSA/OVA, while PEGNaCit ATPS were selected for α-CT/LYZ.

Figure 2: Influence of increasing PEG MW (A), PEG 6000 concentration (B), KPP/NaCit concentration (C), NaCl concentration (D) and pH value (E) on the partitioning behavior (K) of BSA and LYZ (0.1 wt.%) in different PEG-KPP/NaCit ATPS, respectively.
As indicated in the figures, K is decreased (in case of BSA/OVA) or increased (in case of α-CT/LYZ) by rising PEG MW and concentration, respectively (Figures 2A and 2B for BSA/LYZ and S1A/B for OVA/α- CT). The higher the PEG MW and concentration, the more pronounced is the partitioning of BSA/OVA into the salt-enriched lower phase or α-CT/LYZ into the PEG-enriched upper phase. Furthermore, K is increased for all studied model proteins by rising phase-forming salt concentration and pH (Figures 2C and 2E for BSA/LYZ and S1C/E for OVA/α-CT). The higher the phase-forming salt concentration and pH, the more pronounced is the distribution of all model proteins into the PEG-rich top phase. On the contrary, BSA/OVA are initially partitioned into the salt-rich bottom phase with increasing NaCl concentration up to 2 wt.%, thus decreasing K, and then continuously tend to distribute into the PEG-enriched top phase above NaCl concentrations of 2 wt.%, thus increasing K, while α-CT/LYZ are gradually partitioned into the PEG-rich top phase with rising NaCl concentration, and consequently increasing K (Figures 2D for BSA/LYZ and S1D for OVA/α-CT). The higher the NaCl concentration, the more pronounced is the partition of α-CT/LYZ into the PEG-rich top phase.
Effect of PEG MW and concentration: PEG MW and concentration have a strong influence on the partitioning behavior of proteins in PEGsalt ATPS by changing the number of polymer-protein interactions attributed to the hydrophobic interactions between the PEG chains and the hydrophobic protein surface area [1,44-46]. Furthermore, an increasing PEG MW or size of PEG chain length and PEG concentration are resulting in a reduction in free volume or an increase of the volume exclusion effect in the polymer-rich top phase, meaning less space is available in the top phase in order to accommodate a protein, i.e., the available amount of solvent in the PEG-rich top phase required for the solubilization of the protein and salt is decreased [47], thus, inducing a selective protein (e.g., BSA/OVA) partitioning into the salt-rich bottom phase and decreasing K [1,46,48-52].
According to an thermodynamic approach developed by Johansson [53], a high PEG MW is leading to a protein exclusion from the top phase driven by an entropically unfavorable term in the absence of enthalpic effects [54-56]. Hence, this exclusion or entropic effect is a driving force for protein partitioning toward the bottom phase, which is increased for proteins (e.g., BSA/OVA) with self-aggregation or high MW and is more evident at increasing PEG MW [53-56]. In general, entropic effects are larger for PEG-salt ATPS, when the polymer is effectively situated in the top phase, causing a lower number density of the top phase compared to the bottom phase [53-56]. On the contrary, a protein transfer in the top phase with a low PEG MW is enthalpically driven mainly due to strong protein-PEG interactions [54,55].
Another factor affecting protein partitioning in PEG-salt ATPS is the hydrophobicity of PEG. Thereby, the hydrophobicity of PEG is increased in the top phase and the repulsive interactions between PEG and a biomolecule become generally stronger by increasing PEG MW [6,48,49,57,58]. As the PEG chain length is increased, there will be less hydroxyl groups available for the same polymer concentration, thus increasing the hydrophobicity in the top phase [49,58,59]. Hence, owing to an increasing hydrophobicity, proteins (e.g., α-CT/LYZ) with a large hydrophobic surface area are selectively partitioned into the PEG-rich top phase, thus increasing K [6,60,61]. Moreover, a rising PEG concentration is resulting in an increasing number of polymer units involved in protein partition, thus favoring protein (e.g., α-CT/ LYZ) partitioning into the polymer-rich top phase and increasing K due to rising hydrophobic interactions between PEG and protein which prevail over the excluded volume effect [45,62].
Effect of phase-forming salt type and concentration: Phaseforming salt type and concentration have a significant influence on the partitioning behavior of proteins in PEG-salt ATPS due to an inhomogeneous distribution of salt ions between both aqueous phases on the basis of their affinity for the two phases leading to the generation of an electrical/electrostatic potential difference between the two aqueous phases [1,11,63-66], as outlined separately ahead. In general, the selection of salts for PEG-salt ATPS is depending on their salting-out ability of promoting hydrophobic interactions between biomolecules [67,68]. For instance, PEG-phosphate ATPS have been widely used for the recovery of bioproducts [5,67]. However, the use of phosphate on a large-scale is causing environmental problems, thus, recently, biodegradable, non-toxic citrate is used predominantly as a benign phase-forming salt substitute due to its high selectivity, biocompatibility, easy scale-up potential and a better performance regarding low environmental pollution and toxicity issues [67,69,70].
Hydrophobic effects are considered to be the dominant factor regarding the influence of salt type [64]. When a protein is partitioned in PEG-salt systems, phase-forming salt type and concentration are affecting the hydrophobic interactions between the protein and hydrophobic system med67ia, in which salt ions are interacting with oppositely charged protein surface groups in order to form a double layer of ionic groups [47,64,71]. Hence, the protein will be dehydrated due to the hydration effect of salt ions surrounding the protein and its hydrophobic zones will be gradually exposed with increasing salt concentration [47,64,72,73]. The occurring hydrophobic effects in ATPS are influenced by the lyotropic series of Hofmeister, and consequently by the salt type [64]. More precisely, the effect of salt ions on the partitioning behavior of proteins is usually characterized in terms of their position in the Hofmeister series [64,71]. In this context, their effectiveness is mainly determined by the anion nature, in which multi-charged anions have been more effective in partitioning than cations at high salt concentrations [74]. Thereby, the salting-out effectiveness or hydrophobicity of anions is given usually by the following decreasing order: C6H5O73->SO4−2>HPO4−2/H2PO4−>CH3COO−>Cl−>Br−>I−>SCN−, while cations are mostly ordered as follows: NH4+>K+>Na+>Li+>Mg2+>Ca2+ [71,75]. At a higher salt concentration, the salt ions on the left side of the series are decreasing the protein solubility (salting-out effect), increasing the hydrophobic interaction and aggregation, as well as the hydration effect of salt ions causing a higher dehydration [64,71]. Thus, most proteins are strongly favoring a partition into the polymer-rich top phase by increasing hydrophobic protein-PEG interactions [64,71]. In this context, an increasing value of K for α-CT/LYZ with rising phase-forming salt concentration is driven by hydrophobic effects due to an increasing difference in hydrophobicity between the phases and a consequently rising strength of hydrophobic interactions between the protein and PEG molecules, thus improving the predominant partitioning of proteins, such as α-CT/LYZ, into the PEG-rich top phase [57]. Moreover, K is generally higher for all investigated model proteins in PEG-NaCit ATPS than in PEG-KPP ATPS due to a higher anion hydrophobicity of C6H5O73- compared to HPO4−2/H2PO4− according to the Hofmeister series.
Since the phase-forming ability of multivalent salts with PEG is closely related to the Hofmeister series, various salts have different chemical affinities for the two aqueous phases, consequently generating an electrical potential between the phases, as mentioned before [1,66,76]. Salts containing two ions with a different affinity for both aqueous phases are creating a larger potential difference than salt ions with a similar aqueous two-phase affinity [76]. Thereby, ATPS may become positively and negatively charged in the top and bottom phase, respectively, and K is increased with salt concentration in the salt-rich bottom phase due to the generated high ionic strength, thus improving the protein (e.g., BSA/OVA) transfer into the other phase by electrostatic repulsion effects [62,70]. Hence, a potential difference is affecting the partition of charged proteins, especially those containing numerous electrical charges on their surface, such as BSA and OVA [76]. Finally, the generated electrical potential can be adjusted by altering the salt composition and its concentration, thus controlling K [76].
Moreover, protein partitioning in PEG-salt ATPS is governed by the salting-out effect in the salt-rich bottom phase with increasing salt concentration, thus increasing the ionic strength and decreasing the free volume or protein solubility in the bottom phase, favoring the partitioning of proteins into the polymer-rich top phase or interphase, and finally increasing K [13,48,67]. Furthermore, the influence of salts on protein partitioning is enhanced by increasing protein net charge [53,74]. Generally, negatively charged proteins (e.g., BSA/OVA at pH 7) prefer the partitioning into the top phase, whereas positively charged proteins (e.g., α-CT/LYZ at pH 7) usually tend to partition into the bottom phase [1,6]. However, in case of α-CT/LYZ the extent of increasing hydrophobic protein-PEG interactions is more pronounced than electrostatic interactions, thus favoring the distribution of α-CT/ LYZ into the PEG-rich top phase by increasing phase-forming salt concentration. Overall, hydrophobicity is more important than surface charge in PEG-salt ATPS, as reported by Andrews et al. [8].
Effect of NaCl concentration: The addition of neutral salts, such as NaCl, has an appreciable effect on the partitioning behavior of proteins in PEG-salt ATPS by generation and modification of the previously mentioned electrical/electrostatic potential difference between the two aqueous phases based on an unequal distribution of neutral salt ions or particularly Cl− ions, and leading to different charged aqueous phases with increasing NaCl concentration [1,2,7,52,59,65,66,77,78]. Hence, protein partitioning is obtained by movements due to increasing electrical interaction and repulsion between the charged ATPS and proteins [66]. In general, an increasing NaCl concentration in PEGsalt ATPS is inducing a protein shift to one of the aqueous phases depending on their surface net charge [2,3,20,79,80]. According to the Hofmeister series, Cl− ions are so-called chaotropes ('water structure breakers') and partition predominantly into the PEG-rich top phase [21,81]. Therefore, the top phase becomes more negatively charged by increasing NaCl concentration (a higher concentration of Cl− ions), thus partitioning more hydrophobic and positively charged proteins (e.g., α-CT/LYZ at pH 7) into the more hydrophobic PEG-rich top phase and increasing K [8,21]. In contrast, the bottom phase becomes more positively charged, thus distributing more hydrophilic and negatively charged proteins (e.g., BSA/OVA at pH 7) preferentially into the more hydrophilic salt-rich bottom phase in PEG-salt ATPS by addition of already small amounts of NaCl up to 2 wt.%, and consequently decreasing K as well as the protein hydrophobicity with a larger positive charge [7,8,70,82]. Hence, up to 2 wt.% NaCl the partition behavior of BSA/OVA is depending primary on the surface net charge, and to a lesser extent of the hydrophobicity effect [2,70,82].
Moreover, the addition of NaCl is increasing the hydrophobic difference between the phases as well as the hydrophobic protein- PEG interactions, thus promoting the partitioning of more hydrophobic proteins (e.g., α-CT/LYZ) predominantly into the more hydrophobic polymer-rich top phase, and consequently increasing K [7,8,20,21,58,62,74,79,83]. Furthermore, above 2 wt.% NaCl the partition behavior of BSA/OVA is highly dependent on increasing hydrophobic protein-PEG interactions and totally independent of the surface net charge, thus increasing K [1,70,82]. Additionally, the protein shift from the bottom into the top phase occurs due to an increasing salting-out effect in the salt-rich bottom phase as well as a rising shielding of the proteins' surface charges caused by Na+ and Cl− ions [13,84]. Furthermore, NaCl has the ability of modifying the ordered water structure around the hydrophobic chain, like the ethylene group of PEG or the hydrophobic protein surface area exposed to solvent [70,85,86]. A loss of this ordered water occurs with a protein transfer from the bottom into the top phase, thus facilitating the protein-PEG interactions and increasing its K [2,20,85,86]. Thereby, an increasing hydrophobic difference between the phases is resulting in a decrease or replacement of the bound amount of water by NaCl in order to maintain a constant final system composition in terms of the phaseforming component concentrations [20,67,80]. In fact, an increasing NaCl concentration is leading to a higher decreased top phase volume in comparison to the bottom phase volume, thus making the top phase more concentrated and consequently more hydrophobic [20]. Overall, proteins can be transferred from the bottom or top phase into the opposite phase by the addition of NaCl according to the hydrophobic difference between the aqueous phases, the surface charge of proteins as well as their own hydrophobicity [7,8].
Effect of pH: The pH value has a substantial effect on the partitioning behavior of proteins in PEG-salt ATPS either by changing the solute/protein charge or by altering the ratio of the ion composition/ charged species present in ATPS, thus inducing a variable partitioning of proteins into the two aqueous phases [1,44,62,66,74]. In this context, a pH change is influencing the ionization of the protein side chains containing several ionizable groups, thus changing the surface net charge of the target protein and the hydrophobic-hydrophilic balance of the surface, and finally their K [76,87]. That means, the partitioning of charged proteins in ATPS is affected by their surface net charge which itself is depending on the pH of the solution [12,49,60]. Hence, it is important to consider the nature of charged amino-acid residues at the protein surface to understand the relationship between K and the pH of the system [47,88]. Thereby, the protein surface properties are determined by the net charge (positive, negative or neutral) of the surface-exposed amino acid residues and, more importantly, can be changed by altering the pH, at which electrostatic interactions between the charged proteins and aqueous phases, which are also carrying electrostatic charges (top phase: positive charge; bottom phase: negative charge), contribute to the partitioning behavior [47,88]. In this context, electrostatic interactions occur between the oxygen moities of PEG or the ether oxygen sites along the polyethylene oxide chain and the carboxyl side chains of protein amino acids on the basis of the saltdepleted region at the PEG surface [6]. This region is not affected by adding buffering salts in order to reduce the pH, whereas the carboxyl side chains are protonated by reducing the pH, thus weakening any protein interaction, and finally leading to a variation of K with pH value [6].
Moreover, the partitioning of a protein in two aqueous phases is depending on its isoelectric point (pI), i.e., whether pHpI (negative net charge), or pH=pI (zero net charge) [13,60,67,89]. Consequently, proteins become less positively or more negatively charged by rising pH [12,51]. In general, negatively charged proteins (e.g., BSA/OVA at pH 5-9 as well α-CT at pH 9) selectively partition into the PEG-rich top phase, thus increasing K, while positively charged proteins (e.g., LYZ at pH 5-9 and α-CT at pH 5-8) prefer a partitioning into the salt-rich bottom phase, thus resulting in a decreasing value of K due to electrostatic interactions between protein and PEG units as a result of charge distribution [1,6,7,13,44,51,62,66,74,88]. Hence, within the requirement of electroneutrality at the interface, an increasing value of K with rising pH can be explained by considering the protein surface charge compared to its pI and the fact that negatively charged proteins, such as BSA/OVA at pH 5-9 as well as α-CT at pH 9, become more negatively charged with increasing pH due to stronger electrostatic interactions between each protein and the PEG-rich top phase which has a higher positive charge density, thus increasing K [7,44,51,62,66,82,89]. However, the investigated positively charged proteins (e.g., LYZ at pH 5-9 and α-CT at pH 5-8) tend to partition predominantly into the PEG-rich top phase with rising pH, thus increasing K. Thereby, an enhanced affinity of the positively charged α-CT/LYZ for the top phase and rising K occurs with increasing pH based on a rising salting-out effect in the bottom phase as well as enhanced hydrophobic interactions between α-CT/LYZ and PEG in the top phase due to an increased ratio of phase-forming salt ions and high surface hydrophobicity. Hence, the increasing hydrophobic interactions are stronger than electrostatic interactions in PEG-salt ATPS, thus partitioning α-CT/LYZ strongly into the top phase with increasing pH [8,54,57,74,90], as outlined previously. Overall, an increasing value of K and predominant partitioning of target proteins into the polymer-rich top phase with rising pH is attributed to hydrophobic interactions and surface net charge effects [62].
Analysis of screening experiments
Screening experiments were carried out by the 25-1 fFD in order to determine the significant factors affecting protein partitioning and recovery in different PEG–KPP/NaCit ATPS. On the basis of the data obtained by this design (Tables 2 and S1), a reduced linear/first-order regression model was obtained for each response variable, K and YTP (%) or YBP (%), of the investigated model proteins which can be expressed by the equations S1-S8 (in uncoded values) in the Supplementary Data. Thereby, the regression coefficients of all proposed linear models and corresponding p-values, which are used to determine the significant parameters, are given in the Supplementary Data Tables S4-S7, respectively. According to these tables and the significance test, the factors KPP/NaCit (X3), NaCl (X4) and PEG (X2), as well as the interaction effects of factors PEG MW × NaCl (X1 × X4) and PEG × NaCl (X2 × X4) were considered as statistically significant factors for each response variable at 95% confidence level (p<0.05). Thereby, PEG MW (X1) was included into the analysis in order to maintain the hierarchical structure of the model terms although it was found not to be significant (p>0.05). Furthermore, all linear regression models had high values of R2, R2adj and Q2 (see Tables S4-S7 in the Supplementary Data), indicating useful regression models, at which high values of R2 denote that the obtained models will be able to give reasonably good estimates of the response variables of all studied PEG-salt ATPS in the investigated range. Besides this, high values of Q2 provide models with a good prediction of new data, thus representing useful models. Moreover, the statistical significance of each linear regression model was evaluated by ANOVA, as summarized in the Supplementary Data Tables S8-S11 for all response variables, respectively. In this context, the F-test revealed that the models were statistically significant at 95% confidence level (first F-test (SOR): pp>0.05). Hence, the higher p-values in the LOF test in each linear regression model indicate an adequate fit of the data. This is also evident from the fact that the observed and predicted values of the response variables are close to each other, thus indicating an accurate prediction of the experimental data, as illustrated in the Supplementary Data Figures S2-S5 for all response variables, respectively.
In general, the magnitude of the coefficients of the regression models could be used to evaluate the contribution of the corresponding independent to the dependent variables [21,57]. In this context, the main effects of parameters on the partitioning behavior and recovery yield of BSA/LYZ (0.1 wt.%) in the bottom/top phase in different PEGKPP/ NaCit ATPS and their significance are exemplarily illustrated in Figures 3 and 4, as well as represented in the Supplementary Data Figures S6 and S7 for OVA/α-CT. According to these figures, KPP/ NaCit concentration (X3) had the most significant effect on all response variables followed by NaCl (X4) and PEG (X2) concentration. Increasing KPP (X3) and NaCl (X4) concentration had positive or negative effects, and rising PEG (X2) concentration as well as PEG MW (X1) had negative or positive effects on the partitioning or recovery yield of BSA/OVA (Figures 3A/S6A and 4A/S7A), respectively, while increasing NaCit (X3), NaCl (X4) and PEG concentration (X2) as well as PEG MW (X1) had positive or negative effects on the partitioning behavior or recovery yield of LYZ/α-CT (Figures 3B/S6B and 4B/S7B), respectively. Hence, KBSA and KOVA increased or YBP-BSA and YBP-OVA decreased with increasing KPP and NaCl concentration as well as decreased or increased with rising PEG concentration and MW, while high values of KLYZ and Kα-CT as well as YBP-BSA and YBP-OVA were obtained at high concentrations of NaCit, NaCl and PEG as well as a high PEG MW, as explained previously in chapter 3.2.

Figure 3: Main effects of parameters on the partitioning behavior of BSA and LYZ (0.1 wt.%), KBSA (A) and KLYZ (B), in different PEG-KPP/NaCit ATPS and their significance based on the results of the 25-1 fFD, respectively.
Since BSA/OVA are predominantly partitioned into the salt-rich bottom phase (K<1) as well as LYZ/α-CT into the PEG-rich top phase (K>1), the distribution of BSA/OVA into the bottom phase or LYZ/α-CT into the top phase is more pronounced at lower or higher values of K, respectively. Thereby, the partitioning behavior and recovery yields of BSA/OVA were influenced by negative or positive interaction effects of factors PEG MW × NaCl (X1 × X4) and PEG × NaCl (X2 × X4), respectively (Figures 3A/S6A and 4A/S7A). Hence, an increase in PEG MW or concentration with a simultaneous decrease of NaCl concentration result in lower values of KBSA and KOVA, thus promoting a partition of BSA/OVA into the bottom phase and leading to higher YBP-BSA and YBP-OVA. On the contrary, the partitioning behavior and recovery yields of LYZ/α-CT were affected by positive interaction effects of factors PEG MW × NaCl (X1 × X4) and PEG × NaCl (X2 × X4) (Figures 3B/S6B and 4B/S7B). Therefore, an increasing PEG MW or concentration with a simultaneous rising NaCl concentration lead to higher values of KLYZ and Kα-CT, thus favoring a distribution of LYZ/α-CT into the top phase and resulting in higher YTP-LYZ and YTP-α-CT, respectively.
Overall, the effects of significant factors/interactions regarding a decreasing influence on the protein partitioning and recovery were ranked in the following order: KPP/NaCit (X3)>NaCl (X4)>PEG (X2)>PEG MW × NaCl (X1 × X4)>PEG × NaCl (X2 × X4) (Tables S4- S7; Figures 3, 4, S6 and S7). As a conclusion from the 25-1 fFD, the effects of KPP/NaCit, NaCl and PEG concentration were confirmed as the significant factors and therefore selected for further optimization experiments in order to improve the response variables of each investigated model protein. Furthermore, since the PEG MW and pH were non-significant factors, they were fixed to PEG 6000 and pH 7 in order to facilitate subsequent optimization experiments.
Figure 4: Main effects of parameters on the recovery yield of BSA and LYZ (0.1 wt.%) in the bottom/top phase, YBP-BSA (A) and YTP-LYZ (B), in different PEGKPP/ NaCit ATPS and their significance based on the results of the 25-1 fFD, respectively.
Path of steepest ascent/descent
Results shown in Table 2 and Supplementary Table S2 indicated obviously that the optimal experimental region was outside the current design space. Hence, the path of steepest ascent/descent was carried out based on the first-order model (equation 4) in order to improve the response variables of the model proteins and determine the next set of experiments. Details of the experiments and results are exemplarily shown in Table 3 for BSA/LYZ, as well as in the Supplementary Data Table S2 for OVA/α-CT. According to these tables, the partitioning behavior and recovery yields of BSA/OVA in the bottom phase were improved when the concentration of PEG (X1) was increased serially by 0.4 wt.%, while the concentrations of KPP (X2) and NaCl (X3) were decreased by 0.4 and 0.2 wt.%, respectively. Furthermore, the partitioning behavior and recovery yields of LYZ/α-CT in the top phase were enhanced when the concentrations of PEG (X1), NaCit (X2) and NaCl (X3) were increased serially by 0.4 wt.%. However, after the sixth step on the path, a further experimentation could not improve the partitioning behavior and recovery yields of the model proteins. It obviously appeared that the protein partitioning and recovery yield plateau has been reached in the sixth step. These data or factor levels in run 06 (bold) showed that the results were approaching the vicinity of the optimal partitioning behavior and recovery yield (response variables) of each model protein. Hence, the factor levels in this ATPS composition (run 06) were chosen as the new center-points for subsequent optimization experiments of the model proteins, respectively.
Analysis of optimization experiments
Optimization experiments were performed by the 23 CCF design in order to optimize the significant factors (PEG, KPP/NaCit and NaCl concentration) and determine the optimal operating conditions for a maximum protein partitioning and recovery in various PEGKPP/ NaCit ATPS. Based on the data obtained by this design (Table 5 and Supplementary Table S3), a reduced quadratic/second-order regression model was developed for each response variable, K and YTP (%) or YBP (%), of the studied model proteins which can be expressed by the equations S9-S16 (in uncoded values) in the Supplementary Data. The regression coefficients of all proposed quadratic models and corresponding p-values, which are utilized for a determination of significant parameters, are summarized in the Supplementary Data Tables S12-S15, respectively. According to these tables and the significance test, the factors PEG (X1), KPP/NaCit (X2) and NaCl (X3), as well as quadratic and interaction effects of factors PEG × PEG (X12), KPP × KPP/NaCit × NaCit (X22), NaCl × NaCl (X32), PEG × NaCl (X1 × X3) and KPP/NaCit × NaCl (X2 × X3) were considered as statistically reliable factors for all response variables at 95% confidence level (p<0.05). Furthermore, all quadratic regression models had high values of R2, R2adj and Q2 demonstrating suitable regression models, at which high values of R2 and R2adj reveal a good degree of correlation between the experimental and predicted response variables of all investigated PEG-salt ATPS in the studied range. Besides this, high values of Q2 denote a good prediction of new data by the obtained models, thus providing suitable models.
Moreover, the statistical significance of the quadratic regression models was evaluated by ANOVA, as tabulated in the Supplementary Data Tables S16-S19 for all response variables, respectively. Thereby, the F-test denoted that the models were statistically reliable at 95% confidence level (first F-test (SOR): p0.05), thus confirming an excellent adequacy of the quadratic regression models to the experimental data. Furthermore, the higher p-values in the LOF test demonstrate adequately fitted data in all quadratic regression models. This is also apparent from the fact that the observed and predicted values of the response variables are close to each other, thus demonstrating an extremely accurate prediction of the experimental data, as represented in the Supplementary Data Figures S8-S11 for all response variables, respectively.
Additionally, the main effects of parameters on the partitioning behavior and recovery yield of the investigated four model proteins (0.1 wt.%) in various PEG-KPP/NaCit ATPS and their significance are illustrated in the Supplementary Data in Figures S12-S15, respectively. As shown in these figures, the partitioning behavior and recovery yields of the model proteins were affected by linear effects of factors PEG (X1), KPP/NaCit (X2) and NaCl (X3), quadratic effects of factors PEG × PEG (X12), KPP × KPP/NaCit × NaCit (X22) and NaCl × NaCl (X32), as well as interaction effects of factors PEG × NaCl (X1 × X3) and KPP/NaCit × NaCl (X2 × X3). Thereby, linear and quadratic effects of PEG (X1 and PEG × PEG, X12) had the most prominent effects on the response variables of the studied model proteins, respectively. Furthermore, the partitioning behavior and recovery yields of the model proteins in PEG-KPP/NaCit ATPS were influenced by positive and negative effects according to Figures S12-S15, respectively. Overall, on the basis of the preliminary conducted experiments, a distribution of BSA/OVA into the salt-rich bottom phase (K<1) is promoted by increasing PEG concentration and decreasing KPP and NaCl concentrations, thus increasing YBP-BSA and YBP-OVA, while a partition of LYZ/α-CT into the PEG-rich top phase (K>1) is enhanced by rising PEG, NaCit as well as NaCl concentration, thus increasing YTP-LYZ and YTP-α-CT, as discussed previously in chapter 3.2.
Moreover, as a conclusion from the 23 CCF design, the concentrations of PEG, KPP/NaCit and NaCl were confirmed as significant factors, and therefore used to calculate contour plots for the response variables, K and YTP (%) or YBP (%), of all studied model proteins. Hence, the experimental results obtained in the 23 CCF design were analyzed graphically by using response contour plots in order to determine the optimal values of the significant factors (operating conditions) for a maximum protein partitioning and recovery of each investigated model protein in different PEG-KPP/NaCit ATPS. In general, contour plots provide a method to visualize the relationship between independent variables (factors) and dependent response variables [21,25,91]. In this context, contour plots indicate the nature and magnitude of the effects of operating parameters on a response variable [17,92,93]. Response contour plots generated by MODDE 9.1 are exemplarily shown in Figures 5 and 6 considering the partitioning behavior and recovery of BSA/LYZ, as well as illustrated in the Supplementary Data Figure S16 and S17 regarding the partitioning and recovery yields of OVA/α-CT, respectively. These figures represent curves of isoresponse as a function of PEG, KPP/NaCit and NaCl concentration which were calculated at a constant protein concentration (0.1 wt.%). Furthermore, the contour plots for BSA/OVA or LYZ/α-CT have a similar elliptical shape or consist of similar curved lines, respectively, which are independent of others, thus not overlapping each other, and differ only in the partitioning coefficient and recovery yield. In this context, the elliptical nature or curved lines of the contour plots depict the mutual interactions between the significant factors (p

Figure 5: Response contour plots showing the effects of significant operating parameters (PEG, KPP/NaCit and NaCl concentration) on the partitioning behavior of BSA and LYZ (0.1 wt.%), KBSA (A) and KLYZ (B), in different PEG 6000-KPP/NaCit ATPS at pH 7 obtained by the response surface methodology (RSM) based on the results of the 23 CCF design, respectively. The numbers inside the figures represent the constant response (KBSA and KLYZ) along each line. The color range from green to red corresponds to increase in responses.

Figure 6: Response contour plots showing the effects of the significant operating parameters (PEG, KPP/NaCit and NaCl concentration) on the recovery yield of BSA and LYZ (0.1 wt.%) in the bottom/top phase, YBP-BSA (A) and YTP-LYZ (B), in different PEG 6000-KPP/NaCit ATPS at pH 7 obtained by the response surface methodology (RSM) based on the results of the 23 CCF design, respectively. The numbers inside the figures represent the constant percentage of response (YBP-BSA,% and YTP-LYZ,%) along each line. The color range from green to red corresponds to increase in responses.
In fact, the response contour plots for BSA/OVA (Figures 5A/6A and S16A/S17A) showed that there is a pronounced increase or improvement of response variables (lowest KBSA and KOVA, highest YBPBSA and YBP-OVA) at low KPP and NaCl concentrations as well as a high PEG concentration. Furthermore, these plots show that an optimum partitioning of ∼0.2 (KBSA) and ∼0.25 (KOVA), as well as recovery yield of ∼92% (YBP-BSA and YBP-OVA) are achieved at the following estimated operating conditions: ∼18-20 wt.% PEG, ∼10–12 wt.% KPP and ∼0-1 wt.% NaCl. However, other trends are observed for LYZ/α-CT. As shown in the response contour plots for LYZ/α-CT (Figures 5B/6B and S16B/17B), there is a marginal increase in the response variables (highest KLYZ and Kα-CT, highest YBP-BSA and YBP-OVA) with increasing concentrations of all aqueous two-phase components. Furthermore, these plots indicate an optimum partitioning of ∼2.6 (KLYZ) and ∼2.4 (KOVA), as well as recovery yield of ∼94% (YTP-LYZ) and ∼92% (YTP-α- CT) at for systems composed of ∼18 wt.% PEG, ∼16 wt.% NaCit and ∼6 wt.% NaCl. Finally, the quadratic regression models were solved for maximum response variables using the response optimizer tool in MODDE 9.1, and the optimal values for PEG, KPP/NaCit and NaCl concentrations were obtained with maximal predicted response variables, as summarized exemplarily for BSA/LYZ in Table 7, as well as in the Supplementary Data Table S20 for OVA/α-CT, and illustrated additionally in the Supplementary Data Figure S18-S21 for all model proteins, respectively.
Validation of model
In order to validate the previously analyzed quadratic regression models and confirm the predicted results of these models, additional experiments were carried out in triplicate by using the optimal values of significant factors determined by RSM, as shown exemplarily for BSA/LYZ in Table 7 as well as in the Supplementary Data Table S20 for OVA/α-CT. Furthermore, the experimental results (average of three experiments) for each response variable of the investigated model proteins are listed in these tables. According to these tables, a good correlation between predicted and experimental results confirmed an adequate validation and accuracy of the quadratic models to predict the desired response variables, thus reflecting an adequacy of RSM in order to optimize the partitioning behavior and recovery of different model proteins in PEG-salt ATPS. Overall, the evaluated models can be utilized for an adequate prediction of the target response variables under any set of variable combinations.
| Optimized input process parameters | Predicted KBSA | Experimental KBSA | Predicted KLYZ | Experimental KLYZ | ||
| X1 | X2 | X3 | ||||
| 19.24 | 11.15 | 0.78 | 0.18 | 0.19 ± 0.02 | – | – |
| 20.00 | 18.00 | 6.00 | – | – | 2.64 | 2.63 ± 0.02 |
| Optimized input process parameters | Predicted YBP-BSA(%) | ExperimentalYBP-BSA(%) | Predicted YTP-LYZ(%) | Experimental YTP-LYZ(%) | ||
| X1 | X2 | X3 | ||||
| 19.19 | 11.19 | 0.77 | 92.91 | 91.43 ± 0.64 | – | – |
| 20.00 | 18.00 | 6.00 | – | – | 95.82 | 93.59± 0.81 |
X1: PEG concentration (wt.%); X2: KPP/NaCit concentration (wt.%); X3: NaCl concentration (wt.%). BSA/LYZ concentration is fixed to 0.1 wt.%. Furthermore, PEG MW and pH are fixed to PEG 6000 and pH 7, respectively
Table 7: Experimental validation of the quadratic model and corresponding results for BSA and LYZ.
In the present study, the partitioning behavior of four model proteins (BSA, OVA, α-CT and LYZ) was systematically investigated in several PEG-salt ATPS. In this context, the effect of different system parameters: PEG MW (2,000-8,000 g/mol) and concentration (12-18 wt.%), phaseforming salt type (KPP/NaCit) and concentration (10-16 wt.%), NaCl (additive, neutral salt) concentration (0-6 wt.%) and pH (5-9) on the partitioning behavior of each model protein was studied in PEG-salt ATPS considering different physicochemical/surface properties of the model proteins (MW, pI, charge and hydrophobicity). It was found that each system parameter had a particular effect on protein partitioning in PEG-salt ATPS owing to various effects and interactions, such as hydrophobic and electrostatic interactions, volume exclusion and salting-out effects, thermodynamic (entropic/enthalpic) effects, as well as surface net charge and surface hydrophobicity effects of the model proteins. Furthermore, the study revealed that the partition of the more hydrophilic proteins (BSA/OVA) into the salt-rich bottom phase (K<1) was promoted at higher PEG MW and concentration, lower KPP and NaCl concentration, as well as lower pH values in the investigated range, while the distribution of the more hydrophobic proteins (α-CT/ LYZ) into the PEG-rich top phase (K>1) was favored by increasing PEG MW and concentration, NaCit and NaCl concentration, as well as pH values in the studied range. The lower or higher the value of K, the more pronounced was the partition of BSA/OVA into the bottom phase or α-CT/LYZ into the top phase, respectively. Thereby, K was ranked in following order: K (BSA)<K (OVA)<K (α-CT)<K (LYZ) for each PEG-salt ATPS according to an increasing influence of smaller protein sizes or MWs and surface charges, as well as larger pIs and surface hydrophobicities of the model proteins, respectively. In summary, the partitioning behavior of the studied model proteins in PEG-salt ATPS was generally governed by different coexisting effects related to the system features and physicochemical/surface properties of the model proteins.
Moreover, the partitioning behavior and recovery of each model protein in PEG-salt ATPS was systematically studied by two DoE approaches covering a factorial and response surface design. Thereby, a sequential optimization strategy consisting of a 25-1 fFD and 23 CCF design was employed in order to determine the optimum values of the significant factors and improve the partitioning and recovery of the model proteins in PEG-salt ATPS. In this context, the main driving forces or significant factors governing protein partitioning and recovery in PEG-salt ATPS were determined by a 25-1 fFD. This factorial design revealed that the concentrations of KPP/NaCit, NaCl and PEG were considered as significant factors for protein partitioning and recovery in PEG-KPP/NaCit ATPS. Furthermore, the optimal values of the significant factors or operating conditions were determined by a 23 CCF design coupled with RSM in order to achieve a maximum protein partitioning and recovery of each investigated model protein in different PEG-KPP/NaCit ATPS. Moreover, linear and quadratic models were obtained in the experimental designs, respectively, and evaluated by statistical regression analysis and ANOVA using the F-test at 95% confidence level. Finally, the quadratic model was validated by additional experiments using the optimal values of the significant factors determined by RSM and a good correlation between predicted and experimental results was confirmed, thus verifying an adequate validity of the model, and consequently reflecting an adequacy of RSM for an optimization of the partitioning behavior and recovery of different model proteins in PEG-salt ATPS. In summary, the experimental designs used in this study allowed a rigorous analysis and optimization of the main driving forces for protein partitioning in different PEG-salt ATPS.
Overall, the obtained results can be used for choosing suitable PEG-salt ATPS for primary recovery/purification of other biomolecules similar to the investigated model proteins, as well as providing a better understanding of the partitioning mechanisms in order to make protein partitioning in PEG-salt ATPS predictable, thus increasing the selectivity of protein partitioning in PEG-salt ATPS and facilitating the design of extraction processes of other target proteins by these biphasic systems.