Journal of Chromatography & Separation Techniques
Open Access
ISSN: 2157-7064
ISSN: 2157-7064
Research Article - (2022)Volume 13, Issue 5
A simple, sensitive, accurate and precise Inductively Coupled Plasma-Mass Spectrometry (ICP-MS) method after microwave-assisted digestion was validated comprehensively for determination of arsenic, cadmium, mercury and lead in cephalopods and its applicability in crustaceans and fin fish samples. The performance characteristics like specificity, trueness, recovery, repeatability and intermediate repeatability with evaluation of HORRAT, Limit of Determination (LOD), Limit of Quantification (LOQ), standard measurement uncertainty and fitness for purpose is reported. The results of method validation demonstrated that the method complies with the performance criteria as per European Commission regulation 333/2007/EC. The ERM-CE278K (Mussel Tissue) certified reference material was used to evaluate trueness of the method. The mean recovery ranged between 82 to 120%. The HORRAT values were less than 2 for all concentration ranges studied. The method produced results with a combined standard measurement uncertainty (u) less than the maximum standard measurement uncertainty (uf), ensured its suitability for official control. The paper brought out the role of measurement uncertainty in reporting statement of conformity as per ISO/IEC 17025: 2017. The method described can be considered adequate for the simultaneous determination and quantification of the chosen toxic element in seafood and can also be applied in official control samples.
ICP-MS; Method validation; Performance criteria; Measurement uncertainty; Statement of conformity
Contamination with toxic elements is a global environmental and food safety concern. Metals and other elements can be naturally present in food or can enter food as a result of human activities such as industrial and agricultural processes. The metals of particular concern in relation to harmful effects on health are arsenic, cadmium, mercury and tin. Among environmental pollutants, metals are of particular concern; due to their potential toxic effect and ability to bio accumulate in aquatic ecosystems [1]. Potentially Toxic Elements (PTEs) are one of the most potential environmental contaminants even if present at low concentrations [2].
The WHO [3], has categorized As, Cd, Hg and Pb among ten chemicals of major public concern. In India, as in other developing parts of the world, there is an increased risk of toxic metals (As, Cd, Hg, Pb) in the environment. Food is usually the most important path by which toxic elements enter the body e.g., fish and shellfish are known to accumulate PTEs [4]. Maximum levels for cadmium, lead and mercury in crustaceans, cephalopods and fishes have been set by Commission Regulation No 1881/2006, whereas no limit has been set for Arsenic. In order to ensure that these ML are not exceeded, routine surveillance of food must be carried out, involving the sampling of potentially contaminated produce, followed by laboratory analysis to determine the levels of the metal in question in the product. Aiming to ensure everyone's health and quality of food being exported, the Export Inspection Council (EIC), Ministry of Commerce and Industry in India is responsible for the implementation of National Residue Control Program [5] for fish and fishery products, milk and milk products and honey. This program is key towards export of Indian fishery products to European Union, United states, Russia, China and other international markets. Such programs ensure monitoring of contaminants through laboratory testing using valid and reliable analytical methods.
Analytical measurements are essential to maintain control processes and products quality, in manufacturing, trade and research. Due to the availability and variety of different analytical methods for the determination of many contaminants in food samples, it is necessary to ensure the quality and comparability of the analytical results generated by laboratories approved for official control [6]. In recent years there has been increase in developing methods for PTEs (As, Cd, Hg and Pb) which are fit for purpose. Quadrupole Inductively Coupled Plasma Mass Spectrometry (ICP-MS) has been widely employed for the detection of elements at very low concentration to meet the requirements of importing countries and national requirements [7]. The advantages of ICP-MS over other instrumental techniques, such as Flame Atomic Absorption Spectrometry (FAAS), Graphite Furnace Atomic Absorption Spectrometry (GF AAS) and Inductively Coupled Plasma Optical Emission Spectrometry (ICP-OES), have been reported by others [8]. The main limitations are the observation of isobaric interferences, mostly due to the formation of molecular compounds, in particular, oxides and non-spectroscopic interferences [9]. Nonspectral interferences are usually defined as matrix induced signal variations (both suppression and enhancement) and are therefore often referred to as matrix effects [10].
For a fast and flexible determination of total Mercury (hereafter referred as Hg), Cadmium, Lead and total Arsenic (hereafter referred as As) in cephalopods, crustaceans and fish within a single analytical run employing ICP-MS was selected. Moreover, to the best of our knowledge this is the first attempt to validate the method as per the EU regulation 625/2017/EC [11] to meet the performance criteria laid down in EC regulation 333/2007/ EC (European Commission) for non-essential toxic elements, As, Cd, Hg and Pb in cephalopods and its applicability in fish and crustaceans as per the ML prescribed in Commission Regulation EC/1881/2006 [12]. This work has also attempted to describe on how to consider decision rule based on measurement uncertainty to comply with requirements of ISO/IEC 17025 having implications to international trade, which would be first of its kind [13]. The decision rule is described based on ILAC-G8:09/2019, Guidelines on decision rules and statement of conformity [14]. The EU regulation 1881/2006 sets ML for cephalopods, crustaceans and fishes for Cd, Hg and Pb [15]. No ML is defined in this document for As, whereas S.O 729 (E) published on 17th August 2001 Government of India [16], by Ministry of Commerce and Industry, Government of India has fixed the ML as 75 mg/kg. This study also brought about the importance of validating the homogenization activity to ensure homogeneity of test portion taken from a laboratory sample for ensuring reliability of results.
Materials and reagents
All solutions were prepared using ultrapure deionized water, resistivity >18.2 m Ω cm, (EVOQUA Water Technologies, Germany). Before use, all laboratory wares were thoroughly cleaned, kept in a 5% (v/v) nitric acid for more than 24 h and rinsed several times with ultrapure deionized water. High purity supra pure nitric acid of 65% (v/v) and Hydrochloric acid (30%) by Merck, Germany were used. NIST traceable ICP-MS multi element standard solution from Merck (Certipur) of Pb, Cd stock solutions 1004 mg L-1, As stock solution 1004 mg L-1 and Hg stock solution 1003 mg l-1 were used. Agilent tuning solution containing 1 μg L-1 of Ce, Co, Li, Mg, Ti and Y were used to calibrate the mass analyzer. Erbium (Er) standard solution traceable to NIST from Sigma Aldrich (TraceCERT) of 1001 mg L-1 was used as internal standard. Gold (Au) standard solution traceable to NIST from Merck (Certipur) was used to stabilize Hg in the solution. Certified Reference Material Mussel tissue (ERM-CE278K, Belgium) was used to check the accuracy of the method.
Instrumentation
The following equipment was used for sample preparation: Analytical balance (AUW220D, Schimadzu, Japan), a 2.0 L capacity cryogenic laboratory homogenizer (Model: Deimos, Astori Tecnica, Italy) with high quality stainless steel was used for homogenizing the squid, fish and shrimp meat. An Agilent model 7800-MS quadrupole inductively coupled plasma mass spectrometer (Agilent Technologies, Tokyo, JHS, Japan) was used for all measurements using No gas and He mode. The instrument was equipped with a micro flow nebulizer, a quartz Scott double pass spray chamber, a quartz torch and the Agilent SPS4 auto sampler. The instrumental setting and operating conditions are given in Table 1. Argon (Praxair India private limited, India) and helium (Bhuruka gases limited, India) with 99.999% purity was used.
The total metal content was determined in the samples after a microwave-assisted digestion in a Multiwave GO oven (Anton Paar, Austria) in polypropylene tubes with HNO3 65% (v/v) and HCL 30% solution. Calculations of concentration was automatically done by Mass Hunter work station software (version: 4.3) installed in the ICPMS instrument.
Sample collection, sample preparation and homogeneity
The sampling procedure adopted was as per requirement laid down in 333/2007/EC (European Commission). The developed digestion procedure and validation of the method were conducted with squid, fish and shrimp meat samples taken from the local markets of Kochi, India. Approximately 1 kg of cephalopod (squid), fish and crustacean (shrimp) samples were taken from local fishery market at Kochi, Kerala, India considering the requirement of aggregate sample to be taken to obtain a representative sample as per 333/2007/EC (European Commission). Only the edible parts were taken for sample homogenization. The sample was homogenised in a laboratory cryogenic homogenizer of high quality stainless-steel, labelled with a unique code and stored at-20°C until analysis. Due care was taken by using a cryogenic homogenizer to avoid loss of volatile elements or to cause contamination of the elements to be determined. The process of homogenisation was validated using the complete aggregate cephalopod sample of 1 kg to achieve complete homogenisation in order to have a true representation of test portion from the lab sample. Sample was homogenized considering different time required for homogenization and accordingly time was considered for validating homogeneity. Homogeneity of the sample was evaluated as per the criteria laid down in ISO 13258 [17]. Homogeneity is ensured if Ss ≤ 0.3 σ pt, where Ss is between-sample standard deviation, σ pt is standard deviation for the homogenized sample and 0.3 σ pt was considered as check value [17].
Samples free of As, Cd, Hg and Pb were identified for validation experiments. Before use, the samples were allowed to reach the room temperature. The samples were kept for 1 h after spiking with elements at validation level and kept to equilibrate before digestion. The glass wares and safety pressure digestion vessels were cleaned with acid to minimise the risk of contamination. About 0.5 g of squid, fish and shrimp were weighed from the homogenized sample and digested in microwave digestion system using 6 mL of 65% (v/v) HNO3 solution and 0.5 ml concentrated 30% (v/v) HCL. The irradiation programme for twelve polypropylene tubes consisted of two steps being 10 min to reach 100°C (ramp) and 15 min at 180°C (hold). After cooling (20 min) the digested samples were quantitatively transferred into acid cleaned polypropylene tubes and diluted to 25 mL with ultrapure deionized water (>18 m Ω ). The digestion vessels were cleaned after each run using the same reagents and program that was applied for sample decomposition, followed by rinsing with Milli-Q water.
Quality assurance
To check for any contamination during sample preparation, a reagent blank containing the same amount of acids as in the sample and equivalent weight of deionized water (depending on the initial sample weight) was run during each series of digestion. The trueness of the method was verified by analysing the Certified Reference Materials (Mussel Tissue ERM-CE278K) by taking 0.2 gm with adoption of the sample preparation procedure. It was determined by analysing the CRM in triplicates. The reproducibility of the method was verified by participation in proficiency testing for the elements. After analysis of every 10 samples in the ICPMS a blank and one calibration solution was checked to ensure no carry over and stability of the system.
Matrix effect
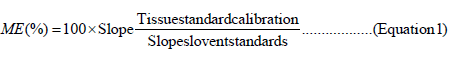
Matrix Effect (ME) was evaluated using slope ratio percentage comparison according to the approach [5] in a modified application of the quantitative approach [18]. A calibration curve was prepared using standard solutions diluted in pure solvent (external standard calibration curve or “S”). A second calibration curve was made using an extract of a blank sample and spiked with standard solution (Tissue Standard calibration curve or “TS”). Both the curves were prepared and analysed in the same batch for a more accurate comparison. Slopes are compared between each pair of curves obtained in the linear calibration curves prepared by external standard (S), and Tissue Standard (TS). Slope ratio as percentage below 90% or above 110% were associated with ion suppression and ion enhancement, respectively. For values within 90%–110%, ME was considered negligible [5].
Method validation
Method validation was performed as per 882/2004/EC (Annex III) in order to establish the performance criteria as per regulation 333/2007/EC (European Commission) in cephalopods. Applicability study for fish and crustaceans as per the requirements of EC regulation 333/2007/EC was also done to meet the requirement (ML) laid down in 1881/2006/EC. The performance criteria established were applicability (matrix and concentration range) specificity, precision under repeatability and intermediate repeatability conditions, recovery, limit of detection, limit of quantification, linearity, measurement uncertainty and fitness for purpose. Specificity of the method was checked by analysing blank samples (n=7) and checked for interferences (isotopic and isobaric) for elements of interest.
Regulation (EU) 333/2007 defines LOD as smallest measured content, from which it is possible to deduce the presence of the analyte with reasonable statistical certainty. The limit of detection is numerically equal to three times the standard deviation of the mean of blank determinations. LOQ is the lowest content of the analyte which can be measured with reasonable statistical certainty. If both accuracy and precision are constant over a concentration range around the limit of detection, then the limit of quantification is numerically equal to 10 times the standard deviation of the mean of blank matrix determinations. Depending on the definition of LOQ, ratios between LOQ and LOD of 2 or 3.3 is obtained. For harmonising approaches, guidance document for estimation of LOD and LOQ specifies the relation between LOD and LOQ as follows
XLOQ=3.3* XLOD
xLOQ: Limit of Quantification
xLOD: Limit of Detection
Regulation (EU) 333/2007/EC sets out performance criteria for assessing the conformity of an analytical method for acceptance of precision, specificity and limits of detection and quantification for methods of cadmium, lead, and mercury analysis. In case of Cd, Pb and Hg the LOD should be less than 3/10th of the LOQ. For LOQ in case of Cd and Hg when ML<0.1 mg/kg, LOQ should be ≤ 2/5th of ML and ML ≥ 0.1 mg/kg, LOQ should be ≤ 1/5th of ML. For Limit of Quantification (LOQ) in case of Pb when 0.02 mg/ kg<ML<0.1 mg/kg, LOQ should be ≤ 2/5th of ML and ML ≥ 0.1 mg/kg, LOQ should be ≤ 1/5th of ML in case of cephalopods, fish and crustaceans per ML laid down in regulation (EU) 1881/2006/ EC.
Accuracy of measurements was also assessed through recovery experiments of the addition of known amount of the element to cephalopods, fish and crustaceans samples. Recovery data were considered acceptable when they were within 70%-130% of the target value [19]. Recoveries were estimated by spiking blank cephalopod samples at three levels 0.025, 0.1 and 1.0 mg/kg for Cd; 0.025, 0.1 and 0.3 mg/kg for Pb; 0.025, 0.1 and 0.5 mg/kg for Hg; 0.05, 0.1 and 0.5 mg/kg in case of As. To ensure applicability of the method, crustacean samples were spiked at one level 0.5 mg/ kg for Cd, Hg and Pb and 0.05 mg/kg in case of As to establish accuracy. In case of fish, accuracy of method was established at 0.05 mg/kg in case of Cd and As, 0.3 mg/kg in case of Pb and 1.0 mg/kg in case of Hg. These levels were selected considering the varying ML for Cd, Pb and Hg defined in 1881/2006/EC and also to ensure that performance criteria laid down in 333/2007/EC for these three elements are met. In case of As, as there was no ML specified by the European union in Fish and fishery products, the validation level and LOQ was established considering on method performance.
The recovery was calculated as follow:
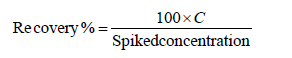
Where, C is the element concentration found.
Linearity was tested from the calibration curves including 0.1, 0.5, 1, 5, 10 and 25 μ g l1 for As, Cd, Hg and Pb prepared freshly each time from the stock standards, and was checked by leastsquares linear regression. Acceptability of linearity was judged by examining the correlation coefficient and y-intercept of the linear regression line for the response versus concentration plot. In the whole validation study, the calibration curve for the measurements was always prepared with at least five points. The precision of the method was determined through repeatability (within days) and intermediate repeatability (different days) from the levels in which recoveries were established. The maximum limit to precision is given by the HORRATr value for repeatability, and HORRATiR for intermediate repeatability. As method precision performance criteria, the HORRATr were used, i.e the observed relative standard deviation (%RSDr) under repeatability conditions divided by the RSDr value estimated from the Horwitz equation [20], using the assumption r=0.66IR, as well as the HORRATiR values, meaning the observed RSDiR value under intermediate repeatability divided by the RSDiR value calculated from the Horwitz equation. According to Commission Regulation 333/2007/EC, the HORRATr and HORRATiR values should be less than two. We adopted the same criteria for Total As, since there is no ML or performance criteria in the legislation for this analyte.
Measurement uncertainty and statement of conformity
Measurement uncertainty was estimated by following the EURACHEM/ CITAC Guide CG4. It adopted the approach of grouping the uncertainty components into two categories based on their method of evaluation, i.e., type A and type B. In this case, the type A uncertainty was the repeatability and the type B corresponded to the calibration graph, standard stock solution, sample weight, and make-up volume. As the method was in-house validated method, as an alternative a ‘fitness-for purpose' approach was assessed to ensure suitability for official control. Methods suitable for official control must produce results with a combined standard measurement uncertainty (U) less than the maximum standard measurement uncertainty calculated using the formula below:
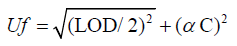
Where:
Uf is the maximum standard measurement uncertainty (μg kg1).
LOD is the limit of detection of the method (μg kg1).
C is the concentration of interest (μg kg1).
C is a numeric factor to be used depending on the value of C. Numeric value to be used for α as constant in formula set above, depending on the concentration of interest.
Combined standard measurement uncertainty (U) was estimated by following the EURACHEM/CITAC Guide CG4. It adopted the approach of grouping the uncertainty components into two categories based on their method of evaluation, i.e., type A and type B. In this case, the type A uncertainty was the repeatability and the type B corresponded to the calibration graph, standard stock solution, sample weight, and make-up volume.
The key to the assessment of compliance is the concept of decision rules. Decision rule describes how measurement uncertainty is accounted for when stating conformity with a specified requirement [21]. As per clause 7.1.3 of ISO 17025/IEC:2017, when the customer request a statement to a specification or standard for the test (e.g. pass/fail, in-tolerance/out of tolerance), the specification or standard and the decision rules shall be clearly defined. When performing a measurement and subsequently making a statement of conformity there are two possible outcomes.
a) A correct decision is made regarding conformance to specification
b) An incorrect decision is made regarding conformance to specification
The decision rule gives a prescription for the acceptance or rejection of a product based on the measurement result, its uncertainty and the specification limit or limits, taking into account the acceptable level of the probability of making a wrong decision.
The use of guard band (w) in decision rule can reduce the probability of making an incorrect conformance decision. It is basically a safety factor built into the measurement decision process by reducing the acceptance limit below that of the specification/tolerance limit [14]. With the guard band terminology there are often upper and lower limits of tolerance. Decision rules can be of three types [14].
1) Binary statement for simple acceptance rule (w=0)
2) Binary statement with guard band and
3) Non-binary statement with guard band.
It is a requirement under ISO/IEC 17025 that laboratories determine and make available the uncertainty associated with analytical results in order to take a decision based on uncertainty mainly in case while exporting or importing food commodities [22]. For consignments being exported it is mandatory that the analytical result shall be reported as x ± U whereby x is the analytical result and U is the expanded measurement uncertainty, using a coverage factor of 2 which gives a level of confidence of approximately 95%.
Statistical analysis
Spread sheet, Excel 2017 version, was used for calculation of accuracy, repeatability and intermediate repeatability as % Relative Standard Deviation (RSD) and Predicted Relative Standard Deviation for intermediate repeatability (PRSDiR) as per Horwitz equation [23], and Thompson equation [20].
Optimization of instrumental parameters and specificity
Mass resolution, mass calibration, sensitivity, and stability of the system was checked by the use of tuning solution. Using this solution, the ICP-MS instrument was adjusted to achieve maximum ion signals and both low oxide rates (e.g., <2%) and low rates of double-charged ions (e.g., <2%). Memory effects in the sample delivery system mainly due to Hg were nullified by using gold in standard, samples, quality control samples, prolonged washout time and control runs of blank solutions [19]. Physical interference arising from high levels of dissolved solids in sample was compensated by use of internal standard [19]. Three isotopes (206Pb, 207Pb, 208Pb) were used to account for differences in the Pb isotopic composition between the calibration standards and the samples. Isotope, 75 As is prone to polyatomic interference notably from Chloride (Cl), which is common in sea food (eg. Salt) reacts with Argon (Ar) and forms 40Ar35Cl, was analysed with He gas in collision/reaction cell to selectively attenuate polyatomic interferences which was in comparison to earlier study [19]. Various types of spectral interference is of high significance in the ICPMS and accordingly suitable isotopes for As, Cd, Hg and Pb (isotopes selected given in Table 1) were selected. The specificity of the method for simultaneous determination of As, Cd, Hg and Pb could be achieved through the present study, as these elements were free from matrix effect and other interference (non-spectral, Isobaric, spectral and polyatomic) meeting the criteria laid down in 333/2007/EC.
| Instrument parameter | Operating conditions |
|---|---|
| RF-Power (W) | 1550 |
| Reflected power | <5 |
| Carrier gas flow (L min-1) | 0.99 |
| Plasma gas flow (L min-1) | 15 |
| Auxiliary gas flow ( L min-1) | 0.9 |
| Collision gas flow (L min-1) | 5 |
| Spray chamber | Water cooled double pass |
| Spray chamber temperature (°C) | 2 |
| Mass range (amu) | 6-209 |
| Mass resolution | 0.7 |
| Integration time points/ms | 3 |
| Points per peak | 3 |
| Number of replicates | 3 |
| Isotopes monitored | 75As, 111Cd, 201Hg, Sum of 206Pb,207Pb,208Pb |
Table 1: Operating parameters used in Agilent 7800 Quadrupole ICP-MS.
Validation of sample homogeneity
Validation of sample homogeneity was checked from the homogenized cephalopod sample. This was demonstrated by taking different analytical samples at different locations in the homogenised laboratory sample and analysed for as detected above limit of quantification. In the homogeneity study the Ss was 0.062, σ pt was 0.217 and check value was 0.065. As Ss value was less than check value the homogeneity of the study was validated.
The time taken for homogenization was considered for validating the homogeneity and accordingly it was seen that 10 minutes (intermittently mixing with spatula) was found to be ideal to ensure homogeneity based on evaluation as per ISO 13258 [17].
Quality assurance
Trueness of the method was checked through the use of the CRM (ERM-CE278k) of Mussel Tissue, where As, Cd, Hg and Pb showed trueness towards the certified values (Table 2). The external quality assurance and reliability of the method was ensured through participation in two proficiency testing programs organized by LGC, UK (PT round LGC-MT 251-710 for Cd and Pb) and Export Inspection Agency-Kolkata, India (PT round 0818 HM for As and Hg). The results indicated a satisfactory Z score of ≤ ± 2 (Table 2).
| Elements | Measured mean value a (mg/kg) | ERM-CE278k Certified value (mg/kg) | Z score in PT participation |
|---|---|---|---|
| Cadmium | 0.347 | 0.336 ± 0.025 | -0.7 |
| Lead | 2.214 | 2.18 ± 0.18 | 0.5 |
| Arsenic | 6.87 | 6.7 ± 0.4 | 0.98 |
| Mercury | 0.066 | 0.071 ± 0.007 | 0.4 |
Table 2: Results for trueness of cadmium, lead, mercury and arsenic based on CRM and participation in proficiency testing.
Method validation
In this study, cephalopod was chosen for the method validation and its applicability was studied in crustaceans and fish as per performance criteria for applicability laid down in Commission regulation 333/2007/EC and admissible level as per Commission regulation 1881/2006/EC.
A correlation coefficient of >0.999 is generally considered as acceptable fit of the data to the regression line. Results indicated that the linear regression model was acceptable for the 4 elements in the defined range with a satisfactory correlation coefficient of r2 ≥ 0.999 for weighted liner calibration curve. The LOQ was established, 0.025 mg/kg in case of cephalopods, crustaceans and fish for all Cd, Hg and Pb (Table 3). Except for Cd in fish where the LOQ was 0.020 mg/kg, while the LOQ for As was established as 0.05 mg/kg (Table 3). The LOD was derived as 0.0075 mg/kg for Cd, Hg and Pb in cephalopods, crustaceans and fish except in the case of As where LOD was 0.015 mg/kg complying with commission regulation 333/2007/EC (Table 3).
| Element | ML (mg/Kg) | LOD criteria (mg/Kg) | LOD as per the study (mg/Kg) | LOQ criteria(mg/Kg) | LOQ as per the study (mg/Kg) |
|---|---|---|---|---|---|
| Cephalopods | |||||
| As | ~a | ~a | 0.015 | ~a | 0.05 |
| Cd | 1 | ≤ 0.06 | 0.0075 | ≤ 0.2 | 0.025 |
| Hg | 0.5 | ≤ 0.03 | 0.0075 | ≤ 0.1 | 0.025 |
| Pb | 0.3 | ≤ 0.018 | 0.0075 | ≤ 0.06 | 0.025 |
| Crustaceans | |||||
| As | ~a | ~a | 0.015 | ~a | 0.05 |
| Cd | 0.5 | ≤ 0.03 | 0.0075 | ≤ 0.1 | 0.025 |
| Hg | 0.5 | ≤ 0.03 | 0.0075 | ≤ 0.1 | 0.025 |
| Pb | 0.5 | ≤ 0.03 | 0.0075 | ≤ 0.1 | 0.025 |
| Fish | |||||
| As | ~a | ~a | 0.015 | ~a | 0.05 |
| Cd | 0.05 | ≤ 0.006 | 0.006 | ≤ 0.02 | 0.02 |
| Hg | 1 | ≤ 0.06 | 0.0075 | ≤ 0.2 | 0.025 |
| Pb | 0.3 | ≤ 0.018 | 0.0075 | ≤ 0.06 | 0.025 |
Note: aLimit and criteria not specified
Table 3: Requirement for LOD and LOQ as per Commission Regulation (EC) n°333/2007 for Arsenic, Cadmium, Lead and Mercury; ML: maximum level according to Commission Regulation (EC) n°1881/2006 for cephalopods, crustaceans and fish.
The performance studies showed recoveries ranging between 82% to 120% in Table 4 for all concentrations studied meeting the quality control criteria [19]. RSDr evaluated as HORRATr was found to be less than 2 at all levels studied for all four elements in Table 4, meeting the performance criteria laid down in 333/2007/ EC. RSDiR evaluated as HORRATiR was also found to be less than 2 at three levels studies for four elements in cephalopods (Table 4).
| As | Cd | |||||||||
|---|---|---|---|---|---|---|---|---|---|---|
| Performance characteristics | Cephalopods | Crustaceans | Fish | Cephalopods | Crustaceans | Fish | ||||
| Validation concentrations (mg/kg) | 0.05 | 0.1 | 0.5 | 0.05 | 0.05 | 0.025 | 0.5 | 1 | 0.5 | 0.05 |
| Mean Recovery (%) | 92 | 89 | 89 | 120 | 100 | 104 | 92 | 99 | 98.8 | 96 |
| RSDr (HORRATr) | 1.13 | 0.79 | 0.49 | 0.45 | 0.56 | 0.52 | 0.36 | 0.45 | 0.136 | 0.42 |
| RSDR (HORRATR) | 0.79 | 0.9 | 0.43 | - | - | 0.38 | 0.38 | 0.35 | - | - |
| U (mg/kg) | 0.004 | 0.01 | 0.015 | 0.004 | 0.004 | 0.002 | 0.015 | 0.026 | 0.008 | 0.002 |
| Uf (mg/kg) | 0.013 | 0.02 | 0.09 | 0.01 | 0.01 | 0.006 | 0.09 | 0.15 | 0.09 | 0.01 |
| Hg | Pb | |||||||||
| Validation concentration (mg/kg) | 0.025 | 0.1 | 0.5 | 0.5 | 1 | 0.025 | 0.1 | 0.3 | 0.5 | 0.3 |
| Mean Recovery (%) | 88 | 82 | 90 | 93.8 | 94.3 | 96 | 89 | 103 | 104.6 | 97 |
| RSDr as HORRATr | 0.63 | 0.46 | 0.31 | 0.12 | 0.46 | 0.72 | 1.08 | 0.28 | 0.31 | 0.5 |
| RSDR as HORRATR | 0.58 | 0.64 | 0.49 | - | - | 0.83 | 0.8 | 0.34 | - | - |
| U (mg/kg) | 0.002 | 0.005 | 0.017 | 0.006 | 0.039 | 0.002 | 0.007 | 0.009 | 0.016 | 0.02 |
| Uf (mg/kg) | 0.006 | 0.02 | 0.09 | 0.09 | 0.15 | 0.006 | 0.02 | 0.05 | 0.09 | 0.05 |
Note: U is the combined standard uncertainty, Uf is the maximum standard measurement uncertainty.
Table 4: Method performance for all the analyzed elements.
Matrix effect
Matrix effects in ICP-MS can arise from signal drift due to the deposition of solids on the sampling apertures and/or signal suppression or enhancement by the presence of the dissolved salts. The first category is generally understood and depends on the dissolved solids present in the sample. The second category can come from the processes in the plasma, deposition of salt in the orifices, effect in the ion extraction and space charge effects. Correction in matrix effect can be done through dilution, using standard addition and matrix match calibration. Slope ratio percentage was calculated for each pair of curves to the target compounds using Equation (1) to estimate the matrix effect. As observed from the equation ME% varied from 100.7 to 106% for all elements. Since the method exhibited insignificant matrix effect it was concluded that calibration curves in solution standard could be used to quantify all four elements. Further the non-spectral matrix effects associated to the ICP-MS measurements were resolved by the addition of internal standards.
Analytical measurement uncertainty and decision rule
The combined standard measurement uncertainty (U) was less than the maximum standard measurement uncertainty (Uf) for all concentration levels studied including ML and LOQ for all four elements in cephalopods, crustaceans and fish (Table 4). The difference of U to Uf ranged from 50 to 69% for As, 60 to 82% for Cd, 66 to 93% for Hg and 60 to 82% for Pb in the matrices and concentrations studied. This indicated that the method meets the fit for purpose approach as per 333/2007/EC and accordingly demonstrating the applicability of the method for use in official control.
For making a statement of conformity to a specification or standard mainly pertaining to export trade, laboratories needs to document decision rule based on the level of risk (false positive and false negative). Considering that a consignment is exported to the European Union, the lot or sub lot is accepted if the analytical result of the laboratory sample does not exceed the respective maximum level as laid down in Regulation (EC) No 1881/2006 taking into account the expanded measurement uncertainty and the recovery correction based in the quality control spike in the matrix (no extraction step) was not applied as it is not required as per 333/2007/EC.
The Figure 1 shows how the analytical results can be displayed in terms of the measured value of the contaminants, the corresponding uncertainty interval, and the ML. In scenario (i), the analytical result minus the expanded measurement uncertainty exceeds the maximum level; in this case the decision can be non-compliant as the result indicates that the contaminant in the sampled lot is above the ML. In case of scenario (ii), the analytical result bounded by the expanded measurement uncertainty endpoints is less than the ML, hence the decision can be complaint as the result indicates that the contaminant in the sampled lot is below the ML.

Figure 1: Illustration of the relationship of expanded measurement uncertainty in the comparison of test results with a Maximum Level. For each scenario, the red point represents an individual test result and the vertical bar represents the associated measurement uncertainty interval.
In scenario (iii) the analytical result is greater than the ML with the lower endpoint of the measurement uncertainty less than the ML and in scenario (iv) the analytical result is less than the ML with the upper endpoint of the measurement uncertainty being greater than the ML, hence it cannot be concluded that the ML is exceeded or compliant without reasonable doubt. In such a case decision rule will depend on national practices and may have considerable impact on the acceptance of trade consignments. Caution should be exercised in distributing products in domestic markets or international trade with test results illustrated in scenario (ii) and (iii). While certifying a product for export it may not be advisable to export consignments with contaminant levels in scenario (ii) and (iii) as laid down in CAC/GL 59-2006.
Decision rule, expressed on basis of statement of conformity for lot/sub lots other than export
In case a customer request for statement of conformity with respect to the results in cases of scenario ii and iii of Figure 1, a decision based on binary decision rule are limited to two choices, conform or does not conform or a non-binary decision rules when multiple terms can express the result (conform, conditional conform, conditional non conforms, non conforms). The statement of conformity is based on three factors i.e Acceptance Limit (AL), Tolerance Limit (TL) and Guard Band (w). These are further explained below
a) Binary statement of simple acceptance rule (w=0) Statement of conformity can be report as below and is represented in Figure 2a

Figure 2: (a) Representation of a binary statement- Simple acceptance; (b) Representation of a non-binary acceptance based on guard band w=U; (c) Representation of a binary acceptance based on guard band ( ≤ 2.0% global risk).
• Conform-the measured value is below the acceptance limit, AL=TL
• Non conforms-the measured value is above the acceptance limit, AL=TL
The customer agrees that conforms/non-conforms decision is based on acceptance limits chosen on simple acceptance. In this case, the risk that accepted items are outside the tolerance limit is upto 50%. The risk of false reject is upto to 50% for measured results outside tolerance.
b) Binary statement with Guard band Statement of conformity can be report as below and is represented in Figures 2b and 2c.
• Conform-acceptance based on guard band; if the measurement results is below the acceptance limit, AL=TL-w, in this case w=U
• Non conforms-rejection based on guard band; if the measurement results is above the acceptance limit, AL=TL-w, in this case w=U
The customer agrees that decisions are based on guard band acceptance limit, AL, to result in less than 2% false accept (global) risk. The risk of accepted items to be outside the tolerance limit is ≤ 2.0%.
c) Non-binary statement with guard band Statement of conformity can be report as below and is represented in Figure 2a
• Conform-the measurement result is below the acceptance limit, AL=TL-w.
• Conditional conform-the measured result is inside the guard band and below the tolerance limit, in the interval [TL-w, TL)
• Conditional non conforms-the measured result is above the tolerance limit but below the tolerance limit added to the guard band, in the interval [TL, TL+w)
• Non conforms–the measured result is above the tolerance limit added to the guard band, TL+ w.
The customer agrees that decision are based on guard band acceptance limit (w=U, AL=TL-w) where U is the expanded measurement uncertainty calculated as per the GUM. Statement of conformity is non-binary. In this case the risk of accepted items to be outside the tolerance limit is <2.5%. For rejected items the risk to be inside the tolerance limit is <2.5%. When the measured result is close to the tolerance, the risk of false accept and false reject is upto 50%.
It should be considered from the above situations that, a measurement may result in a decision of conformity (acceptance) using one guard band, and rejection, if a larger guard band is used. Considering this the decision rule is agreed with customer before the measurements are taken [21]. The agreed decision rule employed for statement of conformance must be clearly documented in the measurement report.
The proposed method showed to be reliable for simultaneous determination of four toxic elements in various species of sea food (cephalopods, crustaceans and fish) for export meeting the performance criteria for parameters laid in the 333/2007/EC which endorses that this method deemed suitable for routine and regulatory analysis. The present method offers satisfactory quantification limits with smallest amount of sample used for sample preparation, due to the powerful spectrometric analytical technique employed. Results obtained indicate that the proposed method provides adequate sensitivity, applicability, precision, accuracy, and specificity with high sample throughput for determination of As, Cd, Hg and Pb in sea food. The combined standard uncertainty obtained by this method is below the standard measurement uncertainty, and it is evident that the method is fit for the intended purpose and can be also applied in the residue control programmes for control of As, Cd, Hg and Pb in fish and fishery products and pre export testing. The method was accredited and implemented in routine analysis in order to investigate the seafood quality in Indian market. This paper brings out awareness on implication of decision rule for reporting statement of conformity with the maximum levels of fish and fishery products complying with the customers, regulation or standard requirements.
The authors gratefully acknowledge the support given by The Export Inspection Council, New Delhi, India and Export Inspection Agency-Kochi for completion of the work. We wish to express our sincere gratitude to Agilent India Pvt., Ltd., India for the technical support provided during the work. We would like to thank an anonymous expert for providing his feedback on the paper.
The authors confirm that they have no conflicts of interest with respect to the work described in this manuscript.
[Cross Ref] [Google Scholar] [PubMed]
[Cross Ref] [Google Scholar] [PubMed]
[Cross Ref] [Google Scholar] [PubMed]
[Cross Ref] [Google Scholar] [PubMed]
[Cross Ref] [Google Scholar] [PubMed]
Citation: Kumar K, Krishnan AA, Vijaykumar B, John L, Kaliraj M, Rao TR, et al. (2022) Comprehensive Method Validation for the Determination of As, Cd, Hg and Pb in Cephalopods with its Applicability in Crustaceans and Fish using ICPMS: The Role of Measurement Uncertainty for Reporting Statement of Conformity, J Chromatogr Sep Tech. 13:486.
Received: 12-Jul-2022, Manuscript No. JCGST-22-18317; Editor assigned: 15-Jul-2022, Pre QC No. JCGST-22-18317 (PQ); Reviewed: 01-Aug-2022, QC No. JCGST-22-18317; Revised: 08-Aug-2022, Manuscript No. JCGST-22-18317 (R); Published: 16-Aug-2022 , DOI: 10.35248/2157-7064.22.13.486
Copyright: © 2022 Kumar K, et al. This is an open-access article distributed under the terms of the Creative Commons Attribution License, which permits unrestricted use, distribution, and reproduction in any medium, provided the original author and source are credited.