Journal of Chromatography & Separation Techniques
Open Access
ISSN: 2157-7064
ISSN: 2157-7064
Research Article - (2013) Volume 4, Issue 3
A baseline separation was achieved for the direct HPLC separation of atracurium besylate stereoisomers; atracurium trans-trans, atracurium trans-cis, and atracurium cis-cis, on a Cellulose tri- 3, 5-dimethylphenycarbamate (CDMPC) column. Acetonotrile (ANC) and Potassium hexaflourophosphate (KPF6) were used as mobile phase. The effect of organic modifier, pH, buffer concentration, temperature, and flow rate on retention time and enantioselectivity, was investigated. Binding energy differences, mode of interaction as determined by computer simulation method, were used to elucidate chiral recognition mechanism and explain the effect of organic modifier on enantioselectivity. The result suggests that the isomers of atracurium besylate could be well resolved on a CDMPC column by a 50:50 ANC: KPF6 (0.1 M, pH 3.0-3.5) mobile phase in the temperature range of 30-38°C, at a flow rate between 0.5-1, and wavelength of 280 mm. It was further observed that both ANC and KPF6 did influence enantioselectivity. From computer simulation, π-π interaction, Hydrogen bonding and Vander Waal force were noted to be responsible for chiral recognition. Results from this research are useful in designing chromatography method for separating atracurium besylate and related substances on CDMPC column and other chiral selectors.
Keywords: Atracurium besylate; Cisatracurium besylate; Cellulose tri- 3, 5-dimethylphenycarbamate; Chiral separation; Recognition mechanism
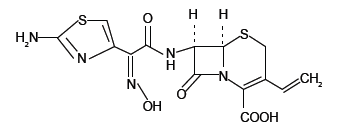
Good manufacturing practice dictates that the equipment should be to manufacture pharmaceuticals must be in a clean and orderly manner [1]. The same equipment may be used for processing in different products, the cleaning procedure validation describe aresponsibilities, facilities, cleaning strategies, It is of great impotence to evaluate carefully the material to be used Chemically, Cefdinir is [6R-[6α, 7β (Z)]]-7-[[(2- amino-4-thiazolyl) (hydroxyimino)acetyl]amino]-3-ethenyl-8-oxo-5- thia-1-zabicyclo[4.2.0]oct-2-ene-2-carboxylic acid (Scheme 1).
Non-extractive visible spectrophotometric method was proposed for the determination of cefdinir based on the formation of donoracceptor complex between Cefdinir and Fe in a buffered medium [2-8].
The goal of this study was to develop and validate a simple analytical method for the determination of trace levels of Cefdinir residues in production area equipment. The method validated considering accuracy, selectivity, precision, linearity, and limits of detection (LOD) and quantification (LOQ).
Reagent and chemicals
Cefdinir reference standard of United States Pharmacopoeia (USP) was bought from Sigma, United States. A fixed dose combination (FDC) was obtained from manufacturer, Cefdin Capsules 300 mg (Novartis) produced by SB-Egypt. Disodium EDTA (EDTA), 85% phosphoric acid, potassium hydroxide, Tetrabutyl ammonium hydroxide (25% aqueous) (TBAH) and acetonitrile were of chromatographic grade and were purchased from Merck company, Germany. All chemicals and water used were of HPLV analytical reagent grade.
A buffer of pH 7.0 was prepared by dissolving 16 mg of (EDTA) with 8.3 ml of (TBAH) in 800 ml of water then adjusting to pH 7.0 ± 0.05 with phosphoric acid and mix.
Alpha Swab polyester on a propylene handle-TX714A (ITW Texwipe, Mahwah, USA) have been used during samples analysis.
Equipment
Chromatographic separation was performed on Agilent 1100 series liquid chromatographic system consisted of a quaternary pump, an automatic injector, a column oven and multiwavelength detector G1315A, all 1100 Series from Agilent Technologies, with HP Chemstation software. Symmetry–C18 analytical column (250 mm×4.6 mm, 5 μm, Waters USA) have been used in HPLC separation, in the sample preparation procedure, ultrasonic instrument (China) and Orion Ross combination pH electrode (Model 81-02) was used for all pH measurements.
Chromatographic conditions
The mobile phase consisted of 850 ml of buffer of pH 7.0 mixed with 150 ml Acetonitrile. The mobile phase solution was filtered through 0.45 μm membrane filter (Millipore) and degassed prior to use. Extraction solution consisted of 900 ml of water and 3.0 ml phosphoric acid and then adjusts to pH 7.0 ± 0.05 with Potassium Hydroxide and mix.
All chromatographic experiments were performed in isocratic mode. The mobile phase was pumped at flow rate of 1.0 ml min-1 with 20 μl injection volume. The column temperature was at 25°C. UV detection was performed at λ 254 nm.
Standard solution preparation
Standard stock solution was prepared by weighing 10 mg of Cefdinir standard and transferring into a 200 ml volumetric flask, 100 ml of diluting solvent was added and the content of flask was sonified for 15 min. the solution in the flask was diluted to volume with diluting solvent. An aliquot of 10 ml was diluted to 100 ml and the final concentration being 0.005 mg/ml.
Sample solution preparation
The selected surfaces (10 cm×10 cm) of stainless steel, previously cleaned and dried, were sprayed with 350 μL of stock standard solution (the stock solution of standard was prepared by accurately weighing 100 mg of Cefdinir reference standard and transferring into a 200 ml volumetric flask, Approximately 100 ml of diluting solvent was added and content of flask was sonified for 15 min. the solution in the flask was diluted to volume with diluting solvent) the final concentration being 0.018 mg/ml.
The background control sample was prepared from the extraction solvent.
Acceptance limit calculation
The calculated limit per surface area (LSA) in the case of Cefdinir was 1.75 μg /swab pro 100 cm2. A stainless steel surface area of 10 cm×10 cm was chosen for practical reasons.
Optimization of the chromatographic conditions
For analysis the combination of water, tetraheptylammonium hydroxide, (EDTA), buffer 7, Phosphoric Acid and Acetonitrile is frequently used as the mobile phase. The amount of Acetonitrile was varied 12.0% to 20.0%, wavelength detector (λ) was varied 250 nm to 258 nm and flow rate varied 0.8 ml/min to 1.1 ml/min. The sufficient tailing factor and plate number were achieved with the proposed mobile phase (16 mg of (EDTA) with 8.3 ml of (TBAH) in 800 ml of water then adjust to pH 7.0 ± 0.05 with phosphoric acid and mix) at flow rate 1.0 ml/min. Wavelength 254 nm was selected for detection. The calibration curve obtained at 254 nm showed good linearity. Regarding the chromatographic procedure, different C18 columns were evaluated but the Symmetry C18 5 μm (250×4.6 mm) was preferred to improve the plate number and tailing factor. The analysis was performed at 25°C to improve the tailing factor and plate number.
Optimization of the sample treatment
Different quantities of Cefdinir have been spiked and placed into tubes. 10 ml of pH 7.0 as extraction solvent and sonification time of 5 min were the optimum conditions. This technique was applied in the subsequent work. The samples were calculated by the following equation:
Then the equation can be simplified to:
Validation of the method
System suitability: In all cases relative standard deviation (RSD) of the peak areas was <2.0%, the average number of theoretical plates per column was >5800 and the USP tailing Factor ≤ 1.5.
Specificity: The specificity of the method was checked by injection the Cefdinir standard, Cefdinir sample, the background control sample, the negative swab control, un-spiked stainless steel 10 cm×10 cm plate swabbed as descried, four standard solutions after storage under destructive condition (80°C for 24 hrs), (in 0.05 M Hydrochloric Acid for 24 hrs), (in 0.05 M Sodium Hydroxide for 24 hrs) and (in 3% H2O2 for 24 hrs). Cefdinir has chromatographic resolution more than 1.5 from other peaks. The results are shown in figures 1a-1f.

Figure 1: Chromatograms obtained from (a) Cefdinir standard solution, 50 μl ml-1, (b) Cefdinir sample 15 μl ml-1, (c) non-spiked stainless steel, (d) excipient mixture, (e) negative swab control and (f) background control sample.
Linearity: Linearity of the method has been studied by analyzing standard solutions at seven different concentration levels in the range from 15-74.5 μg mL-1 with triplicate determination at each level. The calibration curve values of intercept, slope and correlation coefficient for Cefdinir are presented in table 1.
| Statistical Parameters | Values |
|---|---|
| Concentration Range µg mL-1 | 15.0 - 74.0 |
| Regression equation | Y=38229 X-7.3419 |
| Coefficient of Determination | 0.9999 |
| S(a)-error in intercept | 0.39 |
Table 1: Linear regression data in the analysis of Cefdinir.
Limit of detection (LOD) and Limit of quantification (LOQ): The LOD and LOQ for Cefdinir were found to be 0.7 and 2.2 μg mL-1, respectively.
Precision and accuracy: Precision and accuracy were also inspected after storage for 24 hours at room temperature 25°C with 1.6% and 0.30% difference in results for standard & samples respectively.
Filter evaluation: Samples and standard solutions of Cefdinir prepared as per analysis method, filtered with Millipore millex-HVPVDF 0.45 μm and millex–PTFE- 0.45 μm, and then compared to the unfiltered samples. The Millipore millex- HV–PVDF 0.45 μm and millex –PTFE-0.45 μm pore size syringe filter were qualified for use with filter evaluation ratio 100.1% and 100.30 for Cefdinir standard with PVDF and PTFE filter respectively. For samples the filter evaluation ratio 100.8% and 100.3% for PVDF and PTFE filter respectively (Table 2).
| Amount addedµg mL-1 | Amount foundµg mL-1 | 95% confidence interval % | Recovery % | RSD %n=6 |
|---|---|---|---|---|
| 14.89 | 14.70 | 97.1-100.3 | 98.68 | 1.88 |
| 49.65 | 50.06 | 101.2-102.4 | 101 | 0.69 |
| 74.47 | 76.17 | 102.26-102.30 | 102.28 | 0.02 |
Table 2: Precision and accuracy of the results obtained from swabbed plates spiked with Cefdinir.
Robustness
In order to test the robustness of the HPLC-UV method, the effect of different chromatographic parameters on the resolution and the concentration of cefdinir from cleaning samples, was estimated. The amount of acetonitrile in the mobile phase was varied from 12% to 20%, the flow rate was varied from 0.8 ml min-1 to 1.1 ml min-1, column temperature was varied from 20°C to 27°C and the wavelength detector (λmax) was varied from 250 nm to 258 nm. The results obtained have been showed in table 3.
| Chromatographic parameter | RSD % | Tailing factor | plate count | sample |
|---|---|---|---|---|
| Result (ppm) | ||||
| 1) Wavelength (nm) | ||||
| 250 | 0.27 | 1.2 | 5869 | 1.70 |
| 252 | 0.28 | 1.2 | 5874 | 1.30 |
| 254 | 0.42 | 1.2 | 5866 | 1.30 |
| 256 | 0.45 | 1.2 | 5870 | 1.30 |
| 258 | 0.42 | 1.2 | 5873 | 1.30 |
| 2) Flow rate (ml min-1) | ||||
| 0.8 | 0.09 | 1.2 | 28089 | 1.45 |
| 0.9 | 0.05 | 1.2 | 6695 | 1.50 |
| 1 | 0.42 | 1.2 | 5866 | 1.30 |
| 1.1 | 0.07 | 1.1 | 6016 | 1.40 |
| 3) Column temperature (°C) | ||||
| 20 | 0.27 | 1.1 | 6254 | 2 |
| 23 | 0.18 | 1.1 | 6435 | 1.4 |
| 25 | 0.42 | 1.2 | 5866 | 1.32 |
| 27 | 1.98 | 1.1 | 6632 | 1.62 |
| 4) % of Acetonitrile content in the mobile phase | ||||
| 12.0% | 0.69 | 1.0 | 6092 | 2 |
| 15.0% | 0.42 | 1.2 | 5866 | 1.3 |
| 18.0% | 1.16 | 1.4 | 10988 | 2.3 |
| 20.0% | 1.75 | 1.5 | 14231 | 1.5 |
Table 3: Effect of different chromatographic parameters.
Assay of swab samples collected from different locations within the equipment train
The residual of cefdinir have been analyzed by the proposed method, results obtained are presented in table 4.
| Serial no. | Location description | Results (ppm) |
|---|---|---|
| 1 | Inner surface of V- end point | 13.0 |
| 2 | Inner surface of the cover | 13.0 |
| 3 | Inner surface of the right side | 1.01 |
| 4 | inner surface of the left side | 1.01 |
| 5 | inner surface of the discharging opining | 1.44 |
Table 4: Determination of Cefdinir in actual swab samples collected from 100 cm2 swabbed areas from different locations of the equipment train (V- Blender).
HPLC and computer simulation methods were used to study the Chiral recognition and mechanism of Atracurium besylate isomers on a CDMPC column. Several mobile phase solvents and HPLC conditions were considered. The result obtained suggest that the best solvents and chromatography condition for the separation of Atracurium besylate isomers on a CDMPC column is ANC: KPF6, (0.1 M, pH 3.0-3.35), flow rate 0.5-1.0, 30-38°C 280 mm. It was observed that pH, temperature, and buffer concentration influenced enantioselectivety as well as retention time. Molecular docking aimed at explaining the chiral recognition mechanism between Atracurium besylate isomers and the CPMD CSP column shows that chiral recognition between Atracurium besylate isomers and CSP depended on hydrogen bonding, π-π interaction, and vander waal force. As such the choice of mobile phase should take into consideration solvents effect on π-π interaction as well as Hydrogen bonding.
Let God Almighty take all the glory for this work. We would like to however acknowledge the support of Xiangju Pharmaceutical Company, China. Special thanks go to the staffs of the Quality Research Department, Xiangju Pharmaceutical Company.