Journal of Chromatography & Separation Techniques
Open Access
ISSN: 2157-7064
ISSN: 2157-7064
Research Article - (2015) Volume 6, Issue 7
Organotin compounds were extensively used as powerful biocides in anti-fouling paints and pesticide formulations, particularly tributyltin (TBT), and are recognized as priority pollutants by the european European Water Framework Directive (WFD). Environmental Quality Standard set by the WFD for TBT is fixed at 0.2 ng.L-1 for water samples which impose the use of very sensitive analytical techniques to perform such analysis. GC-ICP-MS is the only analytical technique able to achieve such low concentration level, but the expensive equipment requires also qualified personnel to operate, so not all routine laboratories can afford to use it. Preconcentration methods are therefore a good alternative to obtain a more concentrated and cleaner sample extract and later use an easier and affordable analytical technique like GC-MS. In this work, a new method to analyse organotin compounds in water samples using a preconcentration step with polydimethylsiloxane sorbents was developed and validated. The analytical method exhibited linearity higher than 0.9967 for all compounds. For butyltin compounds, LOQ were between 5.7-20.1 pg.L-1 with precision below 8%. For methyltin compounds, LOQ were between 26.9-106 pg.L-1 with precision below 22%. Matrix effects were evaluated for simulated synthetic estuarine and river waters and was then applied to real estuarine and river water samples. Very good recoveries were obtained for butyltins ranging between 87% and 131%. Methyltins, however, exhibited recoveries between 26% and 118% as a result of matrix effect no accurately corrected by the quantification by external calibration.
Keywords: Organotin compounds; Preconcentration; Polydimethylsiloxane; Water samples
Organotin compounds are used in the industry since the 40s, when they were found to prevent discoloration and embrittlement of polyvinyl chloride (PVC) under heat and light. Nowadays, 70% of the organotin production is still used in PVC application [1]. Later, the biocidal properties of trisubstituted organotins were discovered and their introduction in anti-fouling paints began in the 1960s. These antifouling coatings inhibit the natural settlement of marine organisms on vessel hulls, which cause frictional drag and consequently reduce ship speed, or increase the fuel consumption in order to maintain speed [2].
The nefarious effects of organotin-based anti-fouling paints started to be clearly visible in the early 80s. In France, oyster farms registered 80%-100% of individuals with abnormalities and similar effects were suspected in the Tagus estuary and the Spanish coast [3]. This lead to the complete prohibition of the use of tributyltin (TBT) in anti-fouling paints in January 1st, 2008 [3,4].
The environmental quality standards (EQS) set by the water framework directive in water samples for TBT is 0.2 ng.L-1 [5] which requires very sensitive analytical methods. GC-ICPMS is often used to quantify organotins and achieve such low limits of quantification. However not all routine laboratories can afford this expensive technique which demands qualified personnel to operate [6]. An alternative solution is to improve the extraction technique used to obtain a more concentrated and cleaner sample extract and later use an easier and affordable analytical technique like GC-MS.
New pre-concentration techniques are being developed, some of which handmade and considerably low-cost. Polydimethylsiloxane was first used as a solid sorbent in solid-phase microextraction (SPME) [7] and later in stir-bar sorptive extraction (SBSE) [8]. Both these techniques were already applied to the determination of butyltin compounds [9-13]. Another PDMS-based alternative extraction technique is the extraction using PDMS rods (silicon rods, SR, or silicon tubes, ST) which were used in the analysis of organic compounds [14,15], showing equivalent performance to SBSE. Nevertheless, this is the first time these solid sorbents are applied to the analysis of organometallic compounds. Having the same composition as stir-bars, the big advantage of the SRs or STs is their flexibility, as each user can vary their length and even divide the rod/tube in several “replicates” of the same sample. Their robustness and low cost are also important features, while stir-bars are fragile and breakable. On the other hand, since they are not yet available in a commercial format, their composition might vary depending on suppliers, and the material might not be as pure as the PDMS applied in the SBSE coatings [16].
The aim of this work was to develop and validate SRs or STs as new pre-concentration sorbents for the quantification of organotin compounds in water samples.
Reagents and standards
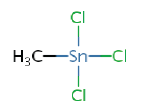
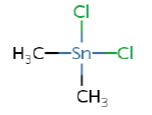
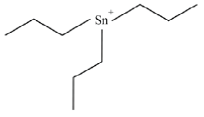
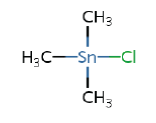
Tributyltin (TBT) chloride (96%), dibutyltin (DBT) dichloride (97%), monobutyltin (MBT) trichloride (95%) were obtained from Sigma-Aldrich, whereas trimetyltin (TMT) chloride (98%), dimetyltin (DMT) dichloride (95%), monometyltin (MMT) trichloride (98%) were obtained from Strem Chemicals (Newburyport, MA, USA). The target analytes are resumed in Table 1 as well as their octanol-water partition coefficient. The isotopically enriched butyltin species used were purchased from ISC Science (Oviedo, Spain): a mix of MBT, DBT and TBT enriched in 119 Sn (82.4%) at 0.110, 0.691 and 1.046 μg.g-1 respectively.
| Analyte | Log Kow | Analyte | Log Kow |
|---|---|---|---|
Monobutyltin (MBT) |
0.18a | Monomethyltin (MMT) |
− 2.15a |
Dibutyltin (DBT) |
1.89a | Dimethyltin (DMT) |
−2.18 to −3.1a |
Tributyltin (TBT) |
3.9 – 4.9b | Trimethyltin (TMT) |
n.i. |
a(Dobson et al.); b(Bangkedphol et al.); n.i.: No information available
Table 1: Chemical structures of the target organometallic compounds and their log KOW.
All stock solutions (1000 μg.g-1 as Sn) were prepared by dissolving the corresponding salt in a 3:1 mixture of acetic acid/methanol and were kept in the dark at 4°C until use. Working solutions of the organotin compounds were prepared daily before analysis by dilution of the stock solutions with 1% HCl in ultrapure water.
Hydrochloric acid (HCl, 33-36%, ultrexII ultrapure reagent) and glacial acetic acid (HAc, Instra-analyzed) were purchased from J.T. Baker (Phillipsburg, NJ, USA) and sodium acetate trihydrate (NaAc, puriss p.a.) from Riedel-de-Haën (Seelze, Germany). Sodium tetraethylborate (NaBEt4) with 98% purity were purchased from Merseburger Spezialchemikalien (Germany). Sodium chloride (>99.5%) used to modify the ionic strength of samples was obtained from Avantor Materials (Deventer, The Netherlands) and humic acid sodium salt (technical mixture, 50-60%) was purchased from Alfa Aesar (supplied by VWR, Fontenay-sous-Bois, France).
Water sampling and storage
Estuarine and river water samples were collected in the Adour River (southwest of France) directly into 1 L borosilicate bottles (previously cleaned as described below). Whole-water samples were acidified to 2% with pure glacial acetic acid and placed in the storage cold room at 4°C until sample preparation.
Cleaning procedure
All glassware was carefully cleaned before use by soaking overnight into a solution 10% nitric acid followed by a solution 10% hydrochloric acid and finally in milli-Q water (18.2 MΩ). The silicon rods and tubes were previously soaked overnight in isooctane (or in the appropriate solvent, in the particular case of different solvent testing), dried immediately before use with a lint-free tissue and discarded after use.
Silicon-tube (ST) extraction method
One 0.8-cm length ST was added to 100-mL sample containing 5 mL of HAc/NaAc buffer (pH 5, 0.1 mol.L-1) and previously spiked with the appropriate amount of isotopically enriched butyltin species (119TBT, 119DBT and 119MBT). The pH was then re-adjusted with ultrapure HCl to pH 5. The organotin species were ethylated by adding 1 mL of isooctane and 1 mL of NaBEt4 1% (w/v) prepared daily, followed by 5 minutes of vigorous shaking. The ST was recovered, transferred to a 1.5 mL conic tubes (Eppendorf) were 300 μL of isooctane were added and left to complete desorption in the ultrasounds bath for 10 minutes. The organic solvent was recovered into a 300 μL glass insert in a GC-vial and the GC-ICP/MS analysis was performed within 24 hr.
GC-ICP-MS analysis
A Thermo X Series 2 inductively coupled plasma-mass spectrometer (ICP/MS) coupled to a gas chromatograph (GC) (Thermo Fisher, Waltham, MA, USA) by a commercial GC-ICP/MS interface (SilcoSteel, 0.5 m length, inner i.d. 0.28 mm and o.d. 0.53 mm, outer i.d. 1.0 mm and o.d. 1.6 mm, Thermo Fisher) was used [17]. The chromatographic separation was performed in a (30 m × 0.32 μm i.d. × 0.25 μm coating) HP-5 capillary column (Agilent Technologies, Santa Clara, CA, USA) with the following oven program: start at 40°C for 0.5 minutes, increase at 20°C.min-1 until 50°C, then increase at 50°C.min-1 until 290°C and hold for 1 min. Two μL of sample were injected in the GC inlet at 280°C, the carrier gas (He) was set 1.5 ml.min-1 and the interface temperature to 290°C. The ICP-MS analysis was performed with 1250 W of forward power, plasma gas flow at 15 L.min-1, nebulizer gas flow at 0.6 L.min-1 and finally the make-up gas flow at 0.3 L.min-1. The performance of the instrument was optimized with liquid standards. Dwell time for Sn isotopes (116, 117, 118, 119, 120) was 30 ms and Sb (isotopes 121 and 123, dwell time=5 ms) was measured to check the mass bias in each chromatographic run. Butyltin species were quantified by speciated isotope dilution mass spectrometry (SIDMS) by using a mixed isotopic spike solution containing 119MBT, 119DBT and 119TBT, which takes into account the cross-species transformations, the loss of analytes during sample preparation and the signal drift. Methyltin compounds, on the other hand, were determined by interpolation on the external calibration curve, because no isotopic tracers are available for these species.
Several parameters were previously tested and optimized, such as the geometry of the sorbent phase, the nature and amount of solvent used for the desorption from the extracting phase (also known as back extraction), whether the use of ultrasounds helped desorption, the amount of sorbent phase and the extraction time.
Influence of the geometry of the sorbent phase: STs vs SRs
In this work, PDMS was tested in 2 different forms: rods and tubes. The rods are compact and have 1 mm of diameter, while the tubes have an internal surface, resulting in 3 mm of external diameter and 2 mm of internal diameter. The response obtained (Figure 1) is the same for both forms, while the surface area of the silicon rod is almost 2 times bigger than the tube. Previous tests performed to evaluate differences in the surface of both materials revealed that the tubes and the rods did not exhibit the typical isotherm profile of a porous material (data not shown). This was the first indication that the phenomenon behind the trap of analyte in PDMS is not adsorption into the surface pores, but migration through the polymeric net, which is normally called sorption [18]. The second evidence of this fact is the response obtained when the same mass of sorbent (rather than the same length) was compared. A tube fragment of 2 mm length and a rod fragment of 12 mm exhibited the same mass, 10 mg, and their responses were compared. Figure 1 shows that both PDMS forms presented similar sensitivities for the studied compounds, reinforcing the hypothesis that a sorption phenomenon was occurring. Silicon tubes were therefore chosen to proceed with further optimization.
Influence of the nature and the volume of back extraction solvent
Synthetic water samples prepared with ultrapure water and all analytes at 1 ng.L-1 were extracted with ST and SR and then recovered in different solvents (hexane, isooctane, acetonitrile and ethylacetate). Results are shown in Figure 1. Isooctane was the solvent exhibiting the higher responses for all the organotin compounds and was then chosen for the optimized procedure.
The use of these solvents with such different hydrophobic/ hydrophilic properties had the purpose to evidence the hydrophobic/ hydrophilic properties in the studied molecules. In fact, Figure 1 shows that the most hydrophilic solvent (acetonitrile) is the one that exhibits a weaker capacity to recover analytes from the organic phase, which translates in the lowest response of analytes in peak area. Peak areas increase with decreasing polarity (or increasing hydrophobicity) of the solvents, which proves the affinity of the hydrophobic molecules to the hydrophobic solvent. It is important to highlight that the sorption of the molecules into the solid sorbent occurs after derivatization with sodium tetraethylborate, which provides ethyl groups to the organotin molecules and grants them a more hydrophobic character.
The volume of solvent used for the back extraction is critical, because too little volume does not extract all the analytes from the sorbent phase and too much solvent cause’s unnecessary dilution of the extract. Three separated fractions of 300 μL of isooctane were successively added for the back extraction in order to determine the percentage of analytes recovered in each fraction. The results, shown in Figure 2, show that with 2 fractions of 300 μL, 90% of the analytes are eluted from the sorbent into the solvent extract. However, with only one portion of isooctane, 80% of the analytes are recovered (except MBT) with no dilution of the extract, improving sensitivity and, consequently, analytical performances of the method.
Influence of the use of ultrasounds for the back extraction
The use of ultrasound to extract the organotin analytes from the sorbent was also evaluated and, as shown is Figure 3, better results were obtained when the back extraction was carried out in ultrasound bath for 10 minutes.
Influence of the amount of sorbent phase
Five sequential extractions were made, each with one segment of 2 mm of sorbent, in order to evaluate how many segments were needed to extract the totality of analytes from the synthetic water samples. Theses synthetic water samples were prepared with ultrapure water and spiked to a final concentration of 1 ng.L-1. Results (Figure 4) clearly show that more than 90% of the analytes are recovered with 4 segments, corresponding to 8 mm of sorbent phase. This amount of ST was further used for the method validation and the real samples analysis.
Influence of the extraction time
The speed and turbulence at which the simultaneous derivation/ extraction step is performed has a major effect in its efficiency, so both shaking vigorously and stirring at 900 rpm were evaluated (Figure 5) in synthetic samples spiked with organotins at 1 ng.L-1. The optimization of this step is crucial, because it allows the compounds to be transformed into more volatile substitutes and trap them into the organic phase, usually isooctane. Here, the organic phase was replaced by the 8 mm ST and the results obtained are represented in Figure 5.
Evaluation of the matrix effects
Matrix effects were evaluated by preparing different synthetic water samples (containing 1 ng.L-1 of butyl- and methyl-tins) at different salt and humic acid concentrations in order to simulate estuarine and riverine waters. Recoveries were calculated by comparing with no salt and no humic acids addition to the synthetic solutions (Figure 6).
The increasing ionic strength of the solution is usually one of the matrix modifications performed to optimize trapping the hydrophobic compounds into the organic phase. However, the presence of salt at 35 g.L-1 decreased the sorption of the compound into the ST. On the other hand, the presence of humic acids severely affected the sorption of these compounds no matter the concentration at which they were present. This matrix effect is higher for butyltins than for methyltins, but while for butyltins the trisubstituted molecule is the most affected (humic acid effect: TBT>DBT>MBT), for methyltins it is the opposite (humic acid effect: MMT>DMT>TMT) indicating that the derivatized molecule is more hydrophobic than the original ionic compound and therefore adsorbs more onto the organic matter.
Analytical performances
After optimization, figures of merit of the method were determined and are presented in Table 2. Linearity (represented as correlation coefficient) higher than 0.9967 was obtained for all compounds. LOD and LOQ for methyltins (between 8.1-31.9 pg.L-1 and 26.9-106 pg.L-1 , respectively) were - in average - one order of magnitude higher than for butyltins (between 1.7-6.0 pg.L-1 and 5.7-20.1 pg.L-1 , respectively) because the latter were calculated through isotope dilution analysis and species specific enriched isotopes are not available for methyltins. There are not many recent analytical publications on the determination of methyltins in water samples using GC-ICP-MS as separation and detection technique, but when compared to methods recently developed for landfill leachates, LOD obtained in this study are 150 to 800 times lower [19,20]. Butyltins also exhibit very low limits of detection, only closely achieved by techniques like solid phase extraction (SPE) and stir-bar sorptive extraction (SBSE) coupled to high performance analytical techniques like GC-ICP-MS and GC-MS-MS [21].
| Linearity (R2) | LOD | LOQ | Precision (n=3) | ||
|---|---|---|---|---|---|
| LOQ -- 3 ng.L-1 | pg.L-1 | pg.L-1 | % at 0.1 ng.L-1 | % at 1 ng.L-1 | |
| TMT | 0.9985 | 31.9 | 106 | 17 | 1.8 |
| DMT | 0.9989 | 11.7 | 39.1 | 22 | 2.0 |
| MMT | 0.9999 | 8.1 | 26.9 | 3 | 1.2 |
| MBT | 0.9968 | 6.0 | 20.1 | 1 | 1.4 |
| DBT | 0.9984 | 1.7 | 5.7 | 5 | 0.1 |
| TBT | 0.9967 | 3.7 | 12.4 | 8 | 1.4 |
Table 2: Figures of merit of the method: linearity, LOD, LOQ and precision.
In what concerns precision, the quantification method performed for the two families of compounds influenced the results obtained: for methyltins precision was below 22% while for butyltins was below 8%.
Application to real samples
Estuarine and river water samples were collected in the Adour river (southwest of France) and their physical-chemical data are described in Table 3.
| Sample | Barre | Pont Rouge |
|---|---|---|
| pH | 7.57 | 7.65 |
| Temperature | 8.68°C | 8.76°C |
| Conductivity | 984 µS/cm | 225 µS/cm |
| TDS | 420 ppm | 112 ppm |
| DOC | 15.8 mg/L | 16.2 mg/L |
Table 3: Physical-chemical parameters of water samples collected in the Adour River.
Both samples were analyzed with the developed method but organotins were present in concentrations below LOQ. Therefore, both samples were spiked with a mixed solution of all organotin compounds up to a concentration of 0.1 ng.L-1 (an example of a chromatogram of the enriched sample is shown in Figure 7). Recoveries were calculated and are represented in Table 4.
| TMT | DMT | MMT | MBT | DBT | TBT | |
|---|---|---|---|---|---|---|
| Barre | 26 | 112 | 48 | 91 | 87 | 131 |
| Pont Rouge | 26 | 118 | 40 | 93 | 90 | 118 |
Table 4: Recoveries (%) determined for estuarine and river water samples spiked with an organotin mixed solution to a final concentration of 0.1 ng.L-1.
The butyltin compounds quantified by isotope dilution analysis provided acceptable results with good recoveries ranging between 87% and 131%. Methyltins, however, were quantified by external calibration and exhibited poorer recoveries, between 26% and 118%. The method developed in this work to quantify organotins in river water samples has provided very good results when used with isotope dilution analysis.
In this work, a low cost preconcentration technique was applied to water analysis in order to quantify organotin compounds. Silicon tubes made with PDMS are cheap and easy to adapt to water analysis as the sample preparation is very similar to stir-bar sorptive extraction (SBSE).
The method exhibited linearity higher than 0.9967 for all compounds. For methyltins, LOQ were between 26.9-106 pg.L-1 and precision was below 22%. For butyltins, LOQ were about five times lower, between 5.7-20.1 pg.L-1, and precision below 8%, as a result of using species specific isotope dilution for the quantification of these species. When applied to spiked environmental water samples, very good recoveries were obtained for butyltins: between 87% and 131%. Methyltins, however, exhibited recoveries between 26% and 118% as a result of their quantification by external calibration.
J. Cavalheiro is grateful to the French Minister of Education and Research for her PhD Grant (Doctoral School ED211, Université de Pau et des Pays de l’Adour). This work was financially supported by the Conseil Général des Pyrénées Atlantiques and the EU Interreg funding in the framework of the ORQUE SUDOE project.