Journal of Tourism & Hospitality
Open Access
ISSN: 2167-0269
ISSN: 2167-0269
Research Article - (2023)Volume 12, Issue 5
Nakuru County is located in the central rift and has a diverse range of tourist attractions for investors and tourists. Although the attractions have economic benefits attributed to park entry fees already stipulated by the national and county governments and income from food and accommodation, there are non-financial values that are associated with intangible benefits that come with a conductive environment and conservation. The research employed qualitative and quantitative research methods to collect primary and secondary data on tourist socio-economic characteristics and their willingness to pay for the conservation of the destinations. The research used a sample of one hundred and ninety-six tourists, selected using simple random sampling technique. The study collected and analyzed primary and secondary data through descriptive and inferential statistics, while regression analysis was used to verify constructs that were adopted as scales for willingness to pay more. Tourists' choice of destinations and willingness to pay more for conservation efforts within the tourist destinations varied between international and domestic tourists; and were determined by tourist characteristics such as age, education level, country of origin, income, and length of stay in a given destination. The results show that 71.90% of the sampled tourists were willing to pay more for the conservation of the destinations, and particularly, more domestic tourists were willing to pay more for the conservation of the destinations than their international counterparts. The results showed that more female tourists (49%) were willing to pay more for conservation than male tourists (8%). The findings provide useful insights to the County Government of Nakuru to focus on promoting attractions and conservation programmes that target female tourists and recognise the less documented benefits with a focus on the landscape lens.
Tourist attractions; Ecosystem services; Environmental practices; Contingent valuation; Natural resources
SEF: Socio-Economic Factors; SPA: Services Provided in the Attractions; DA: Distance to/location of the Attraction; MT: Mode of Transport; QAF: Quality of Accommodation Facilities; CO: Country of Origin; VF: Variety of Services in Hospitality Facilities; and LS: Length of Stay
Tourism is essential for emerging and advanced economies of export diversification. This can be through a region's cultural, social, and economic development more than any other sector (United Nations World Tourism Organisation (UNWTO)) [1,2]. In Europe, whereas some countries benefit, in others, researchers point out that lack of Vision and leadership among the locals, entrepreneurial skills, access to credit investments, and resource mobilization affects the positivity in villages' tourism and hospitality investments, such as in Romania and Austrian [3]. In Africa, researchers state that tourism can improve the economies of rural areas if invested, thus alleviating poverty and migration to cities [4]. The country's development blueprint (Vision 2030) identifies tourism as one of the leading sectors in achieving the Vision's social and economic pillars.
Tourism has greater potential to contribute to a region's national and local development (culturally, socially, and economically) than any other industry [5]. It can be an engine for sustainable economic development and growth in any area (UNWTO) [6]. Globally, Sustainable Development Goals (SDGs), 8 Decent work and economic growth, 11 Sustainable cities and communities, and 12 Responsible consumption and production contribute immensely to the creation of employment opportunities, economic development, and local promotion of development hence have relevance to conservation and environmental management.
The benefits of tourism in a particular destination are dependent on several factors. The factors include activities or holiday types they have planned for. The key drivers of tourist visits, international or domestic, can be classified into location, infrastructure, culture, and trends [7]. In line with Vision 2030, tourism is among the pillars that will enable the attainment of sustainable sources of revenue for the youth and women as they are the most employed in the industry. The Kenya Kwanza Manifesto outlines key areas it intends to use to attain affordable housing, employment for the youth, and empowerment of hustlers who include but are not limited to farmers, market vendors, and small and medium enterprises [8]. Thus, the tourism and hospitality investments in practicing sustainable practices through the purchase of locally grown food items and other products, as well as the use of locally available services, will attract tourists to that particular destination. The income generated will enhance the lives of the local community to continue with conservation efforts encouraged by the county and national government.
Studies about sustainable tourism have analyzed “Tourists' Willingness to Pay” (WTP) on a common recurring theme is environmental protection, and conversation is an important consideration [9-11]. Other studies support the relevance of WTP in indicating that “tourists are willing to pay more for the sustainability” of the different tourism and hospitality-related enterprises such as in restaurants, hotels, transport, and products in Europe, Asia, and America [12-14]. These studies have been done in developed countries, but very few have been done in Africa, specifically in the study area. The current study establishes the Kenyan experience on WTP of tourists visiting attractions and the value they attach to initiatives that promote sound environmental practices.
Sustainable management positively impacts hospitality organizations (UNWTO) [1,2]; the same accord does not exist in “examining the willingness to pay extra for sustainable consumption, despite acknowledging that a tourist with higher environmental awareness will be more inclined to pay a surcharge in a sustainable hotel than a tourist with lower environmental awareness” [15]. Therefore, empirical studies deduce that tourists are willing to pay extra for accommodation in a sustainable facility that promotes environmentally sound practices [14]. Other scientific studies have reported a contrary opinion where tourists with limited orientation and knowledge of the sustainability of tourism and hospitality investments often decline to pay more [16].
Previous studies have addressed how “tourists’ sustainability attitudes affect their willingness to pay for environmentally sound practices in tourism and hospitality investments” [17]. A study in Malaysias' Endau-Rompin National Park on users' preference and willingness to pay to promote conservation established that the local visitors were proposing a higher fee than the one they were paying to enhance biodiversity [18]. The study proposed that research should be done to establish tourists' willingness to pay more in other areas as tourists know the benefits of biodiversity. Doran, et al. investigated attitudes, “efficacy beliefs and willingness to pay for environmental protection while traveling” [19]. They established that attitudes, self-efficacy, and collective efficacy accounted for 30% of the variance in willingness to pay for environmental protection. The study recommended that studies be done to establish personal responsibility of tourists' “willingness to pay for environment conservation in a destination as a personal responsibility". Li and Nitanan researched tourists' willingness to pay a conservation fee in Kuala Selangor, Malaysia. Their study “indicated that age, education, gender, and attitude impacted willingness to pay more". The study recommended that “single and double-bound Contingent Valuation Method formats for willingness to pay be considered in future studies" [20].
Placing a “value on tourism services in general, for example, heritage sites have been studied by economists due to their monetary importance” [21]. Rasoolimanesh, et al. refer to the “cultural capital associated with cultural heritage, considering that such heritage can generate a flow of products and services and provide economic benefits” [22]. Several demand-side “studies on the sustainability of tourism services have explored the extent to which tourists are willing to make sacrifices to ensure a more sustainable travel experience”. However, “hotel customers generally prefer luxury rooms and value the provision of toiletries; many were willing to sacrifice service quality” [10,17].
Therefore, this study determined WTP for environmentally sound practices in selected tourist destinations and their related hospitality services, including the socio-economic factors such as attractions, distance to the location of the attraction, mode of transport, quality of accommodation facility, country of origin, variety of services in the hospitality facility and length of stay. It is necessary to establish what makes tourists choose what to pay for and where and why they pay for a particular service and product.
The “Contingent Valuation Method (CVM) has been the most widely used to appraise cultural goods of all existing economic appraisal methods for conservation practices” [9,23]. There is no universally accepted scale for computing sustainability in different tourism scenarios [23]. However, several studies have made noteworthy progress in providing operative options. For instance, Asmelash and Kumar “developed and validated a list of sustainability indicators for tourism destinations based on the perceptions of residents, tourists, and local stakeholders" [16]. They established four scopes of sustainability: Sociocultural, environmental, economic, and institutional, with each dimension being correlated with residents, tourists, and local stakeholders. This “effectively expands the triple bottom-line principle of sustainability (environmental, sociocultural, and economic) in tourism destinations” [17]. In contrast, destination sustainability must consider these four (environmental, sociocultural, economic, and institutional) dimensions. Li, et al. “Contend that tourism development should be planned and operated to secure longterm benefits for all actors involved, with special consideration of the extent of involvement of the local community in its overall development process” [21].
Despite the importance of these principles, as noted by Font and McCabe, “Sustainable destinations and services need the support of consumers, who must be convinced to choose responsible products and services rather than their non-responsible counterparts” [13]. Consequently, no “analysis of destinations’ sustainability would be complete without considering the demand side, i.e., the predisposition of tourists to choose sustainable tourism destinations and engage in sustainable behavior at the chosen destination” [17].
Nadalipour, et al. report that one cannot address “destinations' sustainability and competitiveness without considering the economic, sociocultural and ecological dimensions and relevant stakeholders involved in tourist activity, which naturally includes consumers” [24]. Generally, “this shows that tourists who value sustainable practices are more inclined to choose services and goods, especially for hotels that employ environmentally sound practices than those who do not” [4]. Lee and Mijelde show that consumers' behavioral intentions were positively related to the “overall image of green hotels” [25,26].
Study area
The Nakuru County is situated in the Rift Valley of Kenya. The geographical coordinates of the county are 00 17′ 0″ South, 360 4′ 0″ East [27]. Its original name is Nakuru. The County Government of Kenya (GoK) states that the county covers an area of 7,495.1 km2. This includes 5,039.40 km2 of arable land, 8,521 km2 of nonarable land, and 202 km2 of water mass (of lakes Naivasha, Nakuru, and Elementaita). According to GoK, “the lake basin enjoys a typical equatorial climate with its characteristic high irradiance and high potential evaporation all year round, mitigated by its moderately high altitude, which can be felt during typically cool early mornings (8°C-10°C)”. “The diurnal temperature excursion can be relatively high when not mitigated by the presence of trees, with early afternoon maxima reaching over 28°C” (GoK) [28]. “The land is the main source of livelihood for the people of Nakuru County, Kenya” GoK) [29]. The county populace participates in other socio-economic activities in “the private sector, mainly in the flower, tea, and coffee farms, construction, academic institutions, public transport, wholesale and retail trade, hotels and restaurants, and jua kali sectors” (Nakuru County Integrated Development Plan (NCIDP). The “National Population and Housing Census reported that the county's population was approximately 1.6 million, with 804,582 males and 798,743 females in 2009”. With a growth rate of 3.05%, the population was estimated to grow to 2.4 million in 2022 (NCIDP) (Figure 1) [28].

Figure 1: Nakuru County Map; Source: (NCIDP, 2013; Author, 2023).
Research methodology
This According to the theoretical framework, the Contingent Valuation Method (CVM) was used to study the tourists' willingness to pay. CVM is a statement of preference assessment in a hypothetical market, where the questionnaire is used for direct investigation and asks people to improve the environmental benefits or a measure of willingness to pay. Davis in 1963 first used CVM in valuing the recreation of Maine. Today, the CVM method is one of the most used non-use value assessments of environmental or ecosystem services valuation.
This study investigated whether the potential tourists were willing to pay extra to be gain more accessible facilities in the attraction sites. Using the “Contingent Valuation Method, a logit model was used to determine the probability that tourists were willing to pay extra money” to access and enjoy additional benefits attributed to natural resource conservations and/or sound environmental practices within the tourism facilities. The study was conducted in Nakuru County, Kenya, “an area traditionally characterized by large tourist flows which decreased by a large margin during the COVID-19 pandemic” [28].
Sampling and data collection
Based on GoK, “tourism sustained a month-on-month growth rate of 12% from January to December 2021, with a total of 870 465 tourists within the country”. This “growth was sustained by domestic tourists, “which grew by 30% compared to 2020, while international tourists grew by 4% over the same period” [28]. This informed the basis of the sample size for the study. According to Mugenda and Mugenda, “when the study population is more than 10 000, between 10% and 30% of it is representative” [30]. Kothari and Garg support studies of about 10% of smaller populations being ideal to be sampled [31]. Hence, Mugenda and Mugenda recommend the following formula:
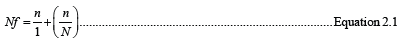
Where:
Nf=desired sample size when the population is less than 10,000,
n=desired sample when the population is more than 10,000 (384)
N=estimate of the size.
Thus, Nf=384/1+(0.052)384=195.92 so the sample was estimated to be 196 people.
Response rate
A hundred and ninety-six (196) questionnaires were distributed. From the collected questionnaires, 20 were not completed at all, while 23 were incomplete and complete feedback was obtained from 153 tourists. This gave a response rate of 78% from the study. Mugenda and Mugenda, “state that a response rate of 60% is good and a response rate of 70% and over is excellent”, this implies that the 78% response rate obtained for this study was suitable for data analysis and presentation [30].
Binary logistic model
Using a binary logistic model to analyze the survey data, the study established the relationship between each variable and whether the tourists were willing to pay for environmental protection expenses or non-monetary benefits associated with different tourism facilities. In the binary logit model, the assumption is that y is a binary categorical variable of 0 or 1, that is, the ‘willing’ assignment and the ‘unwilling’ assignment is 0. (K) is the probability that Y is 1 under the covariate Xi condition. Let k have the k covariates X1, X2……. Xn, then P (y)=β0 + β1 X1 + β2 X2 +…+ βn Xn. The corresponding logistic linear regression model is:
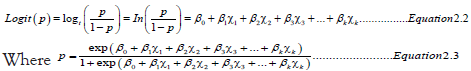
The respondents were asked if he/she is willing to pay for a certain amount of money, B1B1 as a benefit to the tourism facility. If the respondent's answer was no, then it can be assumed that:
0 ≤ WTP < B1 0 ≤ WTP < B1……………………………Equation 2.4
If the answer was yes, then B1 ≤ WTP < B1 ≤ WTP <………..Equation 2.5

As illustrated below there is a constant (α) in the model, this must be added to the sum of the products to give  so the mean WTP becomes

Where:
γ=The dependent variable
β0...βnβ0,..., β6β0,..., β6=Y-intercept (slope of the line)
SEF0 ; SPA1 ;…;LS7 SEF0 ; SPA1 ;…; LS7=Independent predictor variable
By replacing the average value for each variable with the specific X value for the group concerned, the study derived mean WTP for specific target groups.
Origin of tourists and willingness to pay
The tourists visiting hospitality and tourism and hospitality investments in the study area were mainly from Kenya, followed by international tourists (Table 1). In the year 2021, a majority of the tourists came from other parts of Kenya, constituting 37.3%, followed by Nakuru County residents at 32.7%, international tourists at 23.5%, and Nairobi at 6.5%. The likely explanation is that in the year 2021, the Covid 19 pandemic contributed to a reduction in foreign tourists due to travel bans and restrictions as a measure to contain the pandemic.
| Origin of tourists in Nakuru county | Frequency | Percent |
|---|---|---|
| International tourists | 36 | 23.5% |
| Locals/Nakuru | 50 | 32.7% |
| Nairobi | 10 | 6.5% |
| Other parts of Kenya | 57 | 37.3% |
| Total | 153 | 100% |
Table 1: Distribution of tourists based on origin.
Factors influencing a tourist choice of destinations and tourism facilities in Nakuru County
To understand why tourists choose certain facilities within Nakuru County, the tourists were asked to indicate the most important reason for the choice of the tourist facility for their visits, as shown in Table 2. The findings show that most tourists (36.6%) chose the different facilities due to good services, followed by affordability, serenity, accessibility, convenience, and security. Other reasons that were least reported were ambiance, followed by availability of the investments and a good business environment.
| No | Reason | Frequency | Percent |
|---|---|---|---|
| 1 | Good services | 56 | 36.6% |
| 2 | Affordability | 24 | 15.7% |
| 3 | Serenity | 23 | 15% |
| 4 | Accessibility | 18 | 11.8% |
| 5 | Convenience | 11 | 7.2% |
| 6 | Security | 10 | 6.5% |
| 7 | Ambience | 5 | 3.3% |
| 8 | Facilities | 3 | 2% |
| 9 | Good business environment | 3 | 2% |
| Total | 153 | 100% |
Table 2: Tourists reasons for the choice of the tourist facilities.
Tourists willing to pay for conservation efforts: The clients’ willingness to pay was assessed based on various conservation services and products available within the investments. A list of the various services is presented, as shown in Table 3. Table 3 indicates how many tourists were willing to pay more for the services offered within the sub-county and the facilities they visited. The findings indicate that most tourists were willing to pay more for green services, birdwatching, and bike riding while the quality of services offered and homestays and quality of services were the least scored by the tourist.
| Percentage Gender | Male | Female |
|---|---|---|
| 10%-25% | 3 (2) | 11 (7.2) |
| 26%-50% | 61 (39.9) | 122 (79.7) |
| 51%-75% | 78 (51.0) | 19 (12.4) |
| 76%-90% | 11 (7.2) | 1 (0.7) |
| Total | 153 (1400) | 153 (100) |
Note: *The figures in brackets are percentages
Table 3: Percentages of tourists visiting the facility.
Tourist’s willingness to pay more for different tourism services: The calculations were done for those who were willing to pay more for the tourism intangible services. The cost was an average of what the respondents indicated that they were willing to pay more for the indicated services. The findings indicated that most of the services that received the highest percentage of willingness to pay included green services offered at 71.90%. Birdwatching services received the second rating, with 70.59% willingness to pay, ecotourism investments at 54.2% and wildlife viewing/game drive at 50.3% willingness. Tourists or clients rated their willingness to pay for the conservation of the lake, boat rides, fishing, guided hiking, and heritage site viewing at between 68% and 62% In overall, the tourists were more willing to pay more for some services than others. The economic benefit was a hypothetical figure where the tourists were asked to state in percentages of the prevailing cost they were willing to pay for each of the indicated environmentally sound recreational services as shown in Table 4.
| Type of service | No | Yes | Totals |
|---|---|---|---|
| Wildlife viewing/game drive | 79 (51.63) | 65 (42.48) | 153 (100) |
| Heritage site viewing | 61 (39.87) | 92 (60.13) | 153 (100) |
| Bird watching | 45 (29.41) | 108 (70.59) | 153 (100) |
| Cultural dances/performances | 59 (38.56) | 94 (61.43) | 153 (100) |
| Guided hiking | 56 (36.66) | 97 (63.39) | 153 (100) |
| Fishing | 55 (35.95) | 98 (64.05) | 153 (100) |
| Boat rides | 56 (36.66) | 97 (63.39) | 153 (100) |
| Quality of services offered | 138 (90.19) | 15 (9.80) | 153 (100) |
| Homestay services | 102 (66.66) | 51 (33.33) | 153 (100) |
| Nature walks | 50 (32.68) | 103 (67.32) | 153 (100) |
| Bike riding | 48 (31.37) | 105 (68.62) | 153 (100) |
| Green services in the hotel | 43 (28.10) | 110 (71.90) | 153 (100) |
| Conservation of the lake | 60 (39.21) | 93 (60.78) | 153 (100) |
| Conservation of heritage sites | 58 (37.90) | 95 (62.09) | 153 (100) |
| Ecotourism investments | 72 (47.05) | 81 (52.94) | 153 (100) |
Note: *The figures in brackets are percentages
Table 4: Tourists willing to participate in the following conservation activities.
Demographic characteristics and the willingness to pay for conservation in the study area
Willingness to pay for a variety of services was assessed using various elements, starting with socio-economic characteristics of the participants in relation to country of origin, age, level of education, income levels, and gender in relation to willingness to pay for tourism services or products that cannot be measured in direct terms. Findings on the origin of most of the clients were also presented, as shown in Table 5.
| Type of service | No | Yes | International tourists no. | Domestic tourists no. | International tourists' estimated cost | Domestic tourists estimated cost |
|---|---|---|---|---|---|---|
| Wildlife viewing/game drive | 79 (51.63) | 64 (41.83) | 19 | 45 | 7549 | 944 |
| Heritage site viewing | 61 (39.87) | 92 (60.13) | 28 | 64 | 7000 | 875 |
| Bird watching | 45 (29.41) | 108 (70.59) | 32 | 76 | 6118 | 765 |
| Cultural dances/performances | 59 (38.56) | 94 (61.43) | 28 | 66 | 6471 | 809 |
| Guided hiking | 56 (36.66) | 97 (63.39) | 29 | 68 | 6804 | 806 |
| Fishing | 55 (35.95) | 98 (64.05) | 29 | 69 | 6765 | 851 |
| Boat rides | 56 (36.66) | 97 (63.39) | 29 | 68 | 6843 | 845 |
| Quality of services offered | 138 (90.19) | 15 (9.80) | 5 | 10 | 13,098 | 855 |
| Homestay services | 102 (66.66) | 51 (33.33) | 15 | 36 | 10,471 | 850 |
| Nature walks | 50 (32.68) | 103 (67.32) | 31 | 72 | 6510 | 850 |
| Bike riding | 48 (31.37) | 105 (68.62) | 32 | 73 | 6588 | 814 |
| Green services in the hotel | 43 (28.10) | 110 (71.90) | 33 | 77 | 6157 | 824 |
| Conservation of the lake | 60 (39.21) | 93 (60.78) | 28 | 65 | 6804 | 770 |
| Conservation of heritage sites | 58 (37.90) | 95 (62.09) | 29 | 66 | 6980 | 873 |
| Ecotourism investments | 72 (47.05) | 81 (52.94) | 24 | 57 | 8137 | 850 |
Note: *The figures in brackets are percentages
Table 5: Tourist’s willingness to pay more for conservation between domestic and international tourists.
Distribution of tourists by origin and willingness to pay for conservation efforts: Regarding the relationship between the origin of tourists and the willingness to pay for the conservation of tourism and hospitality investments, about 70% of all the tourists visiting the study area were willing to pay more for sound environmental practices (Table 6). The chi-test showed a statistical difference (P ≤ 0.05) in willingness to pay more for conservation efforts between domestic and international tourists. About 45% of the local tourists were willing to pay more for conservation compared to 12% of the international tourists. The likely explanation for this result is the increased awareness of conservation practices in enhancing environmental sustainability, promotions, and the love and ownership of nature by national and county governments.
| Respondents’ | Respondents’ willingness to pay more for conservation efforts | Total | Chi-test | |
|---|---|---|---|---|
| Not willing | Willing | |||
| Domestic | 49 (32) | 69 (45) | 118(77) | Pearson Chi-Square=P ≤ 0.05 |
| International | 16 (11) | 19(12) | 35(23) | |
| Total | 65(43) | 88(57) | 153(100) | |
Note: *Figures in brackets are percentages
Table 6: Distribution of tourists by origin and willingness to pay more conservation efforts.
Distribution of tourists based on the levels of education and willingness to pay for conservation: The study established that formal levels of education of the tourists had a relationship with the willingness to pay for tourism activities that promote conservation (Pearson Chi-Square=122.316; df=3; P ≤ 0.05) as shown in Table 7. For example, over 95% of the tourists with primary and secondary education were unwilling to pay more for tourism activities that conserve nature and the environment in the study area. On the same note, those with middle-level and degree education were more willing to pay for conservation at 98% and 92% respectively.
| The education level of the respondent | Respondents willingness to pay | Total | Chi-Square test | |
|---|---|---|---|---|
| Not willing | Willing | |||
| Primary and below | 24 (15.7) | 1 (0.7) | 25 (16.3) | Pearson Chi-Square=122.316; df=3; P ≤ 0.05 |
| Secondary | 36 (23.5) | 2 (1.3) | 38 (24.8) | |
| Middle-level colleges | 1 (0.7) | 41 (26.8) | 42 (27.5) | |
| Degree and postgraduate | 4 (2.6) | 44 (28.8) | 48 (31.4) | |
| Total | 65 (42.5) | 88 (57.5) | 153 (100.0) | |
Note: *Figures in brackets are percentages
Table 7: Distribution of tourists based on the levels of education and willingness to pay.
Distribution of respondents based on age and willingness to pay: The study shows a relation between the age of the respondents and their willingness to pay for tourism activities that conserve nature and the environment as shown in Table 8. the willingness to pay decreased with age; younger respondents were more willing to pay for conservation than their older counterparts (Pearson Chi- Square=81.696; df=3; P ≤ 0.05). For example, over 80% of those aged less than and/or equal to 30 years and those between 30 and 40 years, about 80% of these two age categories were willing to pay more for conservation compared to between 3% and 13% of those willing to pay more for conservation for age groups above 40 years.
| Age of the respondent | Respondents willingness to pay | Total | Chi-Square test | |
|---|---|---|---|---|
| Not willing | Willing | |||
| ≤ 30 years | 13 (09) | 51 (33) | 64 (42) | Pearson Chi-Square=81.696; df=3; p ≤ 0.05 |
| >30 to ≤ 40 years | 5 (03) | 34 (22) | 39 (26) | |
| >40 to ≤ 50 years | 13 (09) | 2 (1) | 15 (10) | |
| >50 years and above | 34 (21) | 1 (3) | 35 (23) | |
| Total | 65 (42) | 88 (58) | 153 (100) | |
Note: *Figures in brackets are percentages
Table 8: Distribution of respondents based on age and willingness to pay.
The respondent's age was inverse to the willingness to pay for tourism practices that conserve and protect nature. It was established that the younger people were willing to pay more for tourism activities that conserve and preserve nature than their older counterparts. The likely explanation is that they are well-informed and can access environmental conservation information.
Gender of the respondent and willingness to pay: The gender of the respondents influences the willingness to pay for tourist services that support conservation (Pearson Chi-Square=40.337; df=3; P ≤ 0.05) as shown in Table 9. For example, about 49% of the females were willing to pay compared to 0.8% of the males. The gender of the tourist and willingness to pay for tourism services that promote nature conservation and protection was significant P ≤ 0.05).
| Gender of respondent | Respondents willingness to pay | Total | Chi-Square test | |
|---|---|---|---|---|
| Not willing | Willing | |||
| Male | 42 (27) | 13 (0.8) | 55 (36) | Pearson Chi-Square=40.337; df=3; P ≤ 0.000 |
| Female | 23 (15) | 75 (49) | 98 (64) | |
| Total | 65 (42) | 88 (58) | 153 (100) | |
Note: *Figures in brackets are percentages
Table 9: Distribution of respondents by gender and willingness to pay.
Income levels of the respondents and willingness to pay: The respondents' income level was related to willingness to pay more for conservation (Pearson Chi-Square + 0.766; df=3; P ≥ 0.05) as shown in Table 10. From the findings, 45% of those who had a monthly income of less than Kshs. 50, 000 were willing to pay more for conservation as compared to 63% and 70% of those with incomes of KES. 50,000-100,000 and those above KES. 100,000 respectively.
| Income level of the respondent (KES) | Respondents willingness to pay | Total | Chi-Square test | |
|---|---|---|---|---|
| Not willing | Willing | |||
| Less than 50,000 | 18 (13) | 15 (11) | 33 (24) | Pearson Chi-Square = 0.766; df = 3; P≥0.05 |
| 50,000-100,000 | 22 (16) | 51 (37) | 73 (53) | |
| Above 100,000 | 12 (9) | 20 (14) | 32 (23) | |
| Total | 52 (38) | 86 (62) | 138 (100) | |
Note: *Figures in brackets are percentages
Table 10: Distribution of respondents by levels of income in relation to willingness to pay.
Determinants of willingness to pay: The descriptive analyses showed the relationships between the respondent's age, income levels, education level, household head, variety and quality of services, and willingness to pay more for conservation and additional benefits of tourism services. However, descriptive analyses do not determine the influence or effect of each variable and the level of contribution to the willingness to pay for conservation. Therefore, a regression analysis was carried out for this purpose.
As outlined earlier, a binary logistic regression model was used to analyze data to investigate the effect of the independent variables on the willingness to pay for conservation (the dependent variable) per tourist and the contribution of each independent variable to the total explained variation in the willingness to pay for conservation. First, a correlation analysis was carried out to ensure the independent variables under consideration in the model are not correlated (Table 11).
| Constant | Education | Age | Income | Gender | Quality of services | Serenity of the attraction | Location of the facility | Length of stay | Type of respondents | Constant |
|---|---|---|---|---|---|---|---|---|---|---|
| Constant | 1 | |||||||||
| Level of education | -0.74 | 1 | ||||||||
| Age of the respondent | 0.13 | -0.58 | 1 | |||||||
| Levels of Income | 0.08 | 0 | -0.21 | 1 | ||||||
| Gender | -0.22 | 0.29 | -0.44 | 0.36 | 1 | |||||
| Quality of services | -0.38 | 0.13 | 0.03 | -0.29 | -0.06 | 1 | ||||
| Serenity of the attraction | -0.35 | 0.47 | -0.52 | -0.03 | 0.4 | 0.09 | 1 | |||
| Location of the facility | 0.2 | -0.27 | 0.3 | 0.15 | -0.23 | -0.43 | -0.66 | 1 | ||
| Length of stay | 0.18 | -0.33 | 0.36 | -0.14 | -0.36 | -0.27 | -0.45 | 0.03 | 1 | |
| Type of respondents | -0.27 | 0.07 | 0.04 | -0.63 | -0.33 | 0.33 | -0.01 | -0.14 | 0.04 | 1 |
Table 11: Correlation matrix of independent variables effect on willingness to pay for conservation.
Regression analysis
The regression analysis showed that out of the nine independent variables included in the analysis, five variables namely level of education, age, gender, serenity of the tourist attraction and length of stay were significant at 5% level as detailed in Table 12.
| Independent variables | B | SE. | Wald | Sig. |
|---|---|---|---|---|
| Level of education of the respondent | 3.008 | 0.692 | 18.905 | 0.000* |
| Age of the respondent | -2.283 | 0.575 | 15.755 | 0.000* |
| Levels of income | 0 | 0 | 0.438 | 0.508 |
| Gender of the respondent | 3.008 | 1.076 | 7.816 | 0.005* |
| Quality of services offered | -0.155 | 0.906 | 0.029 | 0.864 |
| The serenity of the tourist attraction | 2.664 | 1.218 | 4.783 | 0.029* |
| Location of the tourism facility | -0.746 | 1.089 | 0.469 | 0.493 |
| Length of stay at the tourism facility | -1.351 | 0.668 | 4.098 | 0.043* |
| Origin of the tourist | -0.194 | 1.197 | 0.026 | 0.872 |
| Constant | -5.313 | 2.147 | 6.122 | 0.013 |
| Log-likelihood function | 40.089 | |||
| % Correct prediction | 57.5 | |||
| Cox and Snell R square | 0.668 |
Note: *Significant at 5% level of significance
Table 12: Results of regression analyses.
Aseres and Sira's study in Ethiopia established those sociodemographics, more so, income, satisfaction, environmental attitude, and environmental concern had a positive effect on the WTP of visitors to support the conservation initiatives [32]. This implies that tourists with a good income would be more willing to pay a conservation fee than low-income earners. The study results were in agreement with the findings by Opacak and Wang but inconsistent with the findings by Pedroso and Kungu, which noted that “environmental consciousness, behaviors and awareness of individual users could not affect the WTP” [11,33].
Those with college and university education were willing to pay more for conservation. Aseres and Sira did not factor in education in their model, but the positive coefficient indicated that “WTP was positively influenced by education, which implies that increasing the number of years studying would increase the likelihood of visitors' WTP” [32]. The same results were also revealed in the study by Pedroso and Kungu [33]. The last established that a 1% increase in years of education increases WTP by an average of 0.196%. Therefore, education and awareness positively impact personal maturity and increase one's knowledge and actions to embrace practices that conserve the environment.
In support of the study findings, Aseres and Sira established that younger people were willing to pay more to provide economic support for nature conservation [32]. However, these findings were found to be inconsistent with those of Aseres and Sira, Opacak and Wang, and Pedroso and Kungu, who found that the willingness to pay for environmental conservation increases with age [11,32,33].
The study results indicated that more females were willing to pay more for conservation than males. This outcome contradicts the findings by Wang and Jia, Hejazi, et al., Kamri, et al., who found a positive relationship between willingness to pay for conservation by the male gender who tend to pay more for conservation rather than female respondents [34-38]. Also, the serenity of the tourist attraction and ambiance positively correlated with the willingness to pay. The more the destination's environment was well-kept and conducive, the more likely the tourists were willing to pay to maintain the status quo.
Lastly, the length of stay at the tourist facility had a negative relationship to the WTP, implying that the longer the stay, the less the WTP due to increased expenditure and more costs. However, a study by Bhandari and Heshmat established a positive relationship between the length of stay and WTP, arguing that the longer the stay, the more the spot visits resulting in increased satisfaction and WTP [12].
A contingent valuation survey was conducted involving domestic and international visitors to estimate the willingness to pay for tourism services that conserve nature and the environment in the study area. Using a random survey, the average willingness to pay varied across different services, with the quality of services being ranked the highest with a value of KES. 13,098 for international visitors per visit, followed by homestay services at KES. 10,471 and ecotourism investments at KES. 8,137, while conservation of heritage sites was rated the least at KES. 70.
Domestic tourists, wildlife viewing/game drive had the highest at KES. 944, followed by heritage site viewing at KES. 875 and conservation of heritage sites at KSh. 873 while bird watching scored the least at KES. 765 per local visitor per visit for improvement in environmental conservation. The willingness to pay was strongly influenced by gender, education, age and length of stay and serenity of the tourist attraction. Therefore, the willingness to pay provides useful information to aid decision-making in the study area and beyond.
In conclusion, domestic tourists are more informed about the destinations in the country and their conservation relevance to the country and county. This informs their willingness to pay more for services within a destination compared to international tourists. Through government campaigns for conservation, advertisements and entry fee reduction during holidays, domestic tourists visit the attractions and appreciate their conservation for future generations.
From the findings and discussions on the specific objective, many attributes of tourists inform the willingness to pay more for different services. The predominant one is for gender, where women are willing to pay more for services offered than men. Research should be done to establish why this is the case and what informs their decision to be interested in paying more. The regression analysis of the study variables revealed that five variables namely level of education, age, gender, the serenity of the tourist attraction, and length of stay were significant at a 5% level as detailed in Table 12. This will inform policymakers on what attracts tourists to particular sections with a given destination and what influences willingness to pay more for different services. The aspect of sustainable practices is to have policies and guidelines that assist the tourism and hospitality industry to invest in sustainable cities and decent work and economic gain. The national and county governments should review the entry fees to attractions to increase revenues for conservation initiatives financing.
This work was not funded by any organisation. It was purely done for the award of Doctor of Philosophy in Hospitality and Tourism Management.
[Crossref]
[Crossref]
[Crossref]
[Crossref] [Google Scholar] [PubMed]
Citation: Ondieki EB, Amwata DA, Nyariki DM, Bulitia GM (2023) Tourists Choice of Destinations and Willingness to Pay for Environmental Conservation. J Tourism Hospit.12:530
Received: 20-Sep-2023, Manuscript No. JTH-23-27067; Editor assigned: 25-Sep-2023, Pre QC No. JTH-23-27067 (PQ); Reviewed: 09-Oct-2023, QC No. JTH-23-27067; Revised: 16-Oct-2023, Manuscript No. JTH-23-27067 (R); Published: 23-Oct-2023 , DOI: 10.35248/2167-0269.23.12.530
Copyright: © 2023 Ondieki EB, et al. This is an open-access article distributed under the terms of the Creative Commons Attribution License, which permits unrestricted use, distribution, and reproduction in any medium, provided the original author and source are credited.