Journal of Chromatography & Separation Techniques
Open Access
ISSN: 2157-7064
ISSN: 2157-7064
Research Article - (2013) Volume 4, Issue 4
To ensure that residues of Tirofiban will not carry over and cross contaminate the subsequent product, carefully designed cleaning validation techniques should be investigated. The objective of the present study was to validate simple analytical method for verification of residual Tirofiban in equipments used in the production area and to confirm efficiency of cleaning procedure. An assay method for the determination of Tirofiban residues on stainless steel surface is proposed. The cleaning validation procedure for the equipment was done by the use of cotton swabs moistened with the extraction solution 800 ml of water and 1.36 g of Ammonium acetate and then adjusts at pH (6.0 ± 0.05). In this method symmetry C18 5 μm is utilized as the stationary phase in the HPLC column, (250×0.4 mm) at 40°C using acetonitrile- buffer 6 (29-71%) mixture as mobile phase with injected volume 100 μl with flow rate 1.5 ml/min over the concentration range 1.0-2.9 μg/mL were determined at 227 nm using UV spectrophotometer detector. The recover were 107.96, 100 and 88.78% with RSD below 1.5% for the three assayed concentration levels and with average recovery was 98.89%.
Keywords: Tirofiban; HPLC-UV; Cleaning validation; Residues; Swab analysis
An important step in the manufacture of pharmaceutical products is the cleaning of equipment and surfaces. The cleaning procedures for the equipment must be validated according to good manufacture practice (GMP) rules and guidelines. The main objective of cleaning validation is to avoid contamination between different productions or cross-contamination. This cleaning is verified by determining the amount of residues on surfaces involved in the manufacture process. Cleaning validation consists of two separate steps: the first is the development and validation of the cleaning procedure used to remove drug residues from manufacturing surfaces and the second involves the development and validation of methods for quantifying residuals from the surfaces of manufacturing equipment. Furthermore, many sampling points of the manufacturing facility and the manufacturing equipment have to be tested to verify the occurrence of contamination, for these reasons, an analytical method for residue monitoring should also be rapid and simple [1].
The acceptable limit for residue in equipment is not established in the current regulations. According to the FDA, the limit should be based on logical criteria, involving the risks associated with residues of a determined product. The calculation of an acceptable residual limit, the maximum allowable carryover of active products in production equipment should be based on therapeutic doses, the toxicological index and a general limit (10 ppm). Several mathematical formulas were proposed to establish the acceptable residual limit [1-7].
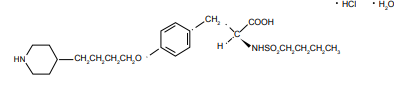
Tirofiban hydrochloride monohydrate, a non-peptide molecule, is chemically described as N(butylsulfonyl)-O-[4-(4-piperidinyl)butyl]- L-tyrosine monohydrochloride monohydrate. Its molecular formula is C22H36N2O5S•HCI•H2O and its structural formula is as follow:
Tirofiban hydrochloride monohydrate belongs to a new class of drugs which is important for patients suffering from vaso-occlusive disorders such as myocardial infarction and unstable angina pectoris [8-11]. Tirofiban is a fibrinogen-receptor antagonist which inhibits platelet aggregation by competitively binding to membrane-bound glycoprotein complex GPIIb/IIIa on the surface of activated platelets, preventing the binding of fibrinogen [12-16]. Aggrastat (Tirofiban hydrochloride) was designed for intravenous administration [12,17,18]. Tirofiban has an elimination half-life of 2 hrs. Renal failure prolongs the half-life and continues inhibition of platelet aggregation refractory to transfusions of platelets. Extracorporeal elimination is the only option to prevent excessive hemorrhage in this condition. A competitive radioimmunoassay (RIA) has already been reported for the determination of Tirofiban in plasma; however, it is not commercially available [19]. Another high performance liquid chromatographic– tandem mass spectrometry (LC–MS–MS) method with an insufficient sample preparation was developed for the analysis of Tirofiban in human plasma. After isolating the analyte by a three step liquid extraction, it was converted into its N-trifluoroacetyl derivative and analyzed by HPLC with atmospheric pressure negative ionization MS– MS-detection. The lower limit of quantification of the assay was 0.4 ng/ ml [20]. Taking the above-mentioned considerations into account, the aim of this study was to develop and validate a simple analytical method that allows the determination of trace levels of Tirofiban residues in production area equipment and to confirm the efficiency of the cleaning procedure. The analytical method reported was validated considering selectivity, linearity, accuracy, precision and limits of detection (LOD) and quantification (LOQ). The stability of Tirofiban samples was also studied.
Reagent and chemicals
Tirofiban reference standard was bought from Sigma, United States. A fixed dose combination (FDC) was obtained from manufacturer AGGRASTAT injection bottle 100 ml produced by Medicure International, Inc. by: Baxter Healthcare Corporation Deerfield, Illinois USA. Ammonium acetate, 85% phosphoric acid, potassium hydroxide and acetonitrile were of chromatographic grade obtained from Merck, Germany. All other chemicals were of analytical reagent grade unless specified. HPLC grade water was prepared by taking reverse osmosis water and passing it through a Milli-Q System (Millipore, Milford, USA).
Extraction solution (buffer pH 6.0) was prepared by dissolving 1.36 g of ammonium acetate in 800 ml of water then adjusted to pH 6.0 ± 0.05 with phosphoric acid. The extraction recovery sampling was realized with Alpha Swab polyester on a propylene handle-TX714A (ITW Texwipe, Mahwah, USA).
Equipment
Chromatographic separation was performed on Agilent 1100 series liquid chromatographic system consisted of a degasser G1322A, quaternary pump G1311A, an automatic injector G1313A, a column oven G1316A and multi-wave-length detector G1315A, all 1100 Series from Agilent Technologies, were controlled by HP Chemstation software. The separation was carried out in Symmetry– C18 analytical column (250 mm×4.6 mm, 5 μm, Waters USA), in the sample preparation procedure, ultrasonic instrument (China) and Orion Model 720A digital pH-mV meter, Orion Ross combination pH electrode (Model 81-02) was used for all pH measurements.
Chromatographic conditions
The mobile phase consisted of 710 ml of prepared buffer pH 6.0 mixes with 290 ml acetonitrile. A 0.45 μm membrane filter (Millipore) has been used for filtration of the mobile phase that was degassed prior to use. Buffer pH 6.0 was used as extraction solution.
All chromatographic experiments were performed in isocratic mode. The mobile phase was pumped at flow rate of 1.5 ml/min with 100 μl injection volume. The column temperature was at 40°C. UV detection was performed at λ227 nm. All calculations were carried out on microcomputer under the Windows XP operating system.
Standard solution preparation
The stock solution of standard Tirofiban was prepared by accurately weighing 20 mg of Tirofiban reference standard and transferring into a 100 ml volumetric flask. 50 ml of extraction solution was added and the content of flask was sonified for 15 min. The solution in the flask was, then, diluted to volume with extraction solution. An aliquot (1.0) ml was further diluted to 100 ml with extraction solution. The final concentration was 0.002 mg/ml.
Sample solution preparation
The selected surfaces (10 cm×10 cm) of stainless steel, previously cleaned and dried, were sprayed with 500 μL of stock Tirifoban standard solution. For the positive swab control at all concentration levels, the extraction solution was allowed to evaporate, the surface was wiped in one direction with wet cotton swab soaked with 10 ml of extraction solution (Tirofiban is soluble in extraction solution pH 6.0) [21]. The swabs were, then, pipette into the swab tubes. Background control samples were prepared from the extraction solution. The negative swab control samples were prepared in the same way as the samples, using swabs, which had not been in contact with the test surface. In addition, samples from test and excipients solutions were prepared according to the placebo of injection bottle premixed content to assure that they did not interfere with Tirofiban determination. Subsequently, the tubes were placed in an ultrasonic bath for 30 min and the solutions were analyzed by HPLC-UV.
Acceptance limit calculation
In the field of industrial pharmacy one of the more time and labor-intensive processes is the cleaning validation of reaction vessel that needs to take place after a particular product has been prepared. Careful examination of the vessel for trace residues is vital to the pharmaceutical manufacturing process as residues can contaminate subsequent products. The maximum allowable carryover (MACO) is the acceptable transferred amount from the previous to the following product. The MACO is determined based on the therapeutic dose, toxicity and generally 10 ppm criterion. Once the maximum allowable residue limit in the subsequent product was determined, the next step was the determination of the residue limit in terms of the contamination level of active ingredient per surface area of equipment. The total surface area of the equipment in direct contact with the product was accounted for in the calculation. The limit per surface area was calculated from the equipment surface area and the most stringent maximum allowable carryover. The 0.1% dose limit criterion is justified by the principle that an active pharmaceutical ingredient (API) at a concentration of 1/1000 of its lowest therapeutic dose will not produce any adverse effects on human health [3]. The calculated limit per surface area (LSA) in the case of Tirofiban was 2.0 μg /swab pro 100 cm2. A stainless steel surface area of 10 cm×10 cm was chosen for practical reasons.
Optimization of the chromatographic conditions
To obtain the best chromatographic conditions, the wavelength for detection, mobile phase composition, column temperature and flow rate were adequately selected. The main objective was to develop an HPLC-UV method that, running in the isocratic mode, allowed the determination of Tirofiban residues collected by swabs, without interference of impurities originating from the swabs, plated and extraction media.
For analysis the combination of water, buffer 6.0, Phosphoric Acid and acetonitrile is frequently used as the mobile phase. The amount of acetonitrile was varied 26.0% to 31.0%, wavelength detector (λ) was varied from 223 nm to 231 nm and flow rate was also varied from 1.20 ml/min to1.80 ml/min. The sufficient tailing factor and plate number were achieved with the proposed mobile phase consisted of 710 ml of prepared buffer pH 6.0 (1.36 g of ammonium acetate in 800 ml of water then adjusted to pH 6.0 ± 0.05 with phosphoric acid) mixed with 290 ml acetonitrile at flow rate 1.5 ml/min. Wavelength 227 nm was selected for detection because the drug has a sufficient absorption and low quantities of Tirofiban may be detected correctly. Furthermore, the calibration curve obtained at 227 nm showed good linearity. Regarding the chromatographic procedure, different C18 columns were evaluated but the Symmetry C18 5 μm (250×4.6 mm) was preferred to improve the plate number and tailing factor. The column temperature was varied 35 to 45°C but the analysis at 40°C was preferred to improve the tailing factor and plate number.
Optimization of the sample treatment
Cotton swabs were spiked with different quantities of Tirofiban and placed into tubes. After the addition of different volumes of a diluting solvent, the tubes were sonified for different times (10, 15 and 20 min) and the solutions analyzed by HPLC after filtration with Millipore millex-HV-PVDF 0.45 μm. The optimum conditions were achieved with 10 ml of pH 6.0 as extraction solvent and sonification time of 15 min. This technique was applied in the subsequent work. The samples were calculated by the following equation:

Then the equation can be simplified to:
Validation of the method
Once the chromatographic conditions had been selected, the method was validated, whereby attention was paid to the selectivity, linearity, limit of detection, limit of quantification, precision, accuracy and sample, standard & mobile phase stability.
System suitability: During performing the system suitability test, in all cases relative standard deviation (RSD) of the peak areas was < 2.0%, the average number of theoretical plates per column was >8000 and the USP tailing Factor ≤ 1.5.
Specificity: Specificity is the ability of the method to accurately measure the analyte response in the presence of all potential sample components (excipients). The specificity of the method was checked by injecting Tirofiban standard, Tirofiban sample, the background control sample, the negative swab control, non-spiked stainless steel (10 cm×10 cm) plate swabbed as described, four standard solutions after storage under destructive condition (80°C for 24 hrs.), (in 0.5 M of hydrochloric acid for 24 hrs.), (in 0.5 M sodium hydroxide for 24 hrs.) and (in H2O2 for 24 hrs.). The samples were chromatographed according to the experimental method to demonstrate the resolution of Tirofiban from any unknown peaks. Tirofiban has chromatographic resolution (Rs) more than 1.5 from other peaks. The results are shown in figures 1a-1f.

Figure 1a: Chromatograms obtained from Tirofiban standard solution, 2 μl ml-1.

Figure 1b: Chromatograms obtained from Tirofiban sample 1.1 μl ml-1.

Figure 1c: Chromatograms obtained from non-spiked stainless steel sample.

Figure 1d: Chromatograms obtained from excipients mixture.

Figure 1e: Chromatograms obtained from negative swab control.

Figure 1f: Chromatograms obtained from background control sample.
Linearity: Linearity of the method was studied by analyzing standard solutions at seven different concentration levels range from 1.0-2.9 μg/ mL with six determinations at each level (n=6). The calibration curve was constructed by plotting mean response area against corresponding concentration injected, using the linear regression least square method. The calibration curve values of slope, intercept and correlation coefficient for Tirofiban are presented in table 1.
| Statistical Parameters | Values |
|---|---|
| Concentration Rangee µg ml-1 | 1.0 - 2.90 |
| Regression equation | Y=75255X- 4.2887 |
| Coefficient of Determination | 0.9996 |
| S(a)-error in intercept | 0.47 |
Table 1: Linear regression data in the analysis of Tirofiban.
Limit of detection (LOD) and Limit of quantification (LOQ): LOD and LOQ were determined based on the standard deviation of the response (y-intercept) and the slope of the calibration curve at low concentration levels according to ICH guidelines [22,23]. The LOD and LOQ for Tirofiban were found to be 0.04 and 0.13 μg/ mL, respectively.
Precision and accuracy: The precision and accuracy of the proposed cleaning validation procedure, reported as relative standard deviation (RSD) and the recovery (%), respectively, were assessed by comparing the amount of analyte determined versus the known amount spiked at three different concentration levels (1.0, 2.0 & 3.0 μg/mL) with 6 replicate (n=6) for each investigated concentration level. The recovery and the RSD values (Table 2) for each level illustrated good precision and accuracy of the method. These precision and recovery results are excellent for the purpose of residue monitoring.
| Amount addedµg ml-1 | Amount foundµg ml-1 | 95% confidence interval % | Recovery % | RSD %n=6 |
|---|---|---|---|---|
| 1.0 | 1.10 | 107.8 -108.1 | 108.0 | 0.159 |
| 2.0 | 2.00 | 101.3 - 99.7 | 100.0 | 0.944 |
| 3.0 | 2.60 | 88.9 - 88.4 | 88.7 | 0.315 |
Table 2: Precision and accuracy of the results obtained from swabbed plates spiked with Tirofiban.
The intermediate precision of the method was investigated by performing five consecutive injections of standard solutions on two different days by different analysts and different reagents. The intermediate precision, expressed as the RSD was found to be 0.18% and 0.28% for the first and second days, respectively. The data obtained suggested that the method exhibited an excellent intermediate precision for Tirofiban standard solution when analyzed on two different days by two different analysts.
Sample and standard stability: The stability of the Tirofiban in the swab matrix and Tirofiban standard solution were tested. The spiked samples and standard solution were stored after analyses in the injector vial in auto-sampler tray at 25°C for 24 hours. All samples and standard solutions were injected into appropriate HPLC system after 24 hours against fresh standard solutions. The stability of the standard Tirofiban solution (2.0 μg/mL) was also inspected after storage for 24 hours at top bench condition with 1.3% difference in results and the samples solutions had been studied after storage for 24 hours at top bench condition with 0.40% difference in results. In both cases, no change in the chromatography of the stored samples and standards were found and no additional peaks were registered when compared with the chromatograms of the freshly prepared samples.
Filter evaluation
Samples and standard solutions of Tirofiban prepared as per analysis method, filtered with Millipore millex-HV-PVDF 0.45 μm and millex–PTFE-0.45 μm, and then compared to the unfiltered samples. The Millipore millex-HV–PVDF 0.45 μm and millex–PTFE- 0.45 μm pore size syringe filter were qualified for use with filter evaluation ratio 101.1% and 100.45 for Tirofiban standard with PVDF and PTFE filter respectively. For samples the filter evaluation ratio 99.86% and 100.35% for PVDF and PTFE filter respectively.
Robustness
In order to test the robustness of the HPLC-UV method, the effect of different chromatographic parameters on the resolution and the concentration of Tirofiban from cleaning samples, was estimated. The amount of acetonitrile in the mobile phase was varied from 26% to 31%, the flow rate was varied from 1.2 ml/min to 1.8 ml/min and column temperature was varied from 35°C to 45°C. The results obtained (Table 3), showed that the change in any estimated chromatographic parameters had no effect on the concentration of Tirofiban from cleaning samples.
| Chromatographic parameter | RSD % | Tailing factor | plate count | sampleresult (ppm) |
|---|---|---|---|---|
| 1)Flow rate (ml min-1) | ||||
| 1.2 | 0.19 | 1.1 | 9925 | 0.148 |
| 1.3 | 0.18 | 1.1 | 9724 | 0.147 |
| 1.5 | 0.16 | 1.1 | 8962 | 0.149 |
| 1.6 | 0.08 | 1.1 | 8474 | 0.148 |
| 1.8 | 0.16 | 1.1 | 7564 | 0.148 |
| 2) Column temperature(°C) | ||||
| 35 | 0.18 | 1.13 | 8573 | 0.146 |
| 37 | 0.50 | 1.12 | 8877 | 0.148 |
| 40 | 0.13 | 1.14 | 8361 | 0.149 |
| 43 | 0.32 | 1.13 | 8365 | 0.148 |
| 45 | 0.14 | 1.13 | 8272 | 0.149 |
| 3) % of Acetonitrile content in the mobile phase | ||||
| 31.0% | 0.15 | 1.18 | 7262 | 0.146 |
| 30.0% | 0.09 | 1.15 | 7709 | 0.149 |
| 29.0% | 0.13 | 1.14 | 8361 | 0.143 |
| 27.0% | 0.11 | 1.12 | 9549 | 0.139 |
| 26.0% | 0.18 | 1.10 | 10179 | 0.135 |
Table 3: Effect of different chromatographic parameters.
Assay of swab samples collected from different locations within the equipment train
Swab samples from different locations within the manufacturing equipment train have been analyzed to determine the residual of Tirofiban. These samples were prepared and analyzed by the proposed method. Some of the results obtained for these samples are presented in table 4.
| Serial no. | Location description | results (ppm) |
|---|---|---|
| 1 | Dosing disc | 1.5 |
| 2 | Lower hopper | 1.1 |
| 3 | Lower connecting sleeve | Less than DL |
| 4 | Upper connecting sleeve | 1.0 |
| 5 | Piston | 1.2 |
Table 4: Determination of Tirofiban in actual swab samples collected from 100 cm2. Swabbed area from different locations of the equipment train (Filling machine).
In conclusion, it is simple to use HPLC-UV method to quantify residues of the active pharmaceutical ingredient Tirofiban on swabs, in support of cleaning validation of pharmaceutical manufacturing equipment. Validation studies showed that the developed HPLC-UV method is selective, linear, precise and accurate. To extract the Tirofiban residues from the surface, a wipe test procedure using a cotton swab is recommended. The recoveries obtained from the stainless steel surfaces were close to 98.9% or higher and without interference from the cotton swab. Stability studies show that Tirofiban samples were, at least stable over the investigated 24 hours. The overall procedure can be used as part of a cleaning validation program in pharmaceutical manufacture of Tirofiban.
The authors would like to thank Dr M A Gabr for providing the drug samples.