Journal of Tourism & Hospitality
Open Access
ISSN: 2167-0269
ISSN: 2167-0269
Research Article - (2017) Volume 6, Issue 4
Having recognized the importance of tourism to economic growth, many researchers have started to argue that tourism growth can also influence the economy and tourism. This paper attempts to test the long-run and short-run relationships between international tourism and Iran’s economic growth by accommodating structural breaks and Bayer and Hanks cointegration test and using the Autoregressive Distributed Lag (ARDL) and Granger Causality to examine the relationships between investment in physical capital and human capital and household consumption expenditures over the period of 1980-2014. The main finding of this study is the TLG hypothesis can be accepted in Iran. The more the country prospers the more stable and sounds are the economic, social and political situations. The prospective tourists will have more confidence to visit Iran.
<Keywords: International tourism, Economic growth, ARDL, Granger causality, Iran
The tourism industry has become an increasingly important stimulating factor for the global economy, as it has been widely reported in many studies [1]. By generating foreign exchange revenues, the tourism industry also stimulates economic growth, creates employment opportunities and contributes increases in investments [2,3]. Moreover, in many countries tourism receipts are important sources of balance between current account and balance of payments deficits [4]. It is generally assumed that the expansion of tourism should have a positive effect on economic growth.
The Iranian economy is a single product economy relying on oil revenues and such dependence has increased the level of the economy of society, so that whenever oil prices rise due to Global changes foreign currency earnings obtained from oil exports in the country gain a more desirable status. Also, because today oil prices are fluctuate due to permanent political problems, even if it is an economic good. But such this increase in income is not so useful for us, because first it is primarily a cross-sectional form. Secondly the necessary planning hasn’t been done on how to apply such incomes because it is unpredicted and therefore not used in the short term. Iran has an unprecedented potential to become a major tourist destination in the world because of its pure landscapes and diverse culture. Iran is a tourist destination with approximately 3.5 million tourism arrivals in 2014 [5]. One question that arises is whether there are limits to the extent that tourism can carry an entire economy forward. It seems reasonable to expect that diminishing returns will ultimately by limiting the extent that the tourism sector can contribute to the improvement of national welfare.Consider, for example, the impact of labour cost. As a tourist destination develops, wages rise. This will lead to an increase in the price of tourism services, as they are mainly labor-intensive. At the same time, other countries may start to develop their own tourism sectors, from a lower point of development and offering a similar product at a lower price. Thus a country specializing in tourism will become less competitive as it becomes richer. This theoretical mechanism seems to be consistent with occasional empirical observation. For example, traditional Mediterranean destinations such as Spain, Greece, and Cyprus are now facing stiff competition from relative newcomers such as Croatia, Turkey, and Egypt.The objective of this paper is to present the latest findings of the economic literature investigating the link between tourism specialization and economic growth and to discuss their implications for Iran and its tourism sector. According to the twenty-year outlook of the Islamic Republic of Iran, the contribution of international tourists will rise from 0.09% in 2004 to 1.5% in 2025.
This means that in order to attract 20 million tourists every year to the world market, the country should invest more than 30 billion dollars in the industry. Based on the vision statement, Iran’s share of the world tourism income is projected to increase from 0.07% in 2004 to 2% in 2025, so that Iran will gain almost 25 billion dollars from tourism. The current situation is unsatisfactory and reveals that the country has difficult path to reach 2 percent of the world income tourism; therefore, with respect to the objectives, the vision statement can be an important factor in accelerating growth and development.
Various econometric approaches are used in this study. First, part of the standard augmented NG-Perron unit root test, we also apply the structural breaks unit root test. Second, the co-integration approach proposed by Johansen and Juselius [6] is used to determine the presence of long-run equilibrium relationships between economic growth, international tourism and other determinants. Finally, we use the ARDL approach for the long-run and short-run estimation and the Granger Causality relationship between tourism, economic growth.
The remainder of the study is organized as follows: Section 2 provides some empirical.
Section 3 explains the data and the methods of model. Section 4 discusses the econometric procedures followed. The empirical findings will then be presented in Section 5. Section explains concluding remarks and policy implications in.
Tourism-led growth hypothesis in the presence of structural breaks over the period of 1956-2003 for Taiwan and confirmed the results of Kim et al. [7]. Kreishan [8] observed the relationship between tourism development and economic growth, using Johansen cointegration and Granger Causality test for Jordan. The findings explained that tourism push ups economic growth. Similarly, Lee [9] determined the tourismled growth hypotheses for Singapore over the period of 1978Q1- 2007Q2.The results of this study support the tourism-led growth hypotheses. The same results were obtained by Katircio?lu [10] for Singapore using annual data from 1960-2007. Similarly, a bidirectional Causality was found by Lashkarizadeh et al. [11] that verified the existence of tourism-led growth hypothesis for Iran. There are many attempts to investigate the relationship between tourism revenue and economic growth. Kadir and Karim [12], Othman, Salleh, and Sarmidi [13], Tang and Tan [14] found that tourism expansion could play an important role in stimulating economic growth in Malaysia.Obadiah et al. [15] examined the relationship between tourism development and economic growth for Kenya using the ARDL estimation approach. Their results showed a unidirectional Causality from tourism development to economic growth. Ghosh [16] examined the cointegration between the numbers of international tourist arrivals and economic growth over the period 1980-2006 using a autoregressive distributed lag (ARDL) model. On the conclusion of the relationship between tourist arrivals and economic growth, therefore TLGH is not valid for India. Tang [17] examined the tourism-led growth hypothesis in Malaysia using disaggregated tourism market data. The author argued that although tourist arrivals in some selected countries are generating economic growth in Malaysia, most of them support the growth-led tourism hypothesis. Therefore, the study concluded that the tourism-led growth hypothesis was not strong enough in the case of Malaysia. In case of Romania, Surugiu and Surugiu [18] investigated the VECM Granger Causality and Impulse response function by taking time period from 1988-2009. The evidence confirmed the existence of tourism-led growth hypothesis. Georgantopoulos [13] examined the impact of tourism expenditure, business travel, tourism spending, leisure travel, and exchange rates on economic growth for India over the period of 1988-2011 [19]. Empirical findings suggested that business travel leads to economic growth, but tourism expenditures and economic growth cause each other. Aslan [20] studied the ARDL bound testing and Granger Causality approach for the quarterly frequency of 2003-2012. The empirical results showed that tourism leads economic growth in Turkey. Similarly, Shahbaz et al. [21] investigated two models (tourism development and tourism arrivals), for tourism development and examined the tourism-led growth hypothesis for Malaysia. Their results have argued that tourism causes economic growth, financial development and trade openness and they also cause tourism. Using the ARDL method, Yazdi et al. [22] examined the long-run and shortrun relationships between tourism and economic growth for 1985- 2013 in Iran. The findings showed that there is a positive relationship between tourism expenditure and economic growth in the long-run and short-run. There was also positive relationship between the real effective exchange rates, foreign direct investment and economic growth. The Granger Causality test has shown a bidirectional Causality between tourism expenditure and economic growth.
Bouzahzah and Menyari [23] investigated tourism-led growth hypothesis for annual time series from 1980-2010 and determined that tourism-led growth hypothesis does not exist because a unidirectional causality running from economic growth to tourism has been found in Morocco. Later on, Tang and Abosedra [24] studied the causal relationship between tourism and economic growth using Granger Causality approach and argued that tourism-led growth hypothesis exists in Morocco and Tunisia. In addition, Tang and Abosedra [2] explained tourism-led growth from 1995-2010 in Lebanon. They applied Granger causality approach and establish unidirectional relationship from tourism to economic growth. But, Tang and Abosedra [24] used bootstrap and rolling Causality for monthly data from 1995-2011 and concluded the same results for Lebanon.
Data
The Data used in this paper are annual figures covering the period 1980-2014. The variables in this study are real gross domestic product per capita (GDP) (constant 2010 US$), the receipts of international tourists per capita visiting and accommodating in Iran. Physical capital is ratio of fixed capital formation as a percentage of real GDP. GPI is the secondary and tertiary school enrolment used as measure of investment in human capital and HHC shows household consumption expenditure. All data are obtained from World Bank [25].
Model
In the literature on economic growth, researchers have been interested in the rate at which countries close the gap between their current positions and their desired path of long term growth. To determine the responsiveness of the income growth rate to tourism and the traditional sources of economic growth such as investment in physical and human capital and household consumption expenditures, we first specify a simple double log-linear Cobb-Douglass production function. The following equation is:
PGDP=f (TOURt, GFC, GPIt, HHCt) (1)
We test the short-run and long-run relationships between real gross domestic products (GDP) and tourism receipts. All the variables are expressed in natural logarithms, so that elasticities can also be interpreted. In order to find the long-run relationship between variables, we propose the following the linear logarithm form:
LnPGDPt=αo+β1 LnTOURt+β2 LnGCFt+β3 LnGPIt+β4 LnHHCt+εt (2)
Where PCI is the real GDP per capita and TOUR is tourist receipts per capita in US$; GCF is the gross fixed capital formation as a percentage of real GDP used as a proxy for investment in physical capital, GCF is proxy of human capital. The impact of household consumption expenditure (HHCit) on economic growth is controversial. Neoclassical economic theory [26] suggests that higher household consumption expenditures tend to reduce economic growth by lowering investment because of reduced savings. In a recent study, Ranis [27] argued that individual and household consumption can be important in increasing human development and can respond more closely to the real needs of the population than government programs at the micro level. However, Individual consumption may not always go towards goods which the greatest contribution to human development through income growth. Consequently, the effect of household consumption expenditure (HHCit) on economic growth cannot be determined a priori.
Unit root test
The Phillips-Perron (PP) [28] unit root tests are used to examine the level of integration [29]. The PP procedures, which calculate a robust residual variance to autocorrelation, are applied to test for unit roots as an alternative to ADF unit root test. The ADF test takes the following form:
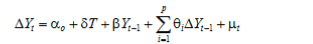 (3)
(3)
To study a long-run relationship between the variables considered, the bounds test for cointegration in the ARDL (the Autoregressive Distributed Lag) approach was adopted in this study. This model was developed by Pesaran et al. [30] and can be applied independently of the order of integration of the variables (regardless of whether regressors are purely I (0), purely I (1).
Bayer and Hanks non-cointegration test
The cointegration relationship between tourism and economic growth is investigated using the joint cointegration test proposed by Bayer and Hanck [31]. This test provides consistent and reliable cointegration results by integrating the findings of four cointegration approaches, namely Engle and Granger [32], Johansen [33], Banerjee, Dolado, and Mestre which are expressed by EG, JOH, BO and BDM, respectively. Bayerhanck produces a joint test-statistic for the null of no-cointegration based on Engle-Granger, Johansen maximum eigenvalue, Boswijk, and Banerjee tests [31]. Represent the probability values of EG, JOH, BO and BDM tests, respectively. To determine whether long-run association is present or not among the series, the Fisher statistic is used.
ARDL test
The Autoregressive Distributed Lag (ARDL) was developed by Pesaran et al. [30] and can be applied independently of the order of integration of the variables (independent of whether repressors are purely I (0), purely I(1) or mutually cointegrated). The ARDL approach consists in estimating the following error correction model. The null hypothesis of the series has a unit root against the alternative of stationary. The ARDL framework of Equation 3 l is as follows:
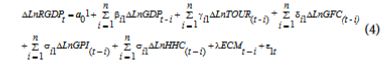 (4)
(4)
Where ECMt-1 is the error correction term which is obtained from the following estimated cointegration equation:
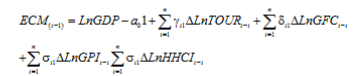 (5)
(5)
The Error Correction Term (ECMt-1) shows the speed of adjustment and shows how fast the variables return to the long term equilibrium and it should have a statistically significant coefficient with a negative sign. To ensure the relevance of the model, the diagnostic test and stability are also performed.
Granger causality analysis
In this section, we discuss the testing procedure for the Granger Causality test. According to Granger [34], if a set of variables are cointegrated, the VECM must be used because it takes into account the short and long-run elements. In the study, we use the vector error-correction model (VECM) to examine the Causality between Iranian’s economic growth and tourism. Assuming that the variables are cointegrated, the Causality between economic growth and tourism can be tested by estimating the following equations.
ECMt-1 is the lagged error-correction term. The VECM captures both the short-run and the long-run relationships. The long-run causal relationship can be established by the significance of the lagged ECMs in equations based on test and the short-run Granger Causality is detected by the test of significance of F-statistics of Wald test of the relevant coefficients on the first difference series.
Table 1 is represented some descriptive statistics and pair-wise correlation of the variables for period 1980-2014 in Iran.The results explain that: standard deviation of GPI is high by comparing other series. Similarly, the standard deviation of GCFand GDP per capita are very low. The high standard deviation shows high data volatility and low standard deviation represents the stability in data. The value of Jarque-Bera shows that all series are normally distributed, having zero mean and constant variance. The pair-wise correlation explains that tourism receipts and human capital are positively correlated with economic growth and physical capital and human capital positively correlated with economic growth.
| Authors | Time Period | Empirical Method | Variables | Results |
|---|---|---|---|---|
| Kim et al. [7] | (1971- 2003,1956-2002) | Johansen Test,Granger CausalityTest | Tourism arrivals growth, Income growth | Y → T |
| Lee [9] | (1978-2007) | ARDL Approach, Granger CausalityTest | Tourist Arrivals,Real GDP | T → Y |
| Katircio?lu [10] | (1960- 007) | ARDL Approach, Granger CausalityTest | International Tourism arrivals, GDP, Exchange rates | T → Y |
| Kreishan [8] | (1970-2009) | Johansen Test, Granger CausalityTest | Tourism development,Economic growth | T → Y |
| Ghosh [16] | (1980-2006) | international tourism arrivals and Economic growth | T =≠=> Y | |
| Lashkarizadehet al.[11] | (1980-2009) | Granger Causality, Test, ECM | GDP per Capita, Tourism arrivals | T → Y |
| Kadir and Karim [12] | (1998-2005) | Pedroni test; Panel Granger Causality | Tourism development, economic growth | Tour → EG |
| Obadiah et al. [15] | (1999-2012) | ARDL Approach, Granger CausalityTest | Trade, GDP, tourism arrivals | T → Y |
| Othman et al. [13] | (1970-2010) | ARDL Approach, Granger CausalityTest | Tourism receipts, economic growth | Tour → EG |
| Bouzahzah and Menyari [23] | (1980-2010) | Johansen Test, Granger CausalityTest | Tourism receipt, Real effective exchange rates, Real GDP | Y → T |
| Cheam et.al [42] | (1974-2010) | Johansen Test; Granger CausalityTest | Tourism development, economic growth | Tour → EG |
| Georgantopoulos [19] | (1988-2011) | Johansen Test,VAR Model, ECM, Innovative accounting approach | Economic Growth, Tourism expenditure, Business travel, Tourism spending (BTS), Leisure travel and tourism Spending (LTS), Exchange Rates. | T =≠=> YAggregateModel. ButLTSnY,BTS → Y |
| Surugiu and Surugiu [18] | (1988-2009) | Unrestricted Cointegration Rank Test, VECM Granger Causality Test, Impulse Response | Real GDP, Real effective exchange rates, Tourism Arrivals | T → Y |
| Tang [17] | (1974-2009) | ARDL Approach, Granger CausalityTest | Tourism development, Economic Growth | Tour → EG |
| Tang and Tan [14] | (1995-2009) | Cointegration Test; Recursive Granger CausalityTest | Tourism arrivals, Economic growth(Proxy of Industrial Production) | T → EG |
| Tang and Abosedra [2] | (1995-2010) | ARDL Approach, Granger Causality | Tourism arrivals,Economic Growth | T → Y |
| Test | ||||
| Aslan [20] | (2003-2012) | ARDL Approach, Granger CausalityTest | Expanse of Tourism(Accommodation, Transport, Sportingactivities,sightseeing,Cloth & Footwear, Gift), Economic growth | T → Y |
| KhoshnevisYazdi and et al. [22] | (1985–2013) | ARDL Approach, Granger CausalityTest | Tourism expenditure, Economic growth, Foreign direct investment, Real effective exchange rates | T → Y |
| Shahbaz et al. [21] | (1975-2013) | ARDL Approach, Granger CausalityTest | Tourism development(Proxies of Tourism arrivals and receipt), GDP, Financial Development, Trade | T n Y,FD, TOUR |
| Tang andAbosedra [24] | (1990-2010) | CombineCointegration, Granger causality Test | Real GDP per Capita, Tourism arrivals | T → Y |
| Tang and Abosedra [24] | (1995-2011) | Bootstrap,RollingCausalityTest | Tourism development, Economic Growth | T → Y |
Table 1: The empirical studies of tourism development and economic growth. Source: Arthur’s findings.
The results of NG-Perron unit root test are presented in Table 2. The empirical results suggested that economic growth, tourism receipts, physical capital, human capital and household consumption expenditures have unit root problem at level i.e. I(0), but found stationary after taking first difference, i.e. I(1).The results suggest that all series are non-stationary at level, but stationary at the first difference in the presence of structural breaks. Structural breaks in 2011, 2011, 2008, 2012 and 2011 are found for economic growth, tourism receipt, physical capital, human capital and household consumption expenditures, respectively. These results confirm our previous finding that, despite of the presence of structural breaks, our variables are integrated of order one (Table 3). Since unit root tests consistently suggested that all series have a singular integration, the Bayer and Hanck [31] test is appropriate to determine if the variables are cointegrated. The results of Bayer and Hanck cointegration test are given in Table 4. A glance at Table 4 clearly indicated that the estimated value of Fisher-statistics for EG-JOH-BO-BDM test is greater than the table value at 5% level of significance. Therefore, we reject the null of no cointegration hypothesis and concluded that tourism, and economic growth is cointegrated over the period 1980- 2014. After found the presence of cointegration relationship among the variables, we examined the long-run and shortrun impact of these variables on economic growth in Iran. Tables 5 and 6 show the estimated short and long-run coefficients.
| Variables | Ln GDP | Ln TOUR | Ln GCF | Ln GPI | Ln HHC |
|---|---|---|---|---|---|
| Mean | 8.012416 | 19.16844 | 3.75484 | -0.100197 | 25.24036 |
| Maximum | 8.256047 | 19.7451 | 4.026313 | 0.125725 | 25.63245 |
| Minimum | 7.760959 | 18.62769 | 3.375135 | -0.668201 | 24.74585 |
| Std. Dev. | 0.17183 | 0.283748 | 0.193548 | 0.225933 | 0.307892 |
| Skewness | -0.13679 | -0.182574 | -0.393287 | -1.270391 | -0.229109 |
| Kurtosis | 1.432691 | 2.554469 | 1.978171 | 3.493247 | 1.554864 |
| Jarque-Bera | 2.109418 | 0.276525 | 1.385694 | 5.582389 | 1.915318 |
| Prob. | 0.348294 | 0.87087 | 0.50015 | 0.061348 | 0.38379 |
| Correlation | |||||
| Ln GDP | 1.000000 | ||||
| Ln TOUR | 0.484438 | 1.000000 | |||
| Ln GCF | 0.779905 | 0.629268 | 1.000000 | ||
| Ln GPI | 0.760534 | 0.686486 | 0.81076 | 1.000000 | |
| Ln HHC | 0.986572 | 0.562139 | 0.757245 | 0.794899 | 1.000000 |
Table 2: Descriptive statistics for variables. Source: Author's calculation using eviews 9.
| Variable | MZa | MZt | MSB | MPT | Variable | MZa | MZt | MSB | MPT |
|---|---|---|---|---|---|---|---|---|---|
| Ln GDP | -0.17291 | -0.13267 | 0.76726 | 34.1422 | D ln GDP | -8.16190** | -2.01969** | 0.24745 | 3.00334 |
| Ln TOUR | -2.92394 | -0.84306 | 0.28833 | 7.49062 | Dln TOUR | -8.70672** | -2.04107** | 0.23442 | 2.97825** |
| LnGCF | -1.72192 | -0.87127 | 0.50599 | 13.3318 | Dln GCF | -8.49140** | -2.00455** | 0.23607 | 3.08601** |
| Ln GPI | -0.76517 | -0.56336 | 0.73625 | 27.6949 | Dln GPI | -14.2 | -2.62 | 0.18500**** | 6.67000** |
| Ln HHC | -14.2 | -2.62 | 0.185 | 6.67 | Dln HHC | -8.74605** | -2.08920** | 0.23887 | 2.80851** |
**Significance at the 5% level. ***Significance at the 10% level. D shows series in first difference.
Table 3: NG-perron unit root test results.
| Variable | Level (0) | Variable | Level (1) | ||
|---|---|---|---|---|---|
| T-Statistics | Time break | T-Statistics | Time break | ||
| Ln GDP | -3.253 | 2002 | D Ln GDP | -4.9118** | 2011 |
| Ln TOUR | -2.4715 | 2011 | D Ln TOUR | -7.0980** | 2011 |
| LnGCF | -5.0481 | 2013 | D Ln GCF | -3.9457** | 2008 |
| Ln GPI | -5.3681 | 2010 | D Ln GPI | -6.6719** | 2012 |
| Ln HHC | -2.1516 | 2002 | D Ln HHC | -4.9756** | 2011 |
**Significance at the 5% level, ***Significance at the 10% level.
Table 4: Perron structural unit root test.
| Engle-Granger | Johansen | Banerjee | Boswijk | |
|---|---|---|---|---|
| Test Statistics | 73.8749 | -49.366 | 5.2671 | 73.8749 |
| P-Values | [0.0017] | [0.0003] | [0.0010] | [0.0000] |
| Fisher Type Test statistics, Bayer Hanck Test | ||||
| EG-J: | 28.97771, 5% critical value: 10.576 | |||
| EG-J-Ba-Bo- | 98.055263, 5% critical value: 20.14 | |||
**Significant at 5% level.
Table 5: bayer-hanck test for cointergration.
| Variables | Coefficient | Std. Error | Prob |
|---|---|---|---|
| DLn TOUR | -0.10** | 0.032127 | [0.0131] |
| DLn GCF | 0.15** | 0.058605 | [0.0334] |
| DLn GPI | -0.14*** | 0.066311 | [0.0605] |
| DLn HHC | 0.47** | 0.138292 | [0.0075] |
| DUM 2011 | 0.06** | 0.021781 | [0.0198] |
| ECM (-1) | -0.211** | 0.17878 | [0.0001] |
| Diagnostic Tests (P-value) | |||
| Serial Correlation (Breusch- Godfrey) LM test | 1.300637 | [0.3309] | |
| Hetroskedasticity (ARCH) test | 0.304998 | [0.5889] | |
| White Hetroskedasticity test | 0.64723 | [0.7245] | |
| Ramsey RESET test | 0.001297 | [0.9721] | |
| Normality (Jarque - Bera) | 6.073739 | [0.14807] | |
**Rejection of the hypothesis at the 0.05 level.
***Rejection of the hypothesis at the 0.01 level.
Table 6: Error correction model (ECM) for short-run elasticity selected model:ardl (2, 0, 0, 0, 0, 0).
In Tables 5 and 6 all estimated coefficients can be interpreted as short-run and long-run elasticity, since the variables are in natural logarithm form. We use DUM 2011 for structural breaks. Economic growth, tourism receipts, physical capital, human capital and household consumption expenditures are statistically significant at the 5% and 10% level in the long-run and short-run. Following the results of the short-run analysis and the coefficient of the error correction terms are presented in Table 5. The important result of the short-run dynamics is the calculation of the ECM coefficient. The lagged error correction coefficients, ECMt-1 are a correct sign, and significant in both cases, by checking the established cointegrating relationships between the variables. The coefficient of ECMt−1 shows the speed of the adjustment back to the long-run equilibrium after a short-run shock. The coefficient of is -0.59. This implies close to -0.21% of the disequilibria of the previous year’s shock adjusting back to the long- run equilibrium in the current year. The values of the coefficients of ECMt-1 indicate that the variables will adjust to the long-run equilibrium in about 4.75 periods due to short-run shocks.
The tourism has a negative impact on economic growth in both short-run and long-run.1 percent increase in international tourism, decrease real GDP by 0.01%, 0.08% in short-run and long-run, respectively other thing remain constant. The tourism could not stimulate Iranian’s economic growth, thus supporting the tourism-led growth hypothesis.
The results of our study are in line with the recent empirical studies, for example, Oh [35] has a stance of growth led tourism hypothesis. In addition, the positive and significant impact of physical capital on economic growth is found. As a result, 1% increases physical capital leads to increase 0.15%, 0.12% economic growth in short-run and long- run. Although the impact of human capital on economic growth is negative and significant, 1% increase human capital increases -0.14%, 0.12% economic growth in short-run and long- run, respectively. Further, a positive association between household consumption expenditures and economic growth is noticed. 1% increase household consumption expenditures cause to 0.47%, 0.39% increase economic growth in short-run and long-run. In addition, diagnostic statistics such as LM test, ARCH test, Ramsey RESET test and white heteroskedasticity test explained that there is no serial correlation; residual terms are normal distributed, no autoregressive conditional heteroscedasticity and no white heteroscedasticity. Engle-Granger [32] predicted that if the cointegration exists between variables, there must be a causal relationship between variables. This relationship can be unidirectional (one variable causes to another variable) or/and bidirectional (the two variables cause to each other). Further, this causal relationship has been divided into two parts, short-run causality and long-run causality. Table 7 shows that there is Granger Causality between these variables.
| Variables | Coefficient | Std. Error | T Statistic | Prob |
|---|---|---|---|---|
| DLn TOUR | -0.08*** | 0.024184 | -3.367067 | [0.0083] |
| DLn GCF | 0.12** | 0.049982 | 2.41856 | [0.0387] |
| DLn GPI | -0.12** | 0.049802 | -2.350238 | [0.0433] |
| DLn HCC | 0.39** | 0.095461 | 4.093294 | [0.0027] |
| C | -0.93 | 2.601127 | -0.35911 | [0.7278] |
| DUM 2011 | 0.05** | 0.017916 | 2.827497 | [0.0198] |
**Rejection of the hypothesis at the 0.05 level.
***Rejection of the hypothesis at the 0.01 level.
Table 7: Estimated long-run coefficients using the ardl approach selected model: ardl (2, 0, 0, 0, 0, 0).
We used VECM Granger causality approach to understand the causal relationship between underlying variables. The results of VECM Granger causality explain the causality between tourism receipts, physical capital, human capita and household consumption expenditures and economic growth. We found a positive and significant value of ECM t-1 for all variables (Table 8).
| Variable | Short-run | Long-run | ||||
|---|---|---|---|---|---|---|
| DLn GDP | DLn TOUR | DLn GCF | DLn GPI | DLn HHC | ECM(-1) | |
| DLn GDP | - | 0.50047 [0.6903] | 0.47300 [0.7079] | 7.09718** [0.0083] | 4.01373** [0.0439] | 0.128137[0.7204] |
| DLn TOUR | 6.99666** [0.0087] | - | 5.9230 | 0.00965 | 3.36300** | 4.057337** |
| DLn GCF | 7.20562 [0.0163] | 3.24143 [0.0835] | - | 3.50512 [0.0573] | 2.74258 [0.0989] | 1.066786[0.3017] |
| DLn GPI | 4.48738 [0.0501] | 0.74692[0.4002] | 6.43235 [0.0220] | - | 3.83371 [0.0679] | 0.080316[ 0.7769] |
| DLn HHC | 2.99463** [0.0852] | 0.72292[0.4077] | 0.88452[0.3609] | 10.7813 [0.0047] | - | 3.657158** [0.0558] |
Note: **The statistical is significance at the 5%, levels.
Denote X → Y means X Granger causes Y.
Table 8: Granger causality test.
In long- run, the unidirectional causality is running from tourism receipts to economic growth, therefore we accepted TLG hypothesis. This is contrary to the findings of Nanthakumar et al. [36] and Kadiret al. [37], but consistent with those of Lean and Tang [38] and Tang [14]. Tourism could be an effective catalyst for the growth of the Iranian economy [39-45].
We found bidirectional causality between household consumption expenditures, human capital and economic growth in Iran. There is unidirectional causality running from physical capital to economic growth.
Our empirical findings have a major policy implication. If domestic tourism receipts lead to economic growth, the implication is that travel expenditures stimulate economic growth. As a result, economic growth depends on domestic tourism receipts, suggesting that negative travel shocks and travel conservation policies could depress economic growth. Our results showed that tourism development is great importance to economic growth in Iran.
Impulse response and variance decomposition analyses are in order to study the influence of innovations in all system variables on economic growth, impulse response analysis is applied [46-50]. The impulse responses of economic growth to one standard deviation innovations to tourism and economic growth are shown in Figure 1.

Figure 1: Response tourism to GDP.
The impulse response findings showed that, first of all, the response of economic growth to a shock on tourism receipts per capita is positive throughout the period under view. Specifically, it increases consistently in the first fifteen periods, reaches at a level of 0.0, and then turns to be almost stable [51-53]. This finding was contrary to a conclusion in Georgantopoulos [19] that an expected shock to tourism expenditure does not affect the growth in GDP.
This paper has empirically examined both the short-run and long-run effects of tourism receipts, physical capital, human capital, household consumption expenditure and economic growth over the period of 1980-2014 in Iran. To accomplish this, the degree of stationary of the variables was examined by applying the break point unit root test. All the variables used in the study are I (1).
We also used structural break test and the Bayer and Hanck, cointegration method and ARDL approach, Granger Causality and Impulse shocks. The empirical results of both Bayer and Hanck and ARDL approach have consistently showed that Iran’s economic growth, tourism is cointegrated. Evidence for the existence of a tourism-led growth hypothesis has been established for Iran. The ARDL has allowed obtaining elasticities of economic growth with relative to tourism both in the long-run and short-run.
The main finding of this study is the TLG hypothesis can be accepted for Iran. The more prosperous the country, the more stable the sounds and the economic, social and political situations. The prospective tourists will have more confidence to visit Iran. It is therefore imperative that government institutions, tourism planners and investors recognize the implications of their actions in the interest of long term economic viability of the tourism sector. Growth in tourism based on investments and tourism capacity could also stimulate economic growth. However, this potential remains largely untapped. In addition, the results show that the conventional sources of growth such as investment in physical and human capital and the ability of households to have afford spending on health, housing, nutrition, and other household items can enhance their productivity and boost their economic growth.
These results reinforce the need for more reliable tourism development strategies and programs that will executed by the Iranian government to take full advantage of the potential of tourism for promoting economic growth. To achieve the desired growth in this sector, the country must implement policies that advance promote enthusiastic and prudent management of talent, particularly in development of human capital.In the international tourism market, which is an integral part of globalization, a sustainable competition or countries, companies and governments cannot be realized by allocating large amounts of capital resources to the activities such as making realistic forecasts about the current tourism trends, reasons for people to travel, demand, needs and expectations of consumers, based on their income and technology, by conducting market research. Thus, the government should develop tourism sector by providing basic facilities such as, roads, infrastructural development, communication sources and good transport system. Tourism contributes in reduction of poverty by generating employment sources. So, government should provide subsidies to tourism industry by reduction in tax ratio and travelling expense. The law and order, and security are other points that the government should focus to improve the economic growth through tourism development.
Tourism development is more influenced by the overall macroeconomic situation of the economy. In this context, it depends on the development of the financial system. The main reason for the importance of finance for development is reflected in the functions of financial institutions.
On the one hand the financial system allows the transfer of funds for the exchange of goods and services or promise future inflows and on the other hand it involves a network of institutions which make several crucial economic functions: mobilizing savings, allocating capital, monitoring of managers and transforming the risk. In this perspective, there is an indisputable link between the development of the financial system and development of tourism.
The high potential is realized if the reasons for its realization exist. It is therefore recommended to pay particular attention to tourism industry in order to reach higher economic growth in Iran and country’s tourism development program should be compiled in the field of economic development plan. Similarly, it is recommended that the authorities pay due attention to growth of this industry by planning to increase the attractiveness of foreign tourists.
This paper is extracted as “The Evaluation Impacts of Tourism Development on Iranian Economy” Project was supported by Economics Islamic Azad University, South Tehran Branch. We are thankful to our colleagues who provided expertise that greatly assisted he research.