Journal of Chromatography & Separation Techniques
Open Access
ISSN: 2157-7064
ISSN: 2157-7064
Research Article - (2015) Volume 6, Issue 4
Partially purified fraction E, dichloromethane extract of leaves from Labisia Pumila has been shown to possess anti-ulcer, anti-inflammatory, anti-asthmatic activities among others. Naringin has been identified by LC-MS and HPLC as the major compound present in fraction E. The present study reports the development and validated TLC densitometric method for the quantification of Naringin present in Fraction E. ICH guidelines were followed to develop this method. CAMAG-HPLTC system comprising of a TLC Visualizer and Linomat 5 sample applicator was used in this study. The separation was performed using TLC aluminum plates pre-coated with silica gel 60 F254. Optimized mobile phase consisted of Methanol: Ethyl Acetate (60:40 v/v). Win-CATS-V 1.2.3 software and Video Scan were used to identify and quantify Naringin at 366nm in fluorescence mode. The peak heights at Rf 0.648 ± 0.01 gave a linear range from 200-1000μg/ml correlation coefficient R2± SD = 0.973 ± 0.024. The LOD and LOQ were found to be Naringin 0.74 ± 0.29 μg and 7.73 ± 0.26 μg, respectively. Repeatability gave CV % < 2.0. We recovered 92.56% of Naringin and 642.4 mg/g (64.24%) was found to be present in Fraction E. The HPTLC method was found to be reproducible, accurate and convenient for rapid screening of bioactive constituents present in Fraction E. This developed method will be used for analysis and quality control of drug formulations containing Labisia Pumila.
Keywords: HPTLC; Labisia Pumila; ICH guidelines
Labisia Pumila (LP) (var. Alata) a member of the Myrsinaceae family is a traditional herb found widely throughout the rainforest of Indochina [1]. Its other names include Kacip Fatimah, Sangkoh (Iban), Mata Pelanduk Rimba, Selusoh Fatimah and Tadah Matahari [1]. Indigenous women of the Malay Archipelago use this herb to increase libido, improve post-partum health and ease menstrual problems [1, 2]. This plant has been reported by many authors to possess; anti-bacterial, oestrogenicity, anti-inflammatory, anti-photoaging, antioxidant and gastro-protective with positive results [3-6]. The partially purified extracts of LP have been extensively studied [7-9] and Fraction E has been shown to possess antioxidant and anti-inflammatory activity. Different studies on the constituents of the different varieties of LP have reported them to contain variable patterns of flavonoids, phenolic and various bioactive volatile compounds [10, 11]. Phytochemical compounds like naringin, quercertin, rutin, kaempferol, vanillic acid and hesperetin among others have been reported to be constituted in LP extract [11]. Naringin (Cas: 10236-47-2) (4′,5,7-Trihydroxyflavanone 7-rhamnoglucoside) is a flavanone glycoside that has been reported to possess in vitro [12] and in vivo [13, 14] antioxidant properties. It was also reported to improve diabetic foot ulcers its down-regulation of antiinflammatory, inhibition of oxidative stress and hyperglycemia and up regulation of growth factors (IFG-1, TGF-β and VEGF-c) expression. Preliminary phytochemical analysis on the partially purified extracts showed Fraction E tested positive for phenolic compounds while LCMS and HPLC (unpublished data) confirmed the presence of Naringin its major constituent.
HPTLC is quickly becoming the leading chromatographic technique used to quantify the amount of different compounds in complex samples [15]. The objective of this experiment was to report a new high performance-thin layer chromatography (HPTLC)-densitometric procedure for the separation and quantitative determination of Naringin in fraction E of partially purified DCM leaf extract of Labisia Pumila. The Validation of this chromatographic procedure was according to the International Conference on Harmonisation of Technical Requirements For Registration of Pharmaceuticals For Human Use guideline (ICH guideline) [16].
Plant samples and chemicals
The leaves of LP var. alata (Kacip Fatimah) were obtained and identified from a forest in Sungai Perak, by Dr. Shamsul Khamis, a research officer (plant taxonomy) from the Laboratory of Natural Products (NATPRO), Institute of Bioscience in University Putra Malaysia. Naringin (Cas: 10236-47-2) (>90%), Pre-coated aluminum silica gel TLC plates (F254 20 x 20 cm) and 2-amino-ethyldiphenylborinate (Neu’s reagent) were obtained from (Merck, Germany). All solvents used were of analytical grade.
Extraction of plant materials
The fresh leaves were air-dried for 7 days before being powdered by dry mill. About 500 g of plant material was kept in 6 L of dichloromethane for 2 days. This extraction process was repeated six times before filtering with No. 1 Whatman filter paper. The filtrate was rotary evaporated at 40°C and kept to dry in a fume cupboard. The extract was kept in a desiccator for further separation by column chromatography. The partial purification of the DCM extract by column chromatography used a 42 x 2.5 cm vertical column equipped with a stop cock and glass frit to support the silica gel, pore size 60 Å, 200-400 mesh. 100% hexane was used to pre-elute the column. A decreasing polarity solvent ratio (100% hexane (Hx) – Hx: Ethyl acetate (EA) – EA: Methanol (MeOH) – 100% MeOH) was used to obtain Fraction E (60:40 Hx:EA to 100% MeOH). The fractions were collected based on their chromatogram profiles analyzed on (TLC plates Silica gel 60 F254) and mobile phase 60:40 Hx:EA.
Preparation of standard and extract solution
Naringin and the Fraction E sample (5 mg/ml) were prepared by transferring accurately weighed 5mg into a 1.5ml centrifuge tube; the extract was dissolved in 1 mL of HPLC analytical grade methanol and ultra-sonicated for 20 minutes and filtered with 0.45 μm millipore sterile syringe filter. Standards and sample were prepared daily immediately before use.
HPTLC Instrumentation and chromatography conditions
20 μl of the extracts were separately applied (Samples and standard) onto the TLC plate with 6 mm wide band or spotted with an automatic TLC applicator Linomat-V with N2 flow (Camag, Switzerland), 8 mm from the bottom with instruction input defined from win-CATS-V 1.2.3 software. After sample application, the plates were developed in a 10 x 20 cm horizontal Camag twin glass chamber pre-saturated with the mobile phase (10 ml each side) for 20 minutes at room temperature (25 -27°C). The mobile phase consisted of MeOH: EA (60:40 v/v). Linear ascending development was carried out until the 8 cm mark. The plates were observed after 30 minutes air drying under the Camag UV visualizer (366 nm) as shown in Figure 1. The plates were sprayed with Neu’s reagent spray. Video Scan software in fluorescence mode was used to quantify the plates post derivation.

Figure 1: Video scan capture of TLC plate at 366 nm of Naringin and SNP E.
Validation method
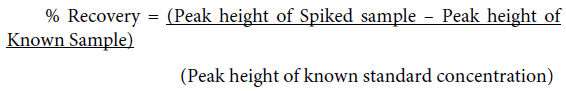
ICH guidelines were followed for the validation of the quantitative method developed for precision, repeatability and accuracy of naringin in Fraction E [16]. A concentration range of 200 to 5000 μg/ml was spotted on the TLC plate in triplicates. Linearity, LOD and LOQ was done according to methods described by [17]. Precision was evaluated by the analysis of replicate (n = 3) applications of freshly prepared standard solution at concentrations (200, 600 and 1000 μg/ml) by methods described by [18]. The repeatability of sample application and measurement of peak height was expressed in terms of coefficient of variation (CV%). Accuracy was measured by performing recovery experiments by spiking (200, 600, 1000 μg/ml) of Naringin with a single known concentration of Fraction E (600 μg/ml) and percentage recovery was calculated according to the formula below Figure 2:

Figure 2: Interpolation of amount of naringin in SNP E from the standard curve.
The amount of herbal drugs used worldwide has risen dramatically in the recent decade. Natural health products and Chinese herbal remedies are two examples from among the variety of plant drugs in the market [15]. High performance thin layer chromatography has been reported to be a universally accepted method for evaluating the chemical composition of natural products [19], specifically in phytochemical analysis [15]. This is due to advantages HPTLC offers like; image result presentation, it’s simple, cost efficiency, rapid obtainable results and high sample capacity [15].
Standard curve, LOD and LOQ
The methods linearity was determined with a specified range to obtain test results in direct proportion to the concentrations of the analyte. Naringin had linear range from 200-1000μg/ml with correlation coefficient R2± SD = 0.973 ± 0.024 as reported in Table 1. The limit of quantification (LOQ) is the lowest amount of the analyte that can be quantitatively determined in sample with defined precision and accuracy under standard conditions. LOQ is the amount of loaded sample producing a peak area that is equal to the sum mean blank area and ten times its standard deviation [20]. Sample concentration at 900 μg/ml was interpolated with the linear regression curve using graphpad prism 6 Figure 3. The amount of naringin found in Fraction E was found to be 642.39 ± 22.9 mg/g (64.2%) The LOD and LOQ have been reported in Table 1.
| Parameters | Results (mean ± SD) (n=3) |
|---|---|
| Regression equation | y = 2.037x + 725.8 |
| Correlation coefficient | 0.973 ± 0.024 |
| Linearity range | 200 to 1000 µg/ml |
| Limit of detection | 0.75 ± 0.29 µg |
| Limit of quantification | 7.73 ± 0.26 µg |
| Amount naringin (mg/g) | 642.39 ± 22.9 mg/g (64%) |
Table 1: Amount of Calibration Parameters.

Figure 3: Hptlc Validation of Partially Purified Labisia Pumila Extract
Precision and accuracy
Precision of comparison (intra-day and inter-day) were determined under different conditions, different day, different reagents, on the same sample. Intra and Intra-day was carried out using the standard on three different days where results were expressed in CV %. In terms of repeatability of the measurement peak area this method obtained a coefficient of variation not more than 2% (Table 2). The percent recovery was found to be 92.56%. The results are shown in Table 3.
| Amount (µg/ml) | Intraday Precision | Interday Precision | ||
| SD in height | %CV | SD in height | %CV | |
| 200 | 13.23 | 0.81 | 23.48 | 1.85 |
| 600 | 42.58 | 1.11 | 26.56 | 1.08 |
| 1000 | 61.29 | 1.03 | 64.29 | 1.56 |
Table 2: Intra and Inter day precision of naringin (n=3).
| Concentration (µg/ml) | Sample height | Total height (sample + standard) | % Recovery | |||
| Sample | Spiked amount | Sample height | Spiked height | |||
| 600 | 200 | 2855.5 | 1730.7 | 4445.4 | 91.88 | |
| 600 | 600 | 3162.7 | 3945.2 | 6618.6 | 95.40 | |
| 600 | 1000 | 4979.3 | 86726.7 | 8833.1 | 90.40 | |
| Average | 92.56 | |||||
Table 3: Recovery studies of naringin by the proposed TLC densitometric method (n=3).
A Quantitative HPTLC method for estimating the amount of Naringin in Fraction E from the partially purified DCM leaf extract from Labisia Pumila has been described in this paper. This method was able to obtain precise and accurate results. The data could be used as a quality control technique for the evaluation of Naringin in Fraction E. The method gave good peak resolution in the analysis of bioactive constituents present in the sample. Linearity gave an R2 value of more than 0.9. Precision and recovery was able to give CV% less than 2%. The proposed HPTLC method for the analysis of fraction E from the partially purified leaf DCM extract of Labisia Pumila reported here is simple, sensitive, economic and suitable for rapid routine quality control analysis and quantification of Naringin in herbal drug preparation and may be useful for standardization purposes.
The authors are grateful to FRGS (MoHE), Reference code: 2/2013/SGO5/ UCSI/02/1 and the Faculty of Applied Sciences, UCSI University for providing the facility for this project.