Journal of Thermodynamics & Catalysis
Open Access
ISSN: 2157-7544
ISSN: 2157-7544
Research Article - (2015) Volume 6, Issue 1
A new hydration Schiff base consisting of 7-chloro-4-(o-hydroxy benzilidenehydrazo) quinoline, with metal complexes of some divalent metal ions, Mn(II), Fe(III), Co(II), Ni(II), Cu(II), Zn(II), and Cd(II) complexes were studies. Spectrophotometrically obeyed Beer's law up to certain values, 6.6×10³, 8.0×10³dm3mol-1cm-1, respectively, indicating that the ligand HL could be used to detect Co(II) and Ni(II) in such concentrations, the study was performed also for Fe (III)-complexes. Conductance and thermodynamically used molar ratio method to determine the stoichiometry of the complexes obtained confirmed the formation of 1:1 and 1:2, M:L complexes. The standard thermodynamic parameters viz. ΔG, ΔH and ΔS, for the proton-legend and the stepwise metal-ligand complexes eluated were analyzed in terms of the electrostatic (eel) and non-electrostatic (crates, c) components. ΔHc was found to be linearly correlated with the acceptor number of the metal ion (ANM), and ΔH el was linearly correlated with the ionic radii of the metal ion. The calculated values for ΔG°, ΔH° and ΔS° concluded that the complexion process processed spontaneously.
Keywords: Hydrazone; Spectro-potentiality; Transition metal complexes; Thermodynamic parameters.
Hydration Schiff base compounds containing quinoline moiety are well known in natural materials, and show interesting biological and antiviral activities [1-3]. Many derivatives of hydration compounds form colored complexes with different metal ions and can be used as analytical reagents for their determinations [4-9]. The coordination compounds of aroylhydrazones have been reported to act as enzyme inhibitors [10] and are useful due to their pharmacological applications [11-13]. The study of Schiff base hydrazones has been growing interest because of their antimicrobial, anti-tuberculosis, and anti-tumor activity [1-12]. The azomethine (C=N) linkage in Schiff bases imports in elucidating the mechanism of transmission and reexamination reactions in biological system [14]. The importance of metals and transition elements are formed organic compound due to its presence in many of the enzymes associated with mineral particles of large ring molecules such as hem [15]. Effect of the nature of the center metal ion and the medium, composition of fixed factors on the stability of the complexes formed Hydrazones of Schiff bases with ions transition elements were studied by using, spectral studies of solutions, and reduced the pollution of both heavy metals or organic compounds unwanted. Thermodynamic parameters are computed and analyzed in order to investigate the bond character between the metal ligand. The magnetic moments and electrical conductance of the complexes were also determined.
Reagents and materials
All chemicals used were for anal, grade and the solutions of metal nitrates of, Mn (II), Fe (III), Co (II), Ni (II), Cu (II), Zn (II), and Cd (II) ions were prepared in carbonate free double distilled water and they were stabilized using EDTA titrations [16]. The HL ligand was prepared as described previously [17]. The structure of the ligand was elucidated by IR, Mass, H-NMR and electronic (UV-VIS) spectroscopy, as well as micro analytical analyses [17]. The results have been previously published [17] and weighed quantity of the ligand was dissolved in 75% (v/v) ethanol-water medium. Ethanol-water was freshly refluxed and distilled over magnesium powder and iodine [16].
Synthesis of the organic ligand
7-chloro-4-(o-hydroxy benzilidenehydrazo) quinoline, HL the ligand (HL) was synthesized as follows. 7-chloro-4-hydrazinoquinoline; 2 g (1 mmol) was dissolved in 10 ml absolute ethanol. To this solution salicylaldehyde, 13 ml (1.1 mmol) was added. The reaction mixture was refluxed for 2 h. After cooling, the formed yellow precipitate was collected, filtered, and finally washed with 5-10 ml absolute ethanol and purified by recrystallization from ethanol (80% m mp 235°C) (Figure 1).
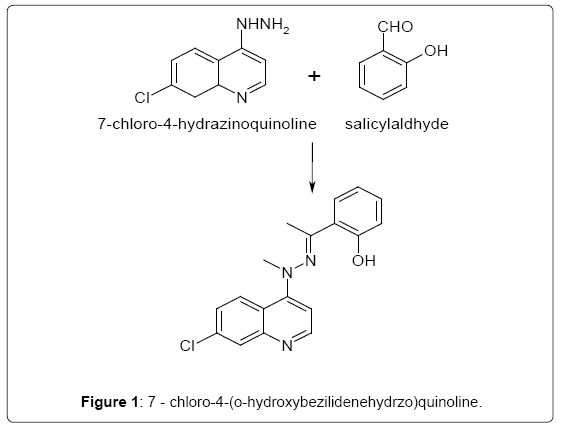
Figure 1: 7 - chloro-4-(o-hydroxybezilidenehydrzo)quinoline.
Measurement of electrical conductivity
Electrical conductance conducted measurements using a WTW. D 8120 Weilheim LF. 42.
Spectral measurements
Spectral measurements were conducted, on a Shimadzu Model UV-probe.
Potentiometric measurements
A Hanna pH-meter model 302 digital with conventional pHelectrode assembly was used for pH measurements at 10, 20, 30 and 40°C. The ionic strength of the medium was kept virtually constant at 0.05 mol.dm-3 with KNO3 as background electrolyte. The temperature was maintained constant by use of double-jacket cells with water circulated from a constant-temperature bath. Purified nitrogen gas was bubbled through the solution before and during the titrations multiple titrations were carried out for each system and the pH meter readings were recorded [6-9]. Electronic absorption spectra of the free ligand and its complexes in 75% (v/v) ethanol-water were recorded using a Shimadzu model UV-probe spectrophotometer. The composition of the complexes in solutions was determined by the molar ratio method [18,19].
Thermodynamic parameters
Thermodynamic parameters, (Table 1) are calculated from the formation constants in a mixture of 75% ethanol-water, at different temperatures as follows:
| Complex (HL) |
t°C | K. cal. mol-1 | K. cal. mol-1 | |||||||||
|---|---|---|---|---|---|---|---|---|---|---|---|---|
| 30 | 40 | 50 | - ΔG°30 | -ΔH°30 | -ΔS°30 | |||||||
| logk1 | logk2 | logk1 | logk2 | logk1 | logk2 | - ΔG°1 | - ΔG°2 | - ΔH°1 | - ΔH°2 | ΔS°1 | ΔS°2 | |
| Co(II) | 10.09 | 10.56 | 9.79 | 10.4 | 9.55 | 10.2 | 13.9903 | 14.6419 | 0.120863 | 0.0803863 | 0.0457736 | 0.0480579 |
| Cd(II) | 9.88 | 10.99 | 9.69 | 10.6 | 9.52 | 10.1 | 13.6991 | 15.2381 | 0.080528 | 0.198704 | 0.0449457 | 0.0496351 |
| Ni(II) | 10.18 | 10.57 | 9.8 | 10.32 | 9.55 | 10.11 | 14.115 | 14.6558 | 0.141149 | 0.10293 | 0.0461185 | 0.0480296 |
| Zn(II) | 9.21 | 9.69 | 8.93 | 9.31 | 8.61 | 9 | 12.7701 | 13.4356 | 0.134038 | 0.15442 | 0.0417032 | 0.0438324 |
| Fe(III) | 7.41 | 8.4 | 6.9 | 8.1 | 6.5 | 7.9 | 10.2743 | 11.647 | 0.203699 | 0.112015 | 0.0332363 | 0.0380692 |
| Mn(II) | 9.91 | 10.61 | 7.96 | 10.47 | 6.7 | 10.3 | 13.7407 | 14.7113 | 0.719272 | 0.0692309 | 0.0429749 | 0.0483235 |
| pka | 10.751 | 10.544 | 10.371 | 14.9068 | 0.0850294 | 0.0489166 | ||||||
| Type of complex | ΔGoΔS° | ΔH° and ΔS° |
|---|---|---|
| inner sphere complex | Large negative | Large positive |
| outer sphere complex | Small negative | Small positive |
Table 1: Thermodynamics functions and stepwise formation constants of 1:1 and 1:2 metal complexes at 30, 40, and 50°C in 75% ethanol-water.
1. Free energy change ΔG°
-ΔG°=2.2303T log K
Vant-Hoff isotherm ΔH°
dlog K/dt=ΔH°/4.57T
By solving (1) and (2) we obtained
Log K=-ΔH°/4.47T + constant
By plotting the relation between log K vs. 1/T we obtained a straight line its slope is equal to =ΔH°/4.57 T and ΔH° is in cal.mol-1.
The change in entropy ΔS° is calculated from Gibbs_Helmhoholtz equation:
ΔG°=ΔH°-TΔS°
Thermodynamic parameters provide valuable information about the nature of forming complexes, the degree of covalent bonding, and the change in hydration. The thermodynamic parameters results and the stability constants of the metal ions at a temperature 30°C in 75% (v/v) prove that the stability constants of complexes ligand logK1 would be in the following order:
Ni (II)> Co (II)> Mn (II)> Cd (II)> Zn
The Fe (III) ion was excluded because it must be compared with Triple charges ions. If we compare {Zn (II), Cd (II)} ions and {Co (II), Ni (II)} ions, we find that their positions are consistent with previous publication research [21-24]. Figure 2 illustrates the form of a linear relationship between the dissociation constant of ligand and static stability of the complexes logK1. This linear relationship reflects the similarity of the ionic nature of the reaction between the metal and ligand [21].
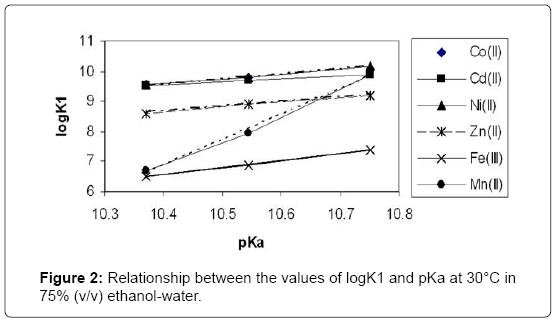
Figure 2: Relationship between the values of logK1 and pKa at 30°C in 75% (v/v) ethanol-water.
We can also use functions to distinguish between thermodynamic parameters formed inside the outer sphere and inner sphere complexes. According to Choppin [25] reflects the function's thermodynamic parameters and any type of these complexes may be as follows:
Therefore, the results confirm thermodynamic parameters which are internal complexes. Also, the table shows that the complexion process decreased with the increase of temperature, indicating that the temperature at least is the favorite for the complexion process and leading to negative values for ΔH° which means that the interaction between the metal ion and ligand molecule reaction is exothermic.
According to Nancollas et al. [26], the values of ΔH° reflect the change in the number and strength of the bonds that are formed by breaking during the interaction between the metal ion and ligand. The composition of the complex and hence the values of ΔH° is directly related to the type of interdependence between the metal ion (Mn+) and ligand molecules, as well as with the structure of complex formed. If we take into account the fact that the areas of crystal-fields produced by the consistency of oxygen centers O-coordinating sites are similar to the consistency of molecules [27], including water, ΔH° conclude that the effect is not affected by moving the replacement of water molecules. Therefore, the negative value of ΔH° is due to N-coordinating sites in the ligand molecule as described in the following structure.
The table shows the values of ΔH°1>-ΔH°2 of the ligand complexes with ions Co (II), Ni (II), Fe (III), and Mn (II). This demonstrates that there is a change in the properties of X-rays of the ligand, change in the dentate character. In other words, the decline in values -H°2 indicated to change donor centers in ligand of tridentate (ONN) donor in 1:1 complexes to bidentate (ON) donor complexes to 1:2 (M:L) to overcome the steric hindrance in the complexes 1:1 (M: L). Which is identical to the published Evans et al. [28], where he obtained the same results. On the contrary, illustrates Table 2 that the values of Ho2>ΔHo1 for complexes with ions of Cd (II) and Zn (II) and takes this as a characteristic sign of the effect of Trans influence [29] of the second coordination.
| Complex(HL) | t°C | K. cal. mol-1 | K. cal. mol-1 | |||||||||
|---|---|---|---|---|---|---|---|---|---|---|---|---|
| 30 | 40 | 50 | -ΔG°30 | -ΔH°30 | -ΔS°30 | |||||||
| logk1 | logk2 | logk1 | logk2 | logk1 | logk2 | -ΔG°1 | -ΔG°2 | -ΔH°1 | -ΔH°2 | ΔS°1 | ΔS°2 | |
| Co(II) | 10.09 | 10.56 | 9.79 | 10.4 | 9.55 | 10.2 | 13.9903 | 14.6419 | 0.120863 | 0.0803863 | 0.0457736 | 0.0480579 |
| Cd(II) | 9.88 | 10.99 | 9.69 | 10.6 | 9.52 | 10.1 | 13.6991 | 15.2381 | 0.080528 | 0.198704 | 0.0449457 | 0.0496351 |
| Ni(II) | 10.18 | 10.57 | 9.8 | 10.32 | 9.55 | 10.11 | 14.115 | 14.6558 | 0.141149 | 0.10293 | 0.0461185 | 0.0480296 |
| Zn(II) | 9.21 | 9.69 | 8.93 | 9.31 | 8.61 | 9 | 12.7701 | 13.4356 | 0.134038 | 0.15442 | 0.0417032 | 0.0438324 |
| Fe(III) | 7.41 | 8.4 | 6.9 | 8.1 | 6.5 | 7.9 | 10.2743 | 11.647 | 0.203699 | 0.112015 | 0.0332363 | 0.0380692 |
| Mn(II) | 9.91 | 10.61 | 7.96 | 10.47 | 6.7 | 10.3 | 13.7407 | 14.7113 | 0.719272 | 0.0692309 | 0.0429749 | 0.0483235 |
| pka | 10.751 | -- | 10.544 | -- | 10.371 | -- | 14.9068 | -- | 0.0850294 | -- | 0.0489166 | -- |
Table 2: Thermodynamics functions and stepwise formation constants of 1:1 and 1:2 metal complexes at 30, 40, and 50°C in 75% ethanol-water.
In contrast, high negative values for ΔG° indicates that the complexity is spontaneously, and that the positive values of ΔS° for all complexes are consistent with the hypothesis that during the process complexity remove a large number of water molecules with the possibility of changes in the number of coordination [29]. This shows that the change in entropy reflects the formation of complexes. Figure 3 shows the relationship between the change in ΔG°1 , H°1, ΔS°1 and the number of electrons 3d and found that relationship is between metal ions and the number of electrons 3d, which indicates that the change is a valuable thermodynamic parameters probably due to the change in the electron affinity to ions metals. In order to get information on the nature of the bonds in the complexes, (Table 2) would be advisable to analyze the values of ΔG°, ΔH°, ΔS° into two parts: Part a, the part that temperature-dependent ΔX°el, , electrostatic (el) interaction due to reaction of dipole or ion with long-range electrostatic forces of the powers of the electrostatic solvent medium.
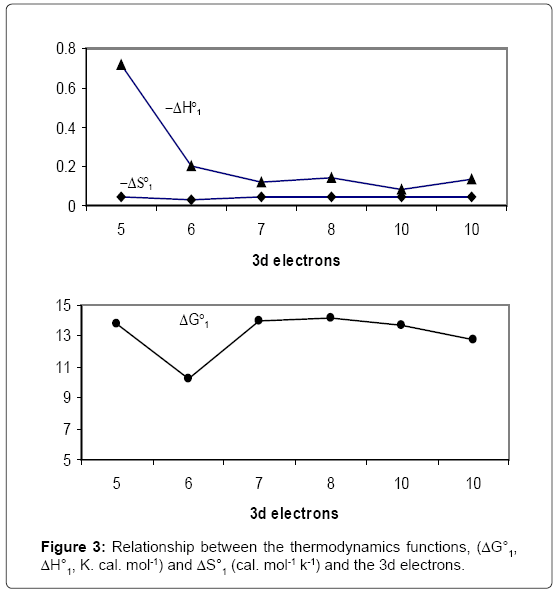
Figure 3: Relationship between the thermodynamics functions, (ΔG°1, ΔH°1, K. cal. mol-1) and ΔS°1 (cal. mol-1 k-1) and the 3d electrons.
Part b, which does not depend on temperature ΔX°non nonelectrostatic or also called Kratk ΔX° c which is due to the molecule or ion is produced from a short term or short range of covalent bonds with the surrounding environment and hence the,
ΔX°non=ΔX°el + ΔX°c
If we look at the degree of covalent bonding, we find that the ion metal has a softener donor [30] and Figure 4 shows the relationship between ΔH°non and quantity En# described in Klopman [30] as a measure of hardness and a softness, where we note that the metal ion soft features with negative values of high-value En# and vice versa (Table 3).
| Complex(HL) | G° (K. cal. Mol-1) | ΔH° (K. cal. Mol-1) | S° (K. cal. Mol-1) | |||||||
|---|---|---|---|---|---|---|---|---|---|---|
| -ΔG°el | -ΔG°non | -ΔH°non | ΔH°el | ΔS°el | ||||||
| logk1 | logk2 | logk1 | logk2 | logk1 | logk2 | logk1 | logk2 | logk1 | logk2 | |
| Co(II) | 11.3959 | 11.8801 | 2.5944 | 2.76177 | 5.01251 | 5.17988 | 4.89164 | 5.09949 | 53.7543 | 56.0383 |
| Cd(II) | 11.2204 | 12.2145 | 2.4787 | 3.0236 | 4.89681 | 5.44171 | 4.81629 | 5.24301 | 52.9262 | 57.6155 |
| Ni(II) | 11.4689 | 11.8741 | 2.64602 | 2.78171 | 5.06413 | 5.19982 | 4.92298 | 5.09689 | 54.0987 | 56.0097 |
| Zn(II) | 10.533 | 10.9843 | 2.23716 | 2.45127 | 4.65526 | 4.86937 | 4.52123 | 4.71497 | 49.6838 | 51.8128 |
| Fe(III) | 8.73795 | 9.76253 | 1.53631 | 1.88442 | 3.98 | 4.30252 | 3.75072 | 4.19052 | 41.2168 | 46.0497 |
| Mn(II) | 10.8026 | 11.9365 | 2.93815 | 2.77479 | 5.35626 | 5.19289 | 4.63697 | 5.12367 | 50.9557 | 56.304 |
Table 3: Electrostatic (el) and non-electrostatic thermodynamic parameters for the reaction of metal ions with HL ligand in 75 % a(v/v) ethanol-water at 30°C.
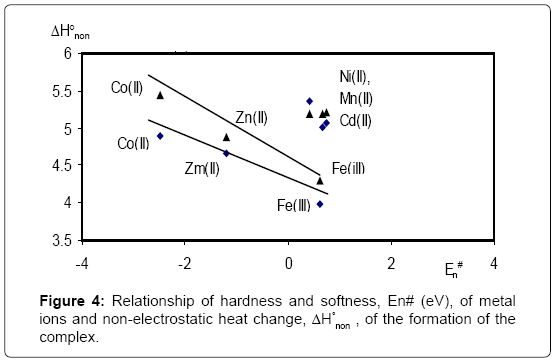
Figure 4: Relationship of hardness and softness, En# (eV), of metal ions and non-electrostatic heat change, ΔH° non , of the formation of the complex.
As is clear from the Figure 4 that there is a linear relationship between ΔH°non and the number of En # ΔH°non in the sense that increases as the increased softness of the softer metal ion. According to many authors [31-33], the change in electrostatic enthalpy ΔH°non arise from changes that occur in the area of changes in the ligand field (LSF) associated with the composition of the complex. The following forms (Figures 5a, 5b, 6, 7 and 8) and after excluding the ion Fe (III), show the relationship between each of the electronegativity (Xm) and second ionization potential (2Ip) for ions metals with a fixed configuration logK1 as well as with a fixed configuration log (K1K2) and note that the constants of the configuration log (K1K2) of the complexes are growing linearly with the increase electronegativity (Xm) or increase the ionization potential of the metal ion bilateral charge (2Ip).
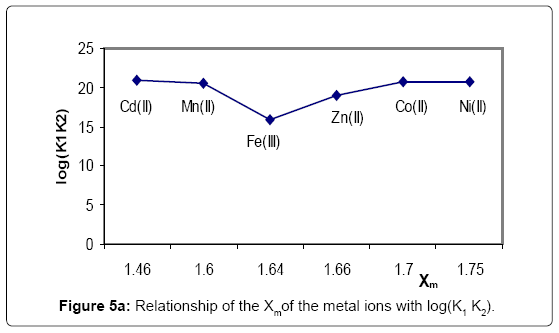
Figure 5a: Relationship of the Xm of the metal ions with log(K1 K2).
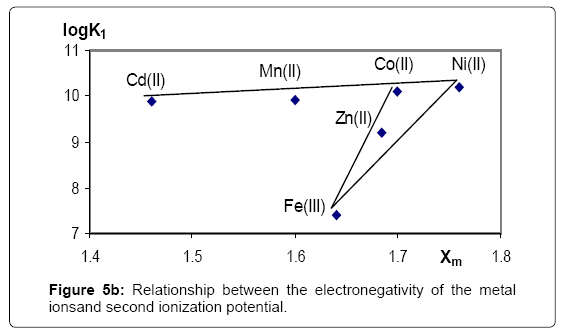
Figure 5b: Relationship between the electronegativity of the metal ionsand second ionization potential.
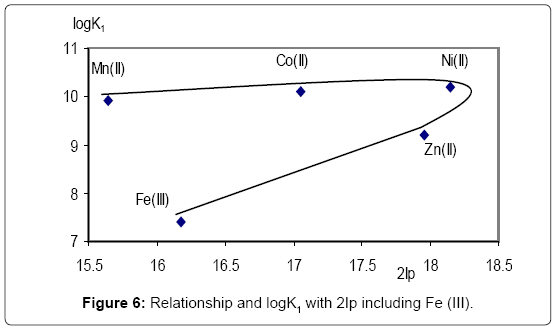
Figure 6: Relationship and logK1 with 2Ip including Fe (III).
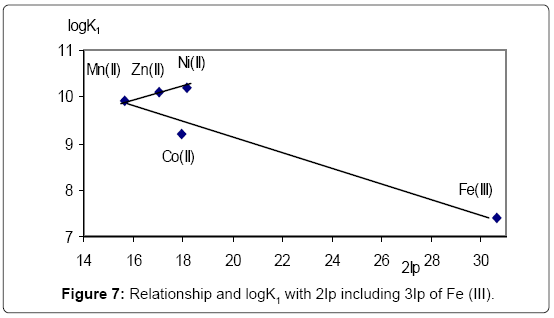
Figure 7: Relationship and logK1 with 2Ip including 3Ip of Fe (III).
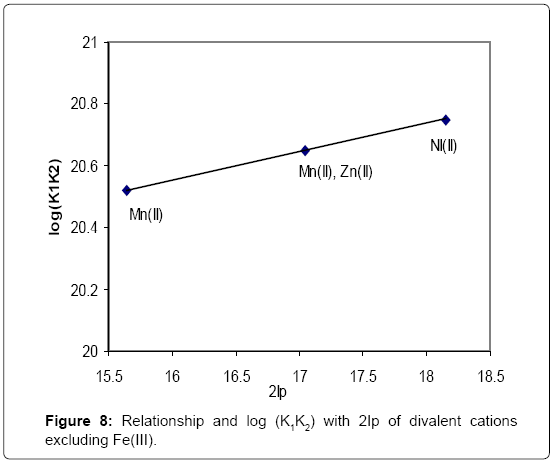
Figure 8: Relationship and log (K1K2) with 2Ip of divalent cations excluding Fe(III).
This reflects the stability of the complexes are getting an increase of Xm and hence the link between the metal and ligand increase in the properties of covalent and confirmed by the linear relationship between ΔHnon and Xm (Figure 9).
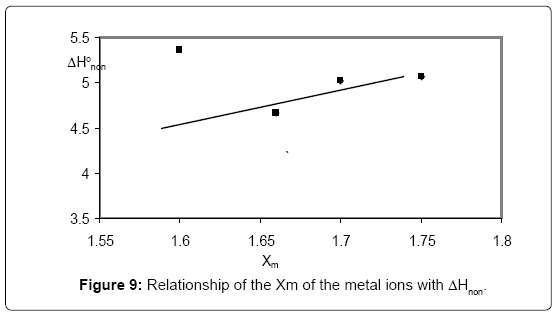
Figure 9: Relationship of the Xm of the metal ions with ΔHnon.
On the other hand, the property of the bond in covalent complexes can infer from the linear relationship (Figure 10) between ΔHnon and ANm acceptor number of the cations [34].
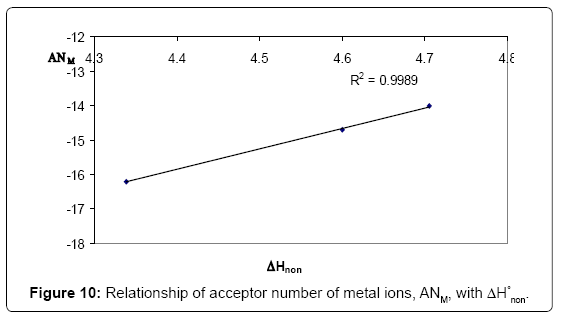
Figure 10: Relationship of acceptor number of metal ions, ANM, with ΔH° non.
Acceptor number (AN) known as a quantitative measure of Lewis acidity according to the ability to form a covalent bond with a pair of electrons. We can summarize the above, we found that the ΔH°non associated with a positive relation with the donor acceptor number while ΔH°el and ΔS°el linked to a positive relation with half radii of metal ion (Figures 11 and 12).
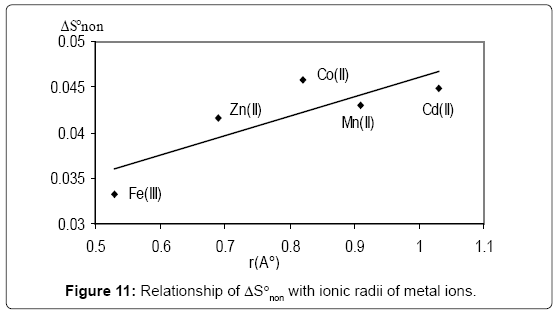
Figure 11: Relationship of ΔS°non with ionic radii of metal ions.
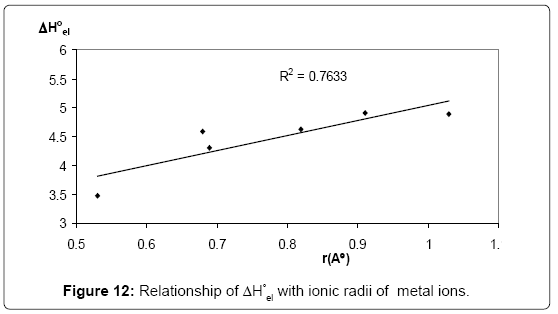
Figure 12: Relationship of ΔH°el with ionic radii of metal ions.
Conductometric titration
In order to get information on the composition of complexes we have had adjustments electrical conductivity. It is known that this measurement shows that the measured amount reflect and directly proportional to the concentration of one or more of the ions. When the interaction between metal ions and ligand we get calibration curve, which consists of two or more lines transmit at the equivalent point (the point that determine the structure of the complex) [35].
Figure 13 showed conductometric titration curve of the ligand, HL, with metal ions, in which electrical conductivity increases continuously whenever we add ligand to the metal ion and continue to increase until we reach the equivalence point for the titration. It is also clear that this behavior was attributed to the replacement of some metal ions with some of complex molecules. When you add the following drop of ligand we note that there is a slight increase in the values of electrical conductivity, which reflects that the added ligand remains without reaction and that increase could be due to the accumulation of ligand molecules. Titration curve and electrical conductivity appear to be complex double transmittance which reflects the percentage of M:2L and M:L, and corresponds with the results of potential titrations. Titration electrical conductivity has been made under the same conditions of potential titration.
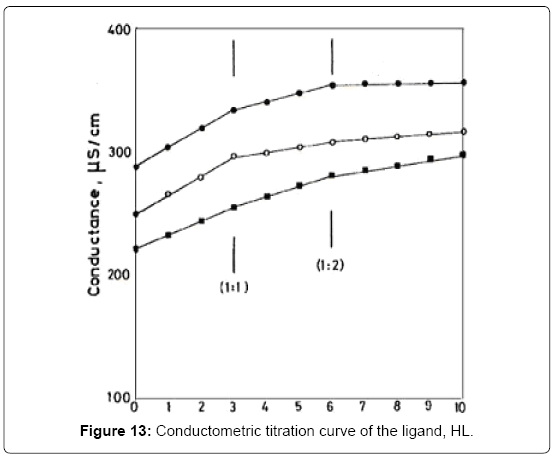
Figure 13: Conductometric titration curve of the ligand, HL.
Spectrophotometric measurements
The spectra of organic molecules are usually affected by the nature of the solvent and observed the influence of peaks intensity and position of the absorption top λm. The influence depends on several factors, including, for example, the physical properties of solvent such as dielectric constant and the determination of the dipole moment and refractive index as well as the ability of the solvent on the interaction through the formation of hydrogen bonds.
Determination of stoichiometry of the formed complex
The method used to determine the percentage molar ratio to form the complex.
1. Job's method [35-39] derived from equation (1), the interaction between the metal ion Mn+ and organic ligand.
2. Molar ratio method [40-42], where the metal ion concentration was constant while changing the concentration of [ligand]/metal ion] and when we plot the values of absorption of these solutions against molarity ratio we get the straight lines intersect each two of them at a certain rate. Contrary to the method that we can make ligand concentration fixed and change the metal ion concentration was measured [metal ion]/[ligand] absorption of solutions at required pH.
3. Slope-ratio method in this way prepares two series of solutions. Save in the first series ion concentration element constant while changing the ligand concentration. In the second series saves the ligand concentration ion concentration fixed and changes the element. The pH value of the two methods was constant and measured the absorption using both the contents of the standard solution except the ion element.
We used the Molarity ratio method to determine the Molarity ratio of the complexes Co (II)-ligand, and Ni (II)-ligand as follows the preparation of a series of solutions, size 10 ml consisting of 0.2 ml of a solution of concentration [2-10 M] of the ions Co (II), Ni (II) and Mn (II). Then added 0.05, 0.1, 0.2, 0.3, 0.4, 0.5, 0.6, 0.7 and 0.8 ml of a solution focus ligand [2-10 M] added buffer (3 ml) and then to complete the 10 ml of 70% (v/v) Ethanol-water, when ionic strength m=0.5 M and then measured the spectrum of the figure turns out to be ML1 and ML2 (Figure 14). We will discuss the spectra of the complexes Co (II)- ligand (as an example to the rest of the complexes) as a function of ligand concentration and analysis of the results at wavelengths different that the ions Co (II) and Ni (II) are two entities essential and the two main complex species are 1:1 and 2:1 metal to the ligand.
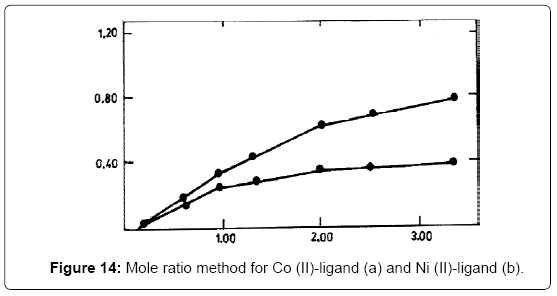
Figure 14: Mole ratio method for Co (II)-ligand (a) and Ni (II)-ligand (b).
n (CL)/n (CM)
The results of this method agreed with the results of measuring the pH adjustments previously discussed, where the Co (II), Ni (II), as an example to the rest from complexes, ML and ML2 overlapped with ligand HL
Validity of Beer's law
Using a constant concentration of ligand HL (1 × 10⁻³ M) and change the concentration of ions Co(II), Ni(II) and Mn(II) in a mixture of ethanol-water percentage of 75% (v/v) and when the ionic strength (=0.05 using potassium nitrate and ligand reference when λ=500 nm and found that they all follow the Beer law of standard deviation 0.002, 0.006 and 0.03 respectively during the concentration of metal ion complexes with Co (II) of 1×10⁻⁵ .
WTWD-812 Weilneium-conductivity meter, model LBR, fitted with a cell model LTA100 to 4 × 10⁻⁴ M With Ni (II) and the values of molar absorptivity (ε) at 500 nm for the complexes of Co (II), Ni (II), Mn (II) are respectively 6.6 × 10³, 8.0 × 10³ and 1.4 × 10³ dm3mol-1cm-1, indicating that HL can be used as a sensitive factor in the specific analysis to determine the copper (II) and nickel (II) form (Figure 15).
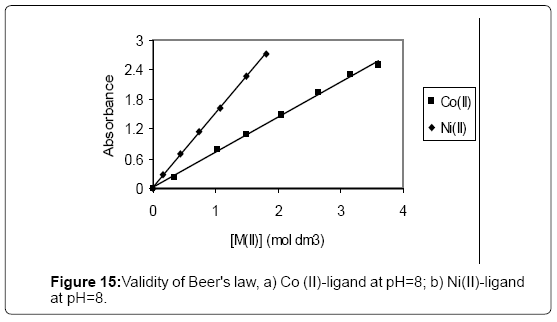
Figure 15: Validity of Beer's law, a) Co (II)-ligand at pH=8; b) Ni(II)-ligand at pH=8.
The pH metric titrations in 75% (v/v) ethanol-water of the free ligand and its mixtures with the metal ions were carried out as described previously [6-9]. Using the equations of Irving and Rossoti [20] the caves were used to calculate the formation constants of the following equilibria:
M2+ +HL ? ML+ + H−
and
ML+ +HL ? ML +H+
The experimental reading was used to calculate the values of  and PL. From which the stability constant logK1 and logK2 were calculated with the help of the following equations given by Irving and Rossoti [20].
The metal-ligand stability constant was obtained using a linear plot method by plotting  or
or  against. Where is defined by Irving and Rossetti [20] as the average number of the reagent molecules attached per metal ions. It can be obtained from the following relations:
and
Where V2 and V2 are the volumes of alkali required to reach the same pH value, V0 is the total volume of titrating mixture, N0 and E0 are the concentration of free acid, and pL, is the free ligand exponent. The experimental reading was used to calculate the values of and from which the stability constant logK1 and logK2 were calculated with the help of the following equations given by Irving and Rossetti [20].
The variations of pKH, logK1 and logK2 vs 1/T gave straight lines which enable us to calculate the thermodynamic parameters ΔGo, ΔHo, and ΔSo of the complex formation by the Vant-Hoff equation and other relationships [21,22]. Conduct metric titrations were carried out at room temperature by titrating 30 ml metal ion solution (1 × 10⁻³ mol dm-3) with the ligand solution (1 × 10⁻² mol dm-3) as tyrant using.
The present work describes the complex formation equilibria was investigated to ascertain the composition and stability constants of the complexes. The effect of ligand properties on the stability of the complexes was investigated. After tracing the complexation properties of discrete ligands towards different metals, it is also easier to correlate the data to the origin matter. As phenolic acids are a significant part of the chemical structure of substances it can be postulated, from the data obtained, that they can have an important role in their complication properties, mainly due to the presence of a hydroxyl group. To note that the discrete ligands used in previous studies only possess a phenolic function, usually in an ortho-position.
From the results obtained one can propose this type of structure corresponds to suitable discrete legends. Owning to their natural origin, phenolic acids could also be proposed, as the stability constants were found to be rather high. The protonation constants (pK1 and pK2) were determined by Irving-Rossetti pH titration technique. Also metal-ligand stability constants of their complexes with metal ions (Mn2+, Co2+, Ni2+ and Cu2+ Zn2+, Cd2+ and Fe3+) have been determined potentiometrically. It appears that PAAS are a better complexion agent with metal ions compared with the other: Mn (II)<Co (II)<Ni (II)<Cu (II)<Zn (II)<Cd (II)<Fe (III). The corresponding thermodynamic parameters (ΔG, ΔH and ΔS) were derived and discussed the dissociation process is non-spontaneous.