Journal of Chromatography & Separation Techniques
Open Access
ISSN: 2157-7064
ISSN: 2157-7064
Research Article - (2012) Volume 3, Issue 8
This work proposes a procedure to estimate the measurement uncertainty for the quantification of cefazolin by high-performance liquid chromatography (HPLC) and microbiological assay (bioassay). HPLC method was performed according to United States Pharmacopeia (USP) and bioassay according to Brazilian Pharmacopeia (FB). The quantification of cefazolin by high-performance liquid chromatography was assess through the calibration curve equation (Y=0.0199 X–0.0323). The HPLC uncertainty was estimated based on the error of the slope and the intercept (between 4.4% and 5.3%). The bioassay uncertainty was estimated based on the standard deviation of inhibition zones of samples and standards solutions (between 6.2 and 6.7%). The uncertainties for bioassay are expected to be higher those obtained by HPLC. Both HPLC method and bioassay estimated uncertainties are reasonable for the scope of each method.
Keywords: Bioassay; HPLC
Since the publication of ISO 17025, the interest in methods for estimation of the uncertainty in have became more important. Several important decisions are based on analytical results of high-performance liquid chromatography and microbiological methods. Because of this, the validation of the method used, as well as the evaluation of uncertainty associated with the results, guarantees the quality and reliability of the results obtained [1-5].
High-performance liquid chromatography (HPLC) has been successfully employed in the analysis of several antibiotics, such as aminoglycosides [6,7], macrolides [8], cephalosporin [9] and others [10]. Standard calibration curves are often employed in analytical chemistry, including HPLC methods. The content of cefazolin in pharmaceutical dosage forms may be quantify by the comparison of the areas obtained in the chromatograms of the samples and the areas obtained in the standard calibration curve chromatograms.
Microbiological methods, such as the agar diffusion assay, are widely used to determine the antibiotic assay, as they facilitate evaluation of the activity of the analyzed antibiotic. The agar diffusion method depends on antibiotic diffusion through a layer of solidified agar in an extension that totally inhibits microbial growth in an area or zone around the reservoir containing the antibiotic solution. In this assay, the size of the inhibition zone and the dose of the substance assayed are correlated [11,12]. It is highly advisable to adopt an experimental planning which, without further effort, supplies better results and enables an indication respecting the assay validity. The number and nature of the samples, as well as the results reliability level, are among the most important factors to be taken into account, in the selection of a design [13-15].
This work proposes procedures to estimate the measurement uncertainty for the quantification of cefazolin by high-performance liquid chromatography based on the standard calibration curve and by microbiological assay employing a dose of unknown and three doses of standards.
Reference standard and samples
Cefazolin reference standard provide by United States Pharmacopeia and commercial samples of cefazolin for injection were used in this study.
High-Performance Liquid Chromatography (HPLC)
The mobile phase used in the analysis of cefazolin was prepared by a mixture of acetonitrile and phosphate buffer solution (1:9). The chromatograph (Thermo) was equipped with a 254 nm detector and a 4.0 mm×30 cm column containing packing L1 (octadecyl silane chemically bonded to porous silica). The flow rate was about 2.0 mL per minute. Solutions containing 0.035, 0.044, 0.052, 0.060 and 0.067 mg of USP cefazolin RS per mL and 0.375 mg of salicylic acid (internal standard) were prepared and filtered, being 10 μL injected [12]. Three commercial samples were analyzed by high-performance liquid chromatograpy.
Microbiological assay (Bioassay)
The plates were prepared by adding 21 mL of antibiotic medium number 2 (peptone 6.0 g/L, yeast extract 3.0 g/L, beef extract 1.5 g/L, agar 15.0 g/L). After solidification, 4 mL of antibiotic medium number 1 (peptone 6.0 g/L, pancreatic digest of casein 4.0 g/L, yeast extract 3.0 g/L, beef extract 1.5 g/L, dextrose 1.0 g/L, agar 15.0 g/L) inoculated with Staphylococcus aureus (ATCC 6538P) were added into each plate [16]. Cylinders were placed into the plates. Standard solutions having 0.5, 1.0 and 2.0 μg/mL and sample solutions having 1.0 μg/mL were distributed into each cylinder [13-15]. The plates were incubated at 37°C for 18 hours. Three commercial samples were analyzed by microbiological assay.
Uncertainty of HPLC method
The quantification of cefazolin by high-performance liquid chromatography was assess through the calibration curve equation (Y=aX+b), where Y is the response, a is the slope, X is the concentration of cefazolin and b is the intercept. The error of the slope (a) and the intercept (b) was estimated by regression analysis. Based on this information, the uncertainty of HPLC’s result was estimated by the following equation:
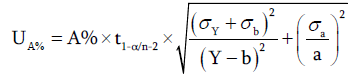 (1)
(1)
where UA% is the expanded uncertainty, t1-α/n-2 is the t-student for confidence level of 1-α and n-2 degrees of freedom (n correspond to the numbers of standard employed to obtain calibration curve), A% is the result of sample (in percentage), σY is the standard deviation of the areas obtained in chromatograms of sample, Y is the average of the areas obtained in chromatograms of sample, σb is the error for the intercept and σa is the error for the slope.
Uncertainty of bioassay
The potency of sample determined by bioassay was calculated according to the equation described by Lourenço [13-15]. Considering the main uncertainties sources, the equation used for the estimation of uncertainty of bioassay’s result is described bellow:
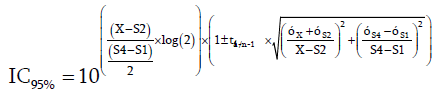 (2)
(2)
where UP% is the expanded uncertainty, t1-α/n-2 is the t-student for confidence level of 1-α and n-1 degrees of freedom (n correspond to the plates employed in bioassay), P% is the estimated potency of sample (in percentage), σX is the standard deviation of the inhibition zones of sample, X is the average of the inhibition zones of sample, σS1 is the standard deviation of the inhibition zones of low level standard, S1 is the average of the inhibition zones of low level standard, σS2 is the standard deviation of the inhibition zones of median level standard, S2 is the average 1of the inhibition zones of high level standard, σS4 is the standard deviation of the inhibition zones of unknown, S4 is the average of the inhibition zones of high level standard and R is the ratio between doses.
Standard calibration curve for HPLC method shows correlation coefficient (r2) of 0.9997 and the following equation: Y=0.0199X–0.0323 (Figure 1). Based on the regression results, the error for slope and intercept was found to be respectively 0.0002 and 0.0094. Table 1 shows the results obtained for quantification of standards and samples of cefazolin by high-performance liquid chromatography.

Figure 1: Confidential limits of HPLC results and bioassay potencies of commercial samples of cefazolin for injection.
| Solution | Concentration (mg/mL) | Cefazolin and Salicylic acid Area Ratio (RSD%)a |
|---|---|---|
| Standard 1 | 36 | 0.691 (0.4%) |
| Standard 2 | 44 | 0.845 (0.3%) |
| Standard 3 | 52 | 0.992 (0.6%) |
| Standard 4 | 60 | 1.156 (0.2%) |
| Standard 5 | 67 | 1.308 (0.9%) |
| Sample A | Unknown | 0.989 (0.6%) |
| Sample B | Unknown | 0.977 (1.0%) |
| Sample C | Unknown | 0.973 (0.5%) |
a Results calculated from three injections
Table 1: Area of standards and samples solutions of cefazolin obtained by HPLC.
The inhibition zone diameters obtained for bioassay of cefazolin are shown in table 2. The uncertainties for bioassay were estimated based on the standard deviation of the inhibition zones of samples and standard solutions. Lourenço and collaborators [17] described a procedure to estimated uncertainty for bioassay based on the results of validation data.
| Solution | Concentration (mg/mL) | Inhibition zone diameter (RSD)a |
|---|---|---|
| Standard 1 (S1) | 0.5 | 17.13 (0.18) |
| Standard 2 (S2) | 1.0 | 19.93 (0.16) |
| Standard 4 (S4) | 2.0 | 22.82 (0.18) |
| Sample A (XA) | Unknown | 20.10 (0.17) |
| Sample B (XB) | Unknown | 20.10 (0.18) |
| Sample C (XC) | Unknown | 19.92 (0.20) |
a Results calculated from six plates
Table 2: Inhibition zones of standards and samples solutions of cefazolin obtained by bioassay.
The uncertainties for the amount of cefazolin present in commercial samples were estimated to be between 4.4% and 5.3%. The uncertainties for the potency of commercial samples of cefazolin were found to be between 6.2 and 6.7%. These uncertainties estimated are also comparable to the uncertainty obtained from method validation data [17]. The uncertainties for bioassay are expected to be higher the those obtained by HPLC, due to the high variability of microbiological method. Considering the 95% confidential limits, we can concluded that the HPLC results and bioassay potencies are equivalent (Figure 1).
Considering HPLC method, a six standard calibration curve may decrease the uncertainty estimated, as it decrease the t-student multiplier. Increasing the number of injections per standard level may also contribute in the reduction of final uncertainty. For bioassay, a increasing in the number of plates employed may decrease the uncertainty, as it decrease the t-student multiplier. Other sources of uncertainties, e.g. uncertainties of volumetric glassware, were not considered since their contribution to final uncertainty has low significance.
These procedures to estimate the measurement uncertainty for the quantification of cefazolin by high-performance liquid chromatography and microbiological assay are simple and may be employed for others antibiotics. Both HPLC method and bioassay estimated uncertainties are reasonable for the scope of each method.