Journal of Chromatography & Separation Techniques
Open Access
ISSN: 2157-7064
ISSN: 2157-7064
Research Article - (2015) Volume 6, Issue 7
The retention mechanism of polar/charged analytes in hydrophilic interaction liquid chromatography (HILIC) remains ambiguous from the sole measurement of their retention factors. It is because thermodynamic properties only relate to the equilibrium relationship between the concentration in the mobile phase and that in the stationary phase. They do not provide any insights regarding their microscopic distribution across the mesopore volume. Chromatographers cannot unambiguously conclude whether analytes are adsorbed onto the surface of HILIC adsorbents, partitioned between the bulk and the water-rich interfacial layer or if both adsorption and partitioning mechanisms participate to the retention mechanism. In order to solve this ambiguity, it is proposed to combine chromatographic data (retention factor, inverse-size exclusion, sample diffusivity along the bed) with molecular dynamics (MD) data. The latter provide microscopic information regarding the structure of the eluent and the average mobility of the analyte across the mesopore. This enables 1) the clear delimitation between three pore regions: the rigid water layer adsorbed onto the solid surface, the interfacial diffuse water layer, and the bulk region, 2) the measurement of the adsorption and partitioning equilibrium constants of the analyte between these three pore regions, and 3) the concentration distribution of the analyte in the pore volume. The benefits of this new approach are demonstrated for a weakly retentive HILIC adsorbent (3.5 μm hybrid organic/inorganic silica particles) in contact with ternary eluent mixtures (acetonitrile/water pH 5/third solvent, 90/5/5, v/v/v). The third solvent has various polarities from water to n-hexane. The results show that, despite having nearly identical retention factors, the retention process of nortriptyline is essentially controlled by a partitioning mechanism while that of cytosine is governed by an adsorption mechanism. On the application side, it is shown how to significantly increase sample retention in HILIC by adding a third solvent in the mobile phase.
Keywords: Retention mechanism; Molecular dynamics; Hydrophilic interaction liquid chromatography; Adsorption-partitioning mechanism; Ternary eluent mixtures; Small molecules
The physico-chemical description of the retention mechanism in either reversed-phase liquid chromatography (RPLC) [1-5], supercritical fluid chromatography (SFC) [6-8], or HILIC [9-17] has been the source of intense researches, discussions, controversies, and speculations over the past decades. These fundamental riddles have been debated since the early ages of liquid chromatography to the modern era of chromatography. From a fundamental viewpoint, these on-going enigmas found their origin in 1) the complexity of the eluent structure (at thermodynamic equilibrium) between the solid phase (bare or grafted solid adsorbents) and the bulk eluent and 2) in the subsequent and unknown distribution of the local sample concentration across the whole diameter of mesopores in HPLC particles. For instance, in HILIC, questions are often raised whether the retention process is controlled by the adsorption of the analyte onto the solid surface or by its partitioning between the bulk eluent (far from the surface) and the interfacial eluent layer that still remains under the influence of the adsorbent chemistry.
In order to elucidate the retention mechanisms in LC, MD simulations have been performed during the last two decades by taking advantage of the rapid increase of computational resources. They provide a wealth of microscopic information that can be combined to the measurement of retention factors and adsorption isotherms by dynamic chromatographic methods [5]. After calibration, these MD simulations provide unprecedented results for the concentration profiles of solvent and analyte molecules across the pores of RPLC silica-C18 [18-26] or HILIC silica-based particles [27-32]. Most interestingly, MD results show that the analyte molecules do not solely concentrate at the solid surface by adsorption but, also, they can accumulate in a pore region far from the wall of the mesopores (interfacial region) according to a partitioning process. This non-uniformity of the distribution of the sample mass in the mesopores inevitably makes the interpretation of chromatographic data speculative, ambiguous, or even impossible.
In the case of HILIC, MD simulations have confirmed the existence of a water-rich layer with rigid and diffuse parts at the interface between the solid silica surface and the bulk liquid phase [27-31]. Typically, the thickness of the rigid water layer is close to 4 Å and the mobility of the solvent molecules is zero in it. The diffuse water layer is thicker (ca. 11 Å wide), the solvent molecules have a finite degree of mobility and their concentration rapidly changes across this layer to reach their bulk concentration far enough from the adsorbent surface. Similar heterogeneity of the eluent structure can be observed by MD in RPLC with the addition of tethered C18 chains amidst the solvent molecules [25,26].
As a result, it is established that the pore volume can be segmented into three distinct regions in which the local sample concentration can be drastically different. Analyte molecules can partition between the bulk and the diffuse water regions but, also, they can be adsorbed from the latter to the rigid water region. By definition, the sole observation of the chromatographic retention factors in HILIC does not allow the experimenter to distinguish between the number of sample molecules present in the rigid and diffuse parts of the water-rich layer: the chromatographer is inevitably facing indetermination. A new method combining chromatographic and MD data is then proposed to differentiate between the contributions of adsorption and partitioning to the overall retention of small, polar, and ionizable analytes in HILIC.
In this work, both the retention factor (elution time, information on the total sample mass present in the pores) and the effective intraparticle sample diffusivity (peak parking data [27-29], information on the average mobility of the analyte across the pores) are measured. They are combined with MD data which provides the local mobility of the analyte across the pores of silica HILIC particles and the delimitation between the rigid water, diffuse water, and bulk regions inside mesopores. This method eventually enables to determine the relative contributions of the adsorption and partitioning processes to the overall retention in HILIC. For the sake of illustration, it is applied to the retention behavior of a few ionizable analytes onto a 3.5 μm hybrid organic/inorganic HILIC stationary phase using ternary mixtures of acetonitrile (90% in volume), water (5%), and of a third solvent (water, ethanol, THF, ACN, or n-hexane, 5%).
Definitions
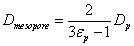
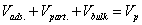
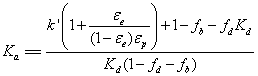
The inter-particle and particle porosities of the HILIC chromatographic column are noted εe and εp, respectively. The column hold-up volume is V0. The eluent inside the mesopores of bare silica HILIC particles consists in three layers : an adsorbed or rigid water layer (volume Vads.), a diffuse water layer (volume Vpart.), and the bulk eluent (volume Vbulk) far from the surface [27,28]. The volume fractions occupied by the bulk phase and the diffuse water layer in the pores are noted fb and fd, respectively. The volume fraction occupied by the rigid water layer inside the pores is then fa=1- fb-fd. The total pore volume is Vp.
The mole number of the analyte in the rigid water layer, in the diffuse water layer, in the bulk region, in the inter-particle volume are na, nd, nb, and ne. The number of mole present in a hypothetically inert (no preferential adsorption of the solvent and analyte molecules) pore is np.
The reference sample concentration in the bulk eluent is cb. Its average concentration in the diffuse and rigid water layers are cd and ca, respectively. These three concentrations define two independent equilibrium constants Kd and Ka, relative to the partitionning between the bulk and diffuse water layer and to the adsorption between the diffuse water layer and the rigid water layer. Accordingly:
 (1)
(1)
and
 (2)
(2)
The local diffusion coefficients (or mobilities) of the analyte in the bulk phase and in the diffuse water layer are Dm and δDm, respectively, whereby the value of δ depends on the acetonitrile volume fraction in the bulk mobile phase [27-29]. The local mobility in the rigid water layer is by definition equal to zero (due to the physisorption of the analyte).
The effective sample diffusivity along the chromatographic bed is Dbed. The coefficient Ω is defined as the ratio of the sample diffusivity across each single particle, Dp, to the bulk diffusion coefficient (note that Dp is defined with the convention that the reference concentration gradient is defined with respect to the bulk concentration cb):
 (3)
(3)
Finally, the effective sample diffusivity across the mesopores of the particles is Dmesopore.
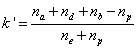
Retention factor
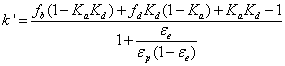
The retention factor also called capacity factor k’ is defined as the amount of sample present in the column minus the amount of sample present in the column for an inert adsorbent and divided by the latter amount. From the definitions given in the previous section and after simplification, k’ is written:
 (4)
(4)
It is noteworthy that the observed retention factor depends on the column (εe) and particle (εp) porosities, on the volume fractions occupied by two of the three regions inside the mesopores (fb and fd), and by the equilibrium constants Kd and Ka. Equation (3) describes quantitatively the inherent ambiguity that the chromatographer is facing when measuring only retention factors: no information is received regarding the distribution of the analyte across the mesopore volume in the three pore regions. For this reason, the average mobility of the analyte across the mesopore is needed. It is given from diffusivity data as explained in the next section.
Effective sample diffusivity through the bed, the porous particles and the mesopores
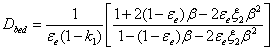
The only sample diffusivity that the chromatographer can directly observe is the effective diffusivity Dbed along the packed bed immersed in the mobile phase. This can be achieved by the peak parking method [33-35].
For columns packed with fully porous particles, the most relevant model of effective diffusion in heterogeneous binary (1-particles filled with eluent, 2-external eluent) media is the Torquato model [36]. Accordingly, Dbed is written:
 (5)
(5)
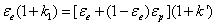
Where k1 is the zone retention factor defined by:
 (6)
(6)
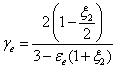
β is a function of the ratio Ω:
 (7)
(7)
and 2 is a constant (=0.627) given by the external porosity (=0.39) and the external obstruction factor ξe (=0.57) of the bed:
 (8)
(8)
The experimental protocol applied to extract the coefficient Ω from the measurement of the longitudinal diffusion coefficient B=2(1+k1) Dbed has already been described elsewhere [37-39]. For porous particles, the effective sample diffusivity in a heterogeneous binary (1-solid silica, 2-mesopore eluent) medium is well described by a classical Landauer model [40]. According to this model, the effective sample diffusivity across the mesopores is directly related to the above-defined diffusivity coefficient Dp [39]:
 (9)
(9)
A time-averaged model of effective diffusion was considered for the effective diffusion of the analyte in the mesopores because these three regions can be considered as parallel to each other in space. Therefore, a new relationship is written between Ω, εp, fb, fd, and Kd [39]:
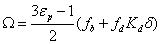 (10)
(10)
Figure 1 schematizes this succession of calculations that lead to the measurement of the effective sample diffusivities along the bed, across the particles, and through the mesopores.

Figure 1: The three different effective sample diffusivities measured in a chromatographic column: the packed bed (left), the porous particles (center), and the internal eluent in the cylindrical mesopores (right, rigid water layer in blue, diffuse water layer in cyan, and bulk internal eluent in green). The effective diffusion coefficients in these three heterogeneous media (bed, particle, and internal eluent) were predicted from Torquato’s, Landauer’s, and time-averaged models of effective diffusion, respectively. Reproduced with permission of Ref [39].
Chromatographic data
Standard elution and inverse size-exclusion chromatography are applied for the measurement of the retention factor (k’), the total mesopore volume (Vp), and the hold-up volume (V0). Accordingly, these data provide two independent relationships. One for the total pore volume:
 (11)
(11)
The second for the retention factor:
 (12)
(12)
Since the retention behavior (combining adsorption and partitioning) is fully determined from the knowledge of the six independent variables (V0, Vads., Vpart., Vbulk, Kads., and Kpart.) and V0 is known, three additional relationships are missing. They will be given by molecular dynamics data.
Molecular dynamics data
All the details regarding the MD simulation of the equilibrium process between the solvent molecules in a ternary mixtures and the silica surface are given in reference [27,28]. To summarize: an open cylindrical silica-based pore is generated by computer (β-cristolabillite structure), it is in equilibrium with a solvent reservoir flanked at each side of the cylinder, the force fields for the different solvent components are selected so that the simulated results match the experimental properties of the bulk mobile phase mixtures, the total number of solvent molecules is around 15 000 in this single pore, and the recorded simulation time last ~ 6 ns after the sytem was conditionned during nearly 150 ns. The equations of motion were integrated with a 1 fs time step so that 6 millions molecular configurations were recorded before calculating the density and mobility profiles of the solvent molecules across the pore diameter.
Eventually, MD allows to unambigously decouple the roles of adsorption and partitioning on the overall retention process in HILIC once k’ (Equation 4) and Ω (Equation 10) are known from chromatographic data. Indeed, three independent and additional information are directly derived from the results of the MD calculations: the volume fractions of the rigid and diffuse water layer (fa and fd from the calculated density profiles) as well as the local mobility, δDm, of the solvent molecules in the diffuse water region (from the calculated mobility profiles). Figures 2 and 3 show the MD results for the density and mobility profiles of the solvent molecules across the cylindrical pore.

Figure 2: Density profiles of acetonitrile (ACN), water (W), and of the third solvent (Alc) across the silica-based cylindrical pore. The volume fractions of ACN, W, and Alc in the bulk ternary eluent are 90%, 5%, and 5%, respectively. Alc=water (black solid line), methanol (blue solid line), ethanol (green solid line), isopropanol (red solid line), or acetonitrile (gray solid line). Note the delimitation between the pore regions I (rigid water layer), II (diffuse water layer), and III (bulk region). Reproduced with permission of Ref [30].

Figure 3: Mobility profiles of acetonitrile (ACN) and water (W) across the three regions of the silica-based cylindrical pore. Volume fractions of ACN in the bulk eluent: 70% (solid green line), 95% (solid blue line), and 99% (solid black line). Reproduced with permission of Ref [29].
Decoupling adsorption from partitioning retention mechanisms
Chromatographic and MD data are combined to solve the equilibrium problem set by Equations 11 and 12. First, the measurements of Ω (chromatography) and δ (MD) provides the partitioning constant Kpart. from Equation 10. Secondly, the measurements of k’, Vp, V0 (chromatography), fa, and fd (MD) enables the measurement of the adsorption constant Ka from Equation 4. Therefore [39]:
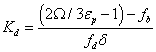 (13)
(13)
and
 (14)
(14)
Equation 13 and 14 can then be used to determine the molar fractions of the sample molecules present in the rigid water layer, in the diffuse water layer, and in the bulk region of the mesopore.
Chemicals
The mobile phases were prepared by mixing 225 mL of acetonitrile, 12.5 mL of a buffer stock solution (pH 5) prepared from 200mM ammonium acetate and glacial acetic acid, and 12.5 mL of a third solvent (water, ethanol, tetrahydrofuran, acetonitrile, or n-hexane). The buffer concentration in the mobile phase is then 10mM. All solvents were HPLC grade from Fisher Scientific (Fair Lawn, NJ, USA). Acetonitrile was filtered before use on a surfactant-free cellulose acetate filter membrane, 0.20 μm pore size purchased from Sigma-Aldrich (Suwannee, GA, USA). Eleven polystyrene standards (MW=590, 1100, 3680, 6400, 13200, 31600, 90000, 171000, 560900, 900000 and 1870000) were purchased from Phenomenex (Torrance, CA, USA) and used to perform inverse size-exclusion chromatography (ISEC) experiments. Ammonium acetate and glacial acetic acid for buffer preparationwere purchased from Sigma–Aldrich. Toluene, cystosine, nortrriptyline (hydrochloride), and nicotinic acid (see Figure 4) were all purchased from Fisher Scientific, with a minimumpurity of 99%.

Figure 4: Structures of the four small molecules analytes studied in this work. (Top left) Toluene, (Top right) Cytosine with pKa,1=4.6 and pKa,2=12.2, (Bottom left) Nortriptyline with pKa=10, (Bottom right) Niacin with pKa,1=2.1 and pKa,2=4.8. Note that the polar compounds are all partially charged at pH 5.
Apparatus
Chromatography measurements were all performed on a 1290 Infinity HPLC system (Agilent Technologies, Waldbroon, Germany) liquid chromatograph. This system includes a 1290 Infinity Binary Pump with solvent selection valves and a programmable auto-sampler. The injection volume is drawn into one end of the 20 μL injection loop. The instrument includes a two-compartment oven and a multidiode array UV-Vis detection system. The system is controlled by the Chemstation software. The sample trajectory in the equipment involves the successive passage through the 20 μL injection loop attached to the injection needle, a small volume needle seat capillary (~ 1 μL), a small volume injection valve (~ 1.2 μL), two 130 μm × 250 mm long Viper connecting capillaries (3.3 μL each) and a standard volume detection cell (2.4 μL). The extra-column volume is then close to 10 μL.
Column
The HILIC column used was a 4.6 mm × 100 mm column packed with 3.5 μm hybrid organic/inorganic fully porous (130 Å) silica particles. This silica material designed to enhance pH stability of the column from pH 2 to pH 10 was provided by the manufacturer (Waters, Milford, MA, USA). The external, total, and particles porosities measured from ISEC were 0.39, 0.72 and 0.54 respectively.
Measurement of the retention factor k’
By convention, all the retention factors were measured with reference to the elution time of toluene in pure THF for the hold-up time. All the retention times were corrected for the extra-column time. The volumetric flow rate was fixed at 1 mL/min. Even though there are as many t0 as tracers used to measure it, the hold-up time should always be measured from a pure solvent in order to avoid the possible exclusion of toluene from the water-rich layers when using an acetonitrile-rich mobile phase. The temperature was set by the lab air-conditioning system (297 ± 1 K). The measurement of k’ was performed after one to two hours equilibration time. The relative standard deviations were smaller than 0.5% for water, ethanol, and THF as the third solvent and smaller than 3% for acetonitrile and n-hexane.
Measurement of the bed diffusivity Dbed
The effective sample diffusivity along the chromatographic bed was measured from the classical peak parking method as previously described in references [33-35]. It is directly proportional to the slope of the time variance, σt 2, of the eluted peak versus the parking time, tp, and to the square of the linear migration velocity uR. Accordingly,
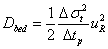 (15)
(15)
Measurement of the intra-particle diffusivity Ω
The coefficient Ω is measured by combining Equations 5-8 (Torquato’s model) with Equation 15 (peak parking data). The mathematical solution of this problem (a second order algebraic equation has to be solved) is given in reference [39].
Chromatographic data
Retention factor: Figure 5 shows the eluted peak profiles of toluene, cytosine, nortriptyline, and niacin in mobile phases of 90/5/5 (v/v/v) acetonitrile/aqueous acetate buffer (pH 5)/third solvent for water, ethanol, tetrahydrofuran, acetonitrile and n-hexane as the third solvent. The polarity of the third solvent decreases in that order. Its role is to enhance the retention factor of polar analytes, which are too poorly retained onto thehybrid organic/inorganic silica HILIC column [41]. Expectedly, toluene, the apolar compound, is not retained irrespective of the nature of the thrid solvent. Niacin, which carries a partial negative charge at pH 5, is the most retained compound. The partially positively charged compounds, cytosine and nortriptyline, show intermediate retention. It is striking to observe that, unlike niacin, the retention time of the positively charged compounds do not increase monotously with decreasing the polarity of third solvent. In particular (see the red and black colored chromatograms corresponding to two different absorption wavelengths), the elution order of cytosine and nortriptyline changes from water to ethanol and from ethanol to tetrahydrofuran. Additionally, the retention time of nortriptyline goes through a maximum for tetrahydrofuran as the third solvent while the retention time of cytosine increases monotoneously from the most to the least polar third solvent. One hypothesized explanation for the increase of retention with decreasing the polarity of the thrid solvent is the relative increase of the water content in the diffuse water region with respect to the bulk phase [27] and the increasing importance of a partitioning mechanism.

Figure 5: Chromatograms of the four compounds tested in this work on the hybrid organic/inorganic silica HILIC column with ternary mobile phases of 90/5/5 (v/v/v) acetonitrile/200 mM acetate buffer pH 5/third solvent. See the experiments section for the experimental conditions selected. Reproduced with permission of Ref [39].
Figure 6 summarizes these retention data by plotting the experimental retention factor of the four compounds as a function of the nature of the third eluent. Whereas the retention behavior of toluene (non-retained compound) is clear, those of cytosine, nortriptyline, and niacin remain puzzling. They illustrate why chromatography alone and the mere measurement of retention factor cannot provide relevant clues regarding the observed differences in retention behavior. At this point, it is not possible to tell whether their retention is mostly controlled by an adsorption, a partitioning, or by both mechanisms and how the intensity of these two contributions is changing when decreasing the polarity of the third solvent. Additional information is needed to conclude where the sample molecules spend much of their time inside the mesopores : do they accumulate at the surface (in the rigid water layer) or in the interfacial region (in the diffuse water layer)? This enigma can only be solved by measuring complimentary data. Next, it is shown how the measurement of the intra-particle porosity can solve this problem from a qualitative viewpoint.

Figure 6: Plots of the experimental retention factors k’ of the four analytes as a function of the nature of the third solvent in a mobile phase of acetonitrile/ aqueous acetate buffer (pH 5)/third solvent, 90/5/5, v/v/v. Reproduced with permission of Ref [39].
Intra-particle diffusivity
The intra-particle diffusivity coefficient Ω (Equation 10) is a measure of the average mobility of the analyte through the particle. It is obviously hindered by the presence of the solid silica walls. In the case of hybrid organic/inorganic silica particles, the volume fraction occupied by the internal eluent is εp=54%. The sample molecules diffuses accross the particles when present in either the bulk region III (local mobility Dm) or in the diffuse water region II (local mobility δDm) of the mesopores (see Figure 2). The sample molecules present in the rigid water layer I do not contribute to the mobility across the particle because they are physisorbed (zero local mobility). The coefficient Ω is expressed quantitatively by Equation 10.
In order to validate the selection of the Landauer’s and time-averaged models for the effective sample diffusivity across each individual HILIC particle (see Equation 9), the coefficient Ω was roughly estimated for a non-retained apolar compound that is fully excluded from the waterrich regions I and II. The volume fraction occupied by the bulk phase in cylindrical pores is fb=62% (see delimitations between regions I, II, and III in Figure 2). The corrected particle porosity is then εp=0.54 × 0.62 ~ 0.33. Considering a physically relevant pore obstruction factor (combining internal tortuosity and constriction) γi~0.60 [42] and a diffusion hindrance parameter F()=0.81 for small molecules (Renkin correlation, pore size 140 Å and sample size 7 Å) [43], the expected coefficient Ω would take a value of εp × γi × F(λ)=0.33 × 0.60 × 0.81=0.16. According to the Landauer’s and time averaged models (Equation 10), Ω would be ½ (3 × 0.54 -1) × 0.62=0.19. The combination of these two models is then justified. Finally, the experimental values of Ω for toluene were measured at 0.22 [39]. This slighly larger value could be consistent with the fact that toluene is actually not fully excluded from the diffuse water layer.
Therefore, for the three retained compounds and according to Equation 10, the measurement of the coefficients Ω reveals how important the contribution of the partionning mechanism to the overall retention can be with respect to toluene. Figure 7 shows the plot of Ω as a function of the nature of the third eluent. As expected, Ω values are all larger than 0.22. This confirms that these polar analytes are all present in the diffuse water layer at equilibrium. Most remarkable is the difference between the W values of nortriptyline (large) and those of cytosine for ethanol and tetrahydrofuran as the third eluent. Whereas their retention factors are quasi-identical (see Figure 6), their mobility inside the mesopores of the hybrid organic/inorganic silica particles are much different. This demonstrate that nortriptyline molecules accumulates more than cytosine in the diffuse water layer. A partionning mechanism is then clearly relevant for nortriptyline. This conclusion cannot be drawn from simple measurement of the retention factor (Figure 6).

Figure 7: Plots of the experimental diffusivity coefficients, Ω, of the four analytes used in this work as a function of the nature of the third solvent in a mobile phase of acetonitrile/aqueous acetate buffer (pH 5)/third solvent, 90/5/5, v/v/v. Reproduced with permission of Ref [39].
Finally, Figure 7 shows that no general conclusion can be drawn about the effect of the third solvent on the retention mechanism of the analytes. It inevitably depends on the nature of the analyte and on its distribution between the bulk, the diffuse water region, and the rigid water region.
Molecular dynamics data
Eluent structure in the mesopore: Figure 2 shows the calculated density profiles of the solvent molecules (acetonitrile, water, and third solvent) as a function of the distance z from the surface of the adsorbent. All the calculations were based on the MD simulations as presented in the theoretical section 5. The MD data enables to distinguish three regions (I, II, and III) within the mesopores of the HILIC particles: 1) beyond 15 Å from the pore wall, the eluent composition is equal to the bulk eluent composition. 2) from 0 to 4 Å, all the solvent molecules are physisorbed and the region II is called the rigid water layer. Water is in large excess in this region relative to its bulk concentration. Acetontrile is mostly excluded from the surface of the adsorbent while the amount of third solvent molecules adsorbed increases from isopropanol to ethanol and to methanol. This is consistent with a reduction of the steric hindrance from large to small molecules easing the way to the surface. Finally, in between z=4 Å and z=15 Å, the concentration of all the solvent molecules is changing dramatically which defines the pore region II or the diffuse water layer. Alltogether, the pore regions I and II form the interface volume between the the solid adsorbent and the bulk eluent. Its physico-chemical properties (polarity, mobility, relative permittivity, etc.) contrast with those of the bulk : for instance, its polarity is much larger than that of the acetonitrile-rich eluent, the local molecular mobility is severely reduced in the water-rich interface region (higher viscosity and lesser degree of freedom under the action of the solid adsorbent), and its relative permittivity is close to that of pure water (εr=80.1 versus εr=37.5 for pure acetonitrile). In conclusion, the distribution of the solvent molecules in the mesoporous volume of HILIC particles is highly non-uniform. The same heterogeneity in the concentration of the analyte molecules can be expected based on their distribution between the three delimited pore regions.
These MD results for the density profiles of the eluent molecules enable the calculation of the volume fractions fb (region III) and fd (region II). Assuming cylindrical pores and a unimodal pore size of 140 Å, fb =62%, fd=27%, and, so, fa=12% (region I). These numerical data are indispensable for the measurement of the equilibrium constant Kd (Equation 13) and Kd (Equation 14).
Solvent mobility in the mesopore
Figure 3 plots the mobilities (in cm2/s) of the solvent molecules along the direction normal to the HILIC surface. They were calculated from MD. Irrespective of the solvent molecule (water, acetonitrile, and third solvent), the local diffusion coefficient monotoneously increases with increasing the distance from the adsorbent surface. The molecular mobility is rigorously zero in region I (due to physisorption) and it is equal to the bulk diffusion coefficient in region III (far from the surface field). Inbetween, it is striking to observe that the local diffusion coefficient of all solvent molecules vary nearly linearly with the distance R from the silica wall. Accordingly, in the rest of this work, it is assumed that the average mobility of the solvent and analyte molecules in the interfacial region II is 0.5 Dm. so the unknow coefficient d is equal to 0.5. This data was required to measure the equilibrium constant Kd in Equation 14.
Combining chromatographic and MD data to solve the retention mechanism in HILIC
The combination of the chromatographic (k’, εee, εp, and Ω) and MD (fb, fd and δ) data enable the unambiguous determination of the equilibrium constants Kd and Ka. In the next two sections, we are representing the distribution of the analyte molecules in the three pore regions and the relative importance of the adsorption and partitioning mechanism on the overal retention factor of the four analytes used in this work. Five different third eluents are considered in the ternary mobile phase mixture (acetonitrile/water pH 5/third solvent): water, ethanol, tetrahydrofuran, acetonitrile, and n-hexane.
Analyte distribution in the mesopore of HILIC particles
The molar fractions, xa, xd, and xb, of analytes present in the rigid water layer, diffuse water layer, and in the bulk region of the mesopore are given as a function of the previously measured parameters fb, fd, Kd, and Ka. Accordingly, by definition and after some basic algebra:
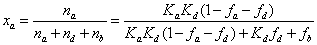 (16)
(16)
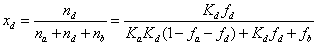 (17)
(17)
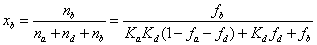 (18)
(18)
Figures 8-12 show these results for water, ethanol, tetrahydrofuran, acetonitrile, and n-hexane as the third solvent in the ternary mobile phase mixture (acetonitrile/water pH 5/ third eluent, 90/5/5, v/v/v). For the sake of reference, the mole fractions of a fully inert analyte uniformly distributed in the whole mesopore volume are 12% (in the rigid water layer), 29% (in the diffuse water layer), and 59% (in the bulk solvent), respectively. Irrespective of the nature of the thrid solvent, it is noteworthy that toluene is not severely excluded from the whole waterrich layer: the sum of xa and xd is nearly constant around 35% instead of 43% for the fully inert adsorption system. Overall, toluene is only slightly excluded from the water-rich layer. It is mostly repelled from the diffuse water layer since the average molar fractions xd are close to 20% versus 29% for the reference inert system. Therefore, toluene is also present at the silica surface where it is weakly adsorbed onto the hydrophobic siloxane bridges. Regarding niacin (partial negative charge, -0.6 at pH 5), it is mostly present in the rigid water layer (from 85% for water to 97% for ethanol), e.g., it is strongly adsorbed onto specific sites such as silanols and/or metal catalyst residuals. Remarkably, niacin is partially excluded from the diffuse water layer: xd varies from 2% for ethanol to no more than 11% for water as the third solvent. The most surprising results are for the two positively charged compound cytosine (+0.3 at pH 5) and nortriptyline (+1): the retention factors of these two compounds are nearly the same, yet, the former analyte accumulates preferentially in the rigid water layer through adsorption (xa varies from 65% for water to 87% for ethanol as the third solvent, 10<xd<20%) while the latter is both dissolved into the diffuse water layer (xd varies from 35% for acetonitrile to 60% for water) and adsorbed (25%<xd<65%) onto the surface of the hybrid organic/ inorganic silica particles. To summarize, it is very difficult to predict a priori the retention mechansim of ionizable compounds in HILIC: it is not general and it depends on the specific affinities of each anlyte for the solid adsorbent surface and a water-rich environment.

Figure 8: Mole fractions of the four compounds present in the mesopore volume of the 140 Å hybrid organic/inorganic silica particles. In blue, red, and green, the amount of sample present in the rigid water layer, in the diffuse water layer, and in the bulk region, respectively. The third solvent is water.

Figure 9: Same as in Figure 8, except the third solvent is ethanol.

Figure 10: Same as in Figure 8, except the third solvent is tetrahydrofuran.

Figure 11: Same as in Figure 8, except the third solvent is acetonitrile.

Figure 12: Same as in Figure 8, except the third solvent is n-hexane.
Effect of the nature of the third solvent on the adsorption and partitionning mechanisms
Figures 13-16 represents quantitative results for the relative importance of the adsorption and partitionning retention mechanisms on the overall retention factor of toluene, cytosine, nortriptyline, and niacin. By definition, the overall retention factor is written:

Figure 13: Contributions of the adsorption (blue color) and partitionning (red color) processes on the intensity of the observed retention factor, k’, of toluene as a function of the nature of the third solvent. The constant height of the green 3D bars represent the expected retention factor (k’=-0.17) if the sample molecules were fully excluded from the water-rich layer. The polarity of the third solvent is decreasing from water to ethanol (EtOH), tetrahydrofuran (THF), acetonitrile (ACN), and to n-hexane (n-Hex).

Figure 14: Same as in Figure 13, except the compound cytosine.

Figure 15: Same as in Figure 13, except the compound nortriptyline.

Figure 16: Same as in Figure 13, except the compound niacin.
It can also be written as the sum of three different terms: two positive terms for the presence of the analyte in the rigid and diffuse water layer and a negative term for its presence in the bulk region of the pore. Accordingly,
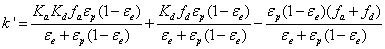
These three contributions to the total experimental retention factor are shown in Figures 13-16 by the vertical blue, red, and green 3D bars, respectively.
Figure 13 reveals that the overall retention factor of toluene is slightly negative (from -0.05 to 0) since it is slightly excluded from the water-rich layer present at the surface of the hybrid organic/inorganic silica particles. The nature of the third solvent has no measurable impact on the distribution of toluene between the rigid and the diffuse water layers. The retention increase of cytosine (Figure 14) from water to acetonitrile used as the third eluent is fully explained from the increasing amount of cytosine in the rigid water layer relatively to its amount in the diffuse water layer. However, the slight increase of retention from acetonitrile to n-hexane used as the third eluent is justified by a relative increase of the importance of the partitioning mechasnim, the adsorption process remaining dominant. The apparent riddle regarding the reversed U-shaped retention behavior of nortriptyline can now be explained unambigously: retention increases from water to tetrahydrofuran as third solvent because the importance of both adsorption over partitioning processes increases. However, from tetrahydrofuran to acetonitrile and to n-hexane, partitionning and adsorption mechanisms become less intense causing a diminution of the overall retention factor of nortriptyline. Finally, the trend observed for niacin in Figure 15 is clear: the retention factor monotoneously increases from water to n-hexane used as the third eluent because the adsorption mechanism is continuously reinforced. Overall, among the three retained ionizable compounds, none has shown a retention behavior strictly identical to the other when decreasing the polarity of third solvent. Yet, a tendency can be seen: the use of a weekly polar third solvent usually generates an increase of the retention because adsorption is reinforced. Consistent with the MD data given in [27], the molar fractions of water in the water-rich layer is continuously increasing when decreasing the polarity of the third solvent: as a result, the transfer of the partially charged analyte from the bulk to the diffuse and to the rigid water layers becomes more favourable.
This work demonstrates that the measurement of the retention factor k’ in liquid chromatography is not sufficient to draw definitive and unambiguous conclusions regarding the retention mechanism of any solid-liquid equilibrium systems. The fundamental explanation for such ambiguity is the non-uniformity of the composition and structure of the eluent mixture across the whole diameter of the mesopores. Solids are never inert to the solvent molecules, so, preferential adsorption occurs for one particular solvent component and the analyte molecules are not homogeneously distributed in the mesopore volume. They are retained because they can be adsorbed at the very surface of the adsorbent (adsorption mechanism) or they can partition between the bulk and the wide diffuse water layer (partitionning mechanism). The existence of this large interfacial layer was revealed in both HILIC [44] and RPLC [45] retention modes. This riddle was illustrated in HILIC with a hybrid organic/inorganic silica adsorbent in contact with a ternary mixture of acetonitrile, water (pH 5, acetate buffer, 200mM), and third solvent (water, ethanol, tetrahydrofuran, acetonitrile, and n-hexane).
It was shown that the relative importance of adsorption and partitionning could be quantitatively determined by combining HPLC (retention factor and column porosities) and MD (microscopic information pertained to the structure and dynamics of the internal eluent mixture) data. Unexpected interpretations were then provided for the overall retention behavior of positively and negatively charged compounds when continuously decreasing the polarity of the third solvent. For instance, two compounds with comparable net charges can have very close retention factors but well different retention mechanisms in terms of adsoprption and partitioning retention mechanism.
The implications of this work go way beyond the case of HILIC separations with unmodified silica surface. It appllies to any HILIC stationary phases such as monomeric and polymeric grafted silica phases. The very same ambiguities apply to the determination of the retention mechanisms in RPLC-C18 or in supercritical fluid chromatography (SFC). They can be alleviated by performing MD with silica-C18 bonded phases in contact with aqueous mixtures of methanol or acetonitrile and with silica-ethylpyridine bonded phases in equilibrium with CO2/ organic modifier eluent mixtures. In RPLC and SFC, it was shown by minor disturbance methods that a preferential adsorption of the organic modifier onto the derivatized silica adsorbents is taking place. Similarly to HILIC, the internal composition and structure of the RPLC and SFC eluents is highy non-uniform across the mesopores. This will necessarily affect the sample distribution in the pores depending on its molecular descriptors (polarity, hydrophobicity, hydrogen-bond donor/acceptor, π-π interactions, etc.).
It is also noteworthy that the combination of HPLC and MD data in RPLC is expected to solve several on-going mysteries in chromatography: for instance, what is hidden from a microscopic viepoint behind the so-called phenomenon of ”surface diffusion” observed in RPLC with neutral apolar (alkybenzene [46]) or weakly polar compounds (alkanophenones [47])? A sound physico-chemical interpretation is still missing and this topic has been recently approached from chromatographic [45] and MD investigations.
This work was supported in part by the cooperative agreement between the University of Tennessee and the Oak Ridge National Laboratory. We thank Prof. Ulrich Tallarek and Dr. Alexandra Höltzel (Philipps-Universität Marburg, Marburg, Germany) for providing us with the relevant MD data. We also thank Martin Gilar (Waters, Milford, MA, USA) for the generous gift of the hybrid organic/inorganic silica HILIC column.