Journal of Chromatography & Separation Techniques
Open Access
ISSN: 2157-7064
ISSN: 2157-7064
Research Article - (2015) Volume 6, Issue 4
Increasing amounts of Pharmaceutical Personal Care Products (PPCPs) have been detected in the water cycle in recent years. Of all the PPCPs, very little information regarding the determination of Antiretroviral Drugs (ARVDs) is available. The aim of this study was to monitor the concentrations of two ARVDs, nevirapine and efavirenz in influent and effluent points at a Wastewater Treatment Works in Gauteng, South Africa. Treated wastewater, before and after chlorination, was also examined to determine if the target ARVDs were removed by chlorination. The target ARVDs were extracted from wastewater using Solid Phase Extraction (SPE) and the extracts were subsequently analysed using Gas Chromatography-Time of Flight Mass Spectrometry (GC-TOFMS).The method (extraction plus instrumental) was validated to determine limits of detection and quantification; accuracy; precision and uncertainties (at 40 ng/L) and all were found to be well within requirements for part per trillion analyses. The robustness of the method was also determined by analysing 10 quality control replicates on three non-consecutive days and found to be fit for purpose. The concentrations of nevirapine and efavirenz in wastewater influent were found to be as high as 2100 and 17400 ng/L respectively. As much as 50% of the ARVDs were removed by the wastewater treatment plant and resulted in treated effluent concentrations of nevirapine and efavirenz as high as 350 and 7100 ng/L respectively. Chlorination was not found to affect the ARVDs significantly. The findings from two other investigations, one in Germany and the other from South Africa, that have investigated ARVDsin surface water and wastewater are compared with those of this study.
Keywords: Antiretroviral drugs; Wastewater; Chlorination; Solid phase extraction; Gas chromatography-time of flight mass spectrometry; Method validation
Pharmaceuticals are synthetic or natural chemicals that can be found in prescription medicines, over-the-counter therapeutic drugs and veterinary drugs [1]. These compounds contain active ingredients that are of benefit to society but can ultimately end up in the water cycle at trace concentrations (nanograms to low micrograms per litre). The occurrence of these PPCPs in the environment has been widely discussed and published in the literature for the last ten years. These compounds could well have been present in the water prior to this time, however, advances in analytical techniques and instrumentation have only allowed for their detection in the last decade. Many surveys have indicated that PPCPs are present in wastewater and effluents and, as such, can be expected to be a source of PPCPs in drinking water. Routine monitoring programmes exist for regulated chemical and microbiological parameters; however, this is not the case for PPCPs. Ad hoc surveys for particular PPCPs have generated data that is available in the literature. Available studies have reported that PPCP concentrations in surface waters, groundwater and partially treated waters are typically less than 100 ng/l and those in treated water are generally less than 50 ng/l [1]. Because domestic wastewater can be expected to be a source of PPCPs in drinking water, the removal of these compounds by wastewater treatment processes is important. Although such processes are not designed to remove PPCPs, they do so to varying degrees [1]. PPCPs removal during wastewater purification is dependent on their physical and chemical properties. Wastewater treatment plants that have biological treatment such as activated sludge processes or bio filtration have been shown to remove PPCPs at varying rates, ranging from less than 20% to in excess of 90%. Efficiencies have been shown to vary depending on the operational configuration of the treatment plant. Such a plant was the subject of this study. Factors influencing removal include sludge age, activated sludge tank temperature and hydraulic retention time. Advanced processes that include reverse osmosis, ozonation and advanced oxidation technologies can result in higher removal of PPCPs [1]. Traditional drinking water treatment processes such as coagulation do not remove many of the PPCPs. Free chlorine can remove approximately 50% of PPCPs, chloramines are less effective [1]. Advanced drinking water purification processes (ozonation, oxidation, activated carbon and membranes) result in removal rates of over 90% of PPCPs [1]. Literature indicates that concentrations of PPCPs in drinking water are usually more than 1000- fold below the minimum therapeutic dose, the lowest clinically active dose [1]. It was estimated that 2500 000 people in South Africa required Antiretroviral Therapy in 2012 [2]. A daily dose of combination therapy of HIV-ARVs (mean of 991 mg/day/person, range 590 - 1996) equates to a total of 542 944 kg of ARVD compounds ingested per year (assuming 1.5 million people are on ARVDs). Excretion of ARVDs varies depending on compound, though some, such as tipranavir are excreted at 80% and nevirapine at 2.7% via urine [3]. Assuming a mean of 30% excretion to sewage via urine and faeces, we estimate that about 162 883 kg of ARVDs could reach the aquatic systems of South Africa every year [3]. The large amounts of ARVDs that are potentially being discharged into the South African wastewater system necessitate that they be monitored. Much work has been carried out on various matrices. For example, HPLC analysis of ARVDs in biological matrices [4]; tenofovirin agricultural soil [5]; tipranavir in human plasma [6]; antiretroviral drugs abacavir and tenofovir in human hair [7]; and nevirapine in plasma [8]. Studies that have been carried out on water samples include the examination of surface and wastewater in Germany [9]. Treated and raw wastewater and rivers were found to contain ARVDs, using Liquid Chromatography-Tandem Mass Spectrometry (LC-MS/MS). Relative recoveries exceeded 80% and limits of quantification ranged between 0.2 and 10 ng L−1. Acyclovir, abacavir, lamivudine, nevirapine oseltamivir, penciclovir, stavudine, zidovudine were all detected. Further work carried out in South Africa [10] the simultaneous quantification of 12 antiretroviral compounds (zalcitabine, tenofovir, abacavir, efavirenz, lamivudine, didanosine, stavudine, zidovudine, nevirapine, indinavir, ritonavir and lopinavir) in surface water using the standard addition method is described. Water samples were concentrated by a generic automated solid phase extraction method and analysed by LC-MS/MS). Substantial matrix effect was encountered in the samples; an average method detection limit of 90.4 ng/L was reported. zalcitabine, tenofovir, abacavir, efavirenz, lamivudine, didanosine, stavudine, zidovudine, nevirapine, indinavir, ritonavir and lopinavir were all detected in the water samples analysed.
In the present study, influents and effluents water samples obtained from a Wastewater Treatment Works were extracted using SPE and ARVDs identified using GC-TOFMS. MS detection systems were used to identify PPCPs as described by [11]. GC-TOFMS has been used for the analysis of organic UV filters and insect repellents in wastewater [12]. Also, two-dimensional GC-TOFMS has been used to determine a number of PPCPs in river water [13]. TOFMS facilitates very rapid spectral scanning and this, along with sophisticated deconvolution software, allows the tentative identification of unknown compounds in the wastewater. Two ARVDs identified in this manner were nevirapine and efavirenz. These compounds are both non-nucleoside reverse transcriptase inhibitors, are soluble in methanol and could be expected to be extracted using SPE techniques. Reports of analysis using GC-MS [8] also indicated that this class of compounds can be analysed using GC-MS without derivatization. Details of the ARVDs [10] investigated and parathion [11] is shown in Table 1.
| Name (CAS No.) | Molecular Mass, g/mol | Structure | Log Kow | pKa Strongest Acid/Base |
|---|---|---|---|---|
| Nevirapine (129618-40-2) | 266.89 | 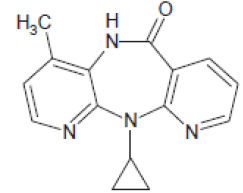 |
3.89 | 10.37/5.06 |
| Efavirenz (154598-52-4) | 315.68 | 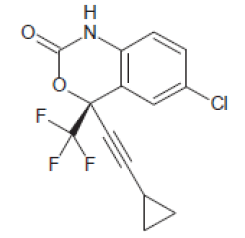 |
4.15 | 12.52/-1.5 |
| Parathion, ISTD (56-38-2) | 291.26 | 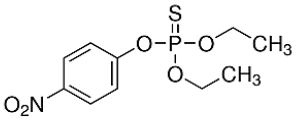 |
3.81 | 7.14 |
Table 1: Nevirapine, efavirenz and ISTD (parathion) CAS numbers, molecular masses, structures, Log Kow and pKa values.
Sample collection
Sewage samples were collected from the Wastewater Treatment Works in Gauteng, South Africa. The samples that were collected were the influent to the works, the purified sewage effluent prior to chlorination and lastly, the chlorinated effluent discharged from the Works. Samples were taken in 1 litre clear Schott bottles and were stored at 4°C and analysed within 24 h of receipt.
Materials
All organic solvents, including reagent water, were manufactured by Honeywell Burdick and Jackson (USA) and of HPLC grade. Phosphoric acid was purchased from Merck SA, univ AR. SPE extraction cartridges used were Agela Cleanert PEP 60 mg 3 ml; the SPE drying cartridges used were Bond Elute Sodium Sulphate cartridges. Sample extracts were concentrated using a Techne dry block, DB 3 (nitrogen 99.999% purity). Analytical standards of nevirapine and efavirenz were supplied by USP, USA.
Methods
Extraction: Use was made of a manual SPE apparatus (Agilent, 20 position manifolds), SPE extraction cartridges were conditioned sequentially with one column volume of dichloromethane, ethyl acetate, methanol and de-ionized water containing 0.1% phosphoric acid (v/v). Samples (1 litre), calibration standards and the method blank were eluted through the cartridges at a flow rate not exceeding 10 ml/min (individual drops just visible). Once the sample had eluted through the cartridge, they were allowed to dry under vacuum for about 10 min. Bond Elute sodium sulphate SPE cartridges were washed (1 column volume of dichloromethane and 1 column volume of ethyl acetate) and placed below the extraction SPE cartridges to remove any water during the desorption step. Adsorbed compounds were desorbed from the cartridges by passing 500 μl of ethyl acetate (2x) and 600 μl dichloromethane through the cartridges under a gentle vacuum. The solvents were allowed to soak the SPE cartridges for 60 sec to enhance desorption. The solvents were pooled in a GC vial down blown with nitrogen (manifold temperature of 40°C) to about 150 μl and then made up to 200 μl with ethyl acetate. The extract was analysed using GCTOFMS. The use of matrix spiked calibration standards precluded the need for analyte recoveries to be determined as these were automatically accounted for when quantifying using these calibration standards.
Instrument parameters: Helium carrier gas used for the GC-TOFMS was supplied by Air Liquide and was 99.9999% pure. The GC inlet liner used was an SGE tapered focussing liner and the GC capillary column was a Phenomenex Zebron ZB-Semivolatiles GUARDIAN column (5m guard column, 30 m x 0.25 mm x 0.25 μm). The analytical instrumentation used was an Agilent 7890A GC (incorporating a Gerstel MPS 2 liquid auto sampler) coupled to a LECO Pegasus® HT TOF. LECO ChromaTOF® software version 4.24 was used for the identification of target compounds and for the quantificationof Nevirapine and efavirenz.The injection volume was 3 μl, pulsed splitless (2 min @ 50 psi) injection mode at 275°C with a purge delay of 0.5 min. The column flow was 1.2 ml/min, constant flow. The GC initial oven temperature was held at 80°C for 1 min. The temperature was then ramped to 320°C at 12.5°C/min. The transfer line between the GC and the TOFMS was maintained at 280°C. The TOFMS analysis was performed in the electron impact mode at 20 scans/sec and at a source temperature of 250°C. Detector voltage was boosted by 250 volts to maximize instrument sensitivity. LECO ChromaTOF® software version 4.24 was used to integrate and identify the target compounds in the wastewater extracts. The data processing method used for integration of the compounds incorporated a baseline offset of 0.5; auto smoothing; peak broadening calculated as the run progressed; and a signal/noise ratio of 5. The library searching was limited to forward searching of compounds of 1000 a.m.u. and less and the minimum mass spectral similarity match was set to 300. Such a low match factor was necessary to detect trace contaminants in the complex wastewater matrix. Resultant false positive matches were manually excluded from the results.
Nevirapine and Efavirenz quantification: The stock standard was diluted in ethyl acetate to give a working standard concentration of 1 ng/μl. This working standard was used to prepare the spiked matrix matched calibration standards. 20; 40; 60; 80; 100; and 200 μl were added to 1 litre of water deionized to prepare 20; 40; 60; 80; 100; and 200 ng/L solutions that were extracted in the same manner as the method blank and samples. These are then used to prepare the calibration curves. An Internal Standard (ISTD), parathion, was added to all calibration standards and samples (60 μl of a 1 ng/μl stock solution made up in ethyl acetate). ISTD was added before extraction to determine performance of the sample prep method. Quality control samples, waters spiked with ISTD and ARVD target compounds to 40 ng/L, were extracted and analysed with every batch of samples analysed. These quality control samples were analysed after the calibration standards and again at the end of the run sequence, or after 10 samples. Three sets of samples were analysed, the last of these sets were run using ten replicates for each of the influent; the pre- and post-chlorinated effluents and spiked quality control samples (on three non-consecutive days) to determine method robustness, uncertainties and method detection and quantitation limits of nevirapine and efavirenz. Wastewater influents and effluents samples were diluted with deionised water to ensure that they fell within the calibration range.
Statistical calculations: Random uncertainties of the calibration curves of nevirapine and efavirenz were used to calculate method Limits of Detection and Quantification (LODs and LOQs) as shown below,
• In the absence of meaningful blanks, the LOD was determined using the slope and regression uncertainties (as determined by Regression Analysis), XLOD=3Sb/b. Sb is the Slope Uncertainty and b is the slope, the Slope and the Random Uncertainties are generally assumed to be equivalent and the Slope Uncertainty has been used in these calculations.
• `In the absence of meaningful blanks, the LOQ was determined using the slope and regression uncertainties (as determined by Regression Analysis), XLOQ=10Sb/b. Sb is the Slope Uncertainty and b is the slope, the Slope and the Random Uncertainties are generally assumed to be equivalent and the Slope Uncertainty has been used in these calculations.
Method precision, accuracy and uncertainties (95% confidence) were calculated from the results obtained from 10 quality control samples extracted and analysed on the same day and were determined as follows.
• Precision was calculated using % RSD = (mean of SDEV of QCs/mean of QCs) x100.
• Accuracy was determined as follows, % Accuracy = (mean value/true value).
• Uncertainties were determined at 95% levels of confidence. Included in the Uncertainty Budget are the contributions made by the uncertainties of % standard purity; uncertainties of volume; uncertainty of mass; uncertainty of regression; and uncertainty of repeatability.
The robustness for this method was determined by comparing the results for quality control samples over 3 non-consecutive days. The statistical tool used in this case was the F-Test (at the 95% confidence level), which examines whether the standard deviation of two sets of data are similar or dissimilar from each other.
• No. of Replicates – minimum 8
• No. of sets of data – 3
The Fcalc was calculated as follows for each compound:
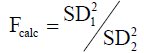
Where SD 2 > SD 1
Fcrit = 3.18 with (9x, 9y)
Where: x = degrees of freedom for SD2
y = degrees of freedom for SD1
9 = degrees of freedom (number of replicates)
The determination of nevirapine and efavirenz in wastewater and treated wastewater samples is robust. Method statistics are shown in Table 2; calibration curves for nevirapine and efavirenz are shown in Figure 1 and Figure 2. Regression statistics of the calibration data yield excellent r2 values and linearity (F factors of 57334 and 3027 for nevirapine and efavirenz respectively). Low random uncertainties for both curves resulted in low LODs and LOQs. Method precision, accuracy and uncertainties (95% confidence) were calculated from the results obtained from 10 quality control samples extracted and analysed on the same day and were found to be acceptable for parts per trillion analytical determinations [14]. The method was deemed robust and fit for purpose [15].
| Parameter | Nevirapine | Efavirenz |
|---|---|---|
| LOD, ng/L | 1.8 | 7.8 |
| LOQ, ng/L | 6.0 | 25.9 |
| Precision, % | 10.2% | 3.5% |
| Accuracy, % | 106% | 109% |
| Uncertainty, ng/L | 1.6 | 6.4 |
Table 2: Method statistics.

Figure 1: Nevirapine calibration curve, ISTD corrected.

Figure 2: Efavirenz calibration curve, ISTD corrected.
GC-TOFMS has been compared to quadrupole GC-MS using synthetic drug standards [16]. Lower LODs were evident with GC-TOFMS and were comparable to GC-ECD, with the added advantage of high quality full scan mass spectra. Peak deconvolution in the ChromaTOF® software has been shown to be poor with higher concentrations of sample extracts and this tends to lead to compromised chromatography [17]. Wastewater influents were diluted 100 times and the effluents 50 times respectively with deionised water for the observed concentrations to be within the calibration range. A further advantage of the dilution of the samples is that the chromatographic integrity of the system was less compromised and greater numbers of samples could be analysed before instrument maintenance was required.
A typical reconstructed ion chromatogram, showing ions characteristic of the compounds investigated, is shown in Figure 3. Although all ions were detected all the time, however, only selected ions (reconstructed ion chromatogram) are displayed for clarity (Figure 3). As can be seen, both nevirapine and efavirenz chromatograph well. Peak shapes are good (no tailing is evident) unless the column is overloaded. In the calibration range used in this work (20 to 200 ng/l) no overloading of the capillary column was observed. Retention times were not excessive (<1000 seconds) and were in the same region of the chromatogram as the ISTD, Figure 3 below. The mass spectra are shown in Figures 4a and 4b (nevirapine) and Figures 5a and 5b (efavirenz). For clarity mass spectra from both matrix spiked calibration samples and an analytical standard are included. Mass spectra for both nevirapine and efavirenz included ions of >200 a.m.u. of high abundances and facilitated accurate deconvolution and quantification. The mass spectra for the matrix spike and the analytical standard agreed well, ions characteristic of hydrocarbons (57, 71, 85, and 99 a.m.u. are indicative of alkanes) are additional in the in the matrix spike and were expected. The ions used for quantification of for efavirenz and nevirapine were 246 and 265 a.m.u. respectively, the ion used for the ISTD was 291 a.m.u. The nevirapine and efavirenz concentrations that were detected in the samples are shown in Figure 6. As can be seen in Figure 6, the concentrations of nevirapine and efavirenz vary from one sampling event to another. The concentrations of nevirapine and efavirenz in wastewater influent were found to be as high as 2100 and 17400 ng/L respectively. As much as 50% of the ARVDs were removed by the Wastewater Treatment Works and resulted in treated effluent concentrations of nevirapine and efavirenz as high as 350 and 7100 ng/L respectively. Also, the amounts removed by the Wastewater Treatment Works varied, and this is most likely related to both the nature of influent and the operation of the works. What is consistent is that the Wastewater Treatment Works does remove both compounds to some degree. This is in agreement with findings described earlier [1]. The effect of the chlorination of the treated wastewater on ARVDs concentrations was inconclusive.

Figure 3: Reconstructed ion chromatogram showing the ISTD (light blue peak), nevirapine (green peak) and efavirenz (dark blue peak).

Figure 4a: Nevirapine mass spectrum, matrix spike 40 ng/L.

Figure 4b: Nevirapine mass spectrum, 1ng/μl analytical standard.

Figure 5a: Efavirenz mass spectrum, matrix spike 40 ng/L.

Figure 5b: Efavirenz mass spectrum, 1ng/μl analytical standard.

Figure 6: Influent and effluent nevirapine and efavirenz concentrations.
Although efavirenz was detected at various surface water sampling points in South Africa in the study by Wood et al [10], concentrations were too low for quantification. Nevirapine was detected in all of the samples in this study but was only quantitated in 9 of the 24 sampling stations; the highest reported concentration was 1480 ng/L. Nevirapine is widely used for the treatment of HIV and for the prevention of mother-to-child transmission and its environmental persistence [18] make it likely to be found in the environment. Work carried out in Germany [9] indicated that nevirapine and was not removed by a wastewater treatment works whilst other ARVDs were removed. Both of these studies used LC-MS/MS to determine the ARVDs.
It has been shown that GC-TOFMS can be used to determine nevirapine and efavirenz in wastewater samples. The technique is reliable and robust and is a viable alternative to an LC-MS/MS. Further studies will be necessary to determine which of the processes in the wastewater treatment works were most effective for the removal of nevirapine and efavirenz from wastewater. To better evaluate the passage of these compounds though a wastewater treatment works the use of passive samplers would be advisable.
Rand Water Scientific Services for the provision of the technical environment and the Tshwane University of Technology for support.