Journal of Chromatography & Separation Techniques
Open Access
ISSN: 2157-7064
ISSN: 2157-7064
Research Article - (2017) Volume 8, Issue 6
Cystatins are thiol proteinase inhibitors ubiquitously present in many plants as well as animal tissues. In the present study, a cystatin like a thiol proteinase inhibitor was isolated from chickpea using ammonium sulfate fractionation (40-60%) and gel filtration chromatography on a Sephacryl S-100 HR column with 21.09% yield and fold purification of 78.89. It gave a molecular mass of about 25.3 kDa as determined by SDS-PAGE, Dynamic Light Scattering (DLS), and from its gel filtration behavior. The inhibitor was found to have very low carbohydrate content (0.34%) and meager amount (1.45%) of sulfhydryl content. The Stokes radius, frictional, diffusion and sedimentation coefficients of CPC were 4.299 × 10⁻⁸ g/s, 22.82 Å, 12.68 × 10⁻⁷ cm2 s-1 and 2.64 S, respectively. Kinetic analysis of CPC with thiol proteinases (papain, ficin, bromelain) revealed the reversible and competitive mode of inhibition with CPC showing the highest inhibitory efficiency against papain (Ki=0.82 nM) followed by ficin (Ki=17.6 nM) and then bromelain (Ki=41.3 nM). CPC possessed about 25.34% α-helical content as assessed by CD spectroscopy. UV-Visible and fluorescence spectra indicated that upon formation of papain-CPC complex there is a significant conformational change in one or both the proteins of the complex.
Keywords: Chickpea cystatin; Thiol proteinase inhibitor; Chromatography; Kinetics; CD spectroscopy
Endogenous proteinase inhibitors are protein molecules that specifically inhibit proteinases. They are usually non-competitive inhibitors of proteinases [1]. Plant proteinase inhibitors are usually small proteins having a molecular mass below 50 kDa. However, dimeric and tetrameric inhibitors have been isolated from potato and tomato [2,3]. They have been isolated from leguminaceae, solanacaea and graminacaea families [4]. These inhibitors are highly specific in nature. Cells possess these inhibitors to check the enormous hydrolytic potential of proteolytic enzymes that are otherwise essential for the survival of organisms [5]. The major proteases of the lysosomal pathway of protein degradation, cathepsins, are naturally regulated by cysteine proteinase inhibitors.
Natural inhibitors of cysteine proteinases include the members of cystatin superfamily comprising of stefins, cystatins, and kininogens [6,7]. Kondo et al. [8] proposed, on the basis of sequence comparison of oryzacystatins I and II with animal cystatins, that plant cystatins should be classified into a fourth cystatin family ‘phytocystatins’. Cystatins constitute a powerful regulatory system for endogenous cysteine proteinases, which may otherwise cause uncontrolled proteolysis and tissue damage. They form potent, reversible, non-covalent competitive inhibitors of cysteine proteinases of the papain superfamily [9,10]. It has been shown that members of this superfamily interact directly with the active site cleft of papain at three regions of the mature cystatin. These are an N-terminal region with a conserved glycine residue, a central loop containing the highly conserved Q-X-V-X-G motif and a C-terminal region with a conserved tryptophan residue [11]. The plant cystatins or phytocystatins are further identified by the consensus sequence (LVI)-(AGT)-(RKE)-(FY)-(AS)-(VI)-X-(EDQV)- (HYFQ)-N found within a predicted amino-terminal α-helix [12]. The unique properties and a wide range of physiological functions of thiol proteinase inhibitors are remarkable and demand attention.
Phytocystatins or plant Cystatins, the 4th family of this inhibitor superfamily, plant homologs of animal cysteine proteinase inhibitors [13]. They have been identified in both monocotyledonous [8,14,15] and dicotyledonous [16,17] plants. They are particularly well characterized in crops such as rice [8,14], maize [15] and soybean [16,17]. The unique feature of phytocystatin family is a highly conserved G-58 residue in the QVVAG motif (102-106) and the PW motif (132-133) [18]. Cystatin has been successfully isolated in the plants as Rice [8,19,20], soybean [21,22], sugarcane [23], Maize [24] and Kiwi fruit [25]. Phytocystatins have also been isolated from plants such as cowpea, potato, and carrot [26-28].
Thiol proteases present in the plant system perform a variety of functions, and their regulation is performed by phytocystatins. They are important in a variety of ways, including their role in storage proteins [29], as regulators of endogenous proteolytic activity [30] and as participants in the mechanism of programmed plant cell death [31]. Apoptosis has been implicated in several plant processes such as xylogenesis, some forms of senescence and in the pathogens attack response [32]. Furthermore, proteinase inhibitors are expressed in abiotic stress [33] and in plant defense processes against insect attacks [34]. Phytocystatins present in cereal seeds like rice and maize have been used to prevent certain types of cancer [35]. Thus, Cysteine Protease Inhibitors (CPIs) have been known to be present in a variety of seeds of plants, and have been intensively studied as useful tools for potential utilization in pharmacology and agriculture.
In continuation of the study of phytocystatins, the present communication describes the isolation, purification and detailed characterization of cystatin-like thiol proteinase inhibitor from a new plant source chickpea (Cicer arietinum) an important legume of the family Fabaceae. Its ease of availability and high protein content make it a favourable source. The study reports the detailed characterization of chickpea cystatin (CPC) given in terms of physicochemical properties, secondary and tertiary structure analysis, kinetic parameters with various proteases, and immunological properties, using a battery of biophysical and biochemical techniques.
Materials
Chickpea seeds were purchased from the local market and were used throughout the present work for the purification process. Enzymes, substrates, Sephacryl S-100 HR, anti-rabbit alkaline phosphatase (conjugate) and p-nitrophenyl phosphate were obtained from Sigma (St. Louis, MO, USA). Casein, Ethylene Diamine Tetra Acetate (EDTA), Tri Carboxylic Acid (TCA), L-cysteine, and electrophoresis reagents were purchased from SRL (Mumbai, India). Medium molecular weight markers, Freund’s complete and incomplete adjuvants were from Genei, India Limited. All other chemicals used were of highest purity grade available commercially.
Methods
Purification of chickpea cystatin (CPC): The purification of cystatin was done by the method as reported earlier by our group [36]. 100 gm of chickpea, overnight soaked, was homogenized in homogenization buffer (50 mM sodium phosphate, 3 mM EDTA, 0.15M NaCl, pH 7.5) in a homogenizer. The crude extract was centrifuged at 5000 rpm for 20 minutes (4°C) in a Sigma cooling centrifuge. The supernatant was collected and subjected to 40-60% ammonium sulphate saturation. The precipitate was then collected by centrifugation at 10000 rpm for 30 minutes (4°C) and dissolved in minimum amount of buffer (50 mM sodium phosphate, pH 7.5) and dialyzed against the same buffer containing 0.15 M NaCl to remove ammonium sulphate. A column of Sephacryl S-100 HR was prepared at room temperature (25°C). The dialyzed sample was subjected to gel filtration chromatography on this column (70 × 1.8 cm), equilibrated with sodium-phosphate buffer (50 mM, pH 7.5). The flow rate of the column was 15 ml h-1. A single protein peak with papain inhibitory activity was obtained which was named as chickpea cystatin (CPC).
Protein estimation: Protein concentration was determined by Lowry’s method [37] using bovine serum albumin (BSA) as standard. The absorbance was read at 660 nm.
Assay of thiol proteinase inhibitory activity: The inhibitory activity of CPC was assessed by its ability to inhibit the caseinolytic activity of papain towards casein by the method of Kunitz [38]. Apart from this, inhibitory effects of CPC on proteolytic activity of ficin, bromelain, trypsin, and chymotrypsin were also measured using casein as substrate.
Electrophoresis: To check the purity and homogeneity of the purified preparations, native PAGE, and SDS-PAGE in the presence and absence of β-mercaptoethanol was performed by the method of Laemmli [39]. 7.5% gel for native electrophoresis and 12.5% gel for SDS-PAGE were run. The gels were stained and visualised by Coomassie brilliant blue R-250.
Molecular mass determination: The molecular weight of CPC under native conditions was determined by passing various marker proteins along with the inhibitor on Sephacryl S-100 HR column. The molecular mass of the inhibitor was authenticated and determined by running marker proteins along with the inhibitor on SDS-PAGE. Additionally, DLS was also performed to estimate the molecular mass of the purified inhibitor.
Thiol group estimation: For the determination of thiol groups of CPC, the procedure given by Ellman [40] was employed, using DTNB (5,5'-dithiobis-2-nitrobenzoic acid) reagent, and molar extinction coefficient of 13,600 M-1 cm-1. Cysteine was used as a standard.
Carbohydrate estimation: The carbohydrate content of purified inhibitor was analyzed by the method of Dubois and co-workers using glucose as standard [41].
pH stability: Fifty microgram aliquots of the inhibitor were incubated with buffers of different pH values like 50 mM Tris-glycine buffer (pH 3.0 and 4.0), 50 mM sodium acetate buffer (pH 5.0 and 6.0), 50 mM sodium phosphate buffer (pH 7.0 and 8.0), and Tris-HCl buffer (pH 9.0 and 10.0) for 30 min at 37°C. These differentially pH incubated inhibitor samples were used for determination of remaining % inhibitory activity as described in the section of the assay of proteinase inhibitory activity.
Thermal stability: (a) Aliquots (50 μg) of inhibitor in 50 mM sodium phosphate buffer (pH 7.5) were incubated at various temperatures (30- 90°C) for 30 min. These samples were rapidly cooled in ice cold water bath and checked for residual activity against 50 μg of papain.
(b) Fifty micrograms of the inhibitor at 90°C were incubated for different time intervals (30-130 minutes), rapidly cooled, and residual inhibitory activity measured against papain.
Hydrodynamic parameters of the purified inhibitor
Stokes radius (Rs): was determined by the method of Andrews [42] and Laurent and Killander [43] using Sephacryl S-100 HR column (70 × 1.8 cm) calibrated with proteins of known stokes radii.
Frictional coefficient (f): was determined using Rs by the following equation.
f=6 πηRs
Where η is the coefficient of viscosity of the medium (0.01 g/cm-sec for water and dilute aqueous salt solutions at 20°C), Rs is stokes radius, and π is a mathematical constant approximately equal to 3.14.
Diffusion coefficient: D was calculated using the given equation
where k=1.38 × 10⁻¹⁶ cm2 g K-1 s-2 is Boltzmann’s constant, and T is the absolute temperature (303 K).
Sedimentation coefficient: (S) The sedimentation coefficient of a protein is a measure of how fast it moves through the gradient and is given by the Svedberg formula,
where M is the mass of the protein molecule in Da (25298 Da), No is the Avogadro’s number, 6.023 × 10²³, v2 is the partial specific volume of the protein (0.73 cm3/g), and ρ is the density of the solvent (1.0 g/ cm3 for water).
Kinetics of inhibition
The stoichiometry of proteinase inhibition and specificity: Papain was used for the titration of CPC. The inhibitory activity of the inhibitor was assessed by its ability to inhibit the caseinolytic activity of papain by the method of Kunitz [38]. The concentration of inhibitor was varied from 0.01-0.12 μM whereas the papain concentration was fixed at 0.06 μM. Identical experiments were carried out for CPC with other thiol proteinases, ficin and bromelain using casein as substrate [38,44].
The inhibitory activity of CPC towards thiol proteinases, papain, ficin and bromelain and serine proteinases, trypsin and chymotrypsin were also examined, using casein as substrate.
Inhibition constant (Ki) determination: Ki determinations were carried out by lowering the enzymes and inhibitor concentrations to obtain a non-linearity of dose-response curves. Papain, ficin and bromelain were used at a concentration of 0.06 μM to react with inhibitor in varying concentrations from 0.06 to 0.24 μM. Residual activity was measured by the method of Kunitz [38] using casein as a substrate. Four different substrate concentrations were used 0.5 Km, 1 Km, 1.5 Km and 3 Km and with Km=2.4 mM. The results were analyzed by the procedure of Krupka and Laidler [45]. The linear equation given by Henderson [46], is presented as follows:
Where, [I]o, [E]o and [S]o are the initial concentrations of Inhibitor, Enzyme, and Substrate, respectively. Vo is the velocity in absence of inhibitor and Vi is the velocity in presence of inhibitor. The plot of [I]o / 1- (Vi /Vo) against Vo /Vi is a straight line, the slope of which gives:
Ki (app)=Ki [1+[S]o /Km]
True Ki was obtained from a replot of Ki (app) against [S]o.
Determination of dissociation rate constant (K-1): For the dissociation rate constant, the conditions for the maximal association between proteinase and inhibitor were achieved before the reaction was shifted towards dissociation by adding excess substrate (6% casein) which binds the entire free enzyme. Dissociation of EI complex obeys first order kinetics. Thus, integrated form of the dissociation rate equation is given by:
ln ([EI]/[EI]o)=K-1 t
The half-life of the complex: The half-life values of enzymeinhibitor complexes were calculated using K-1 values by the equation:
Determination of association rate constant (K+1): Using the values of dissociation constant and inhibition constant derived as explained above, association rate constant, K+1 was determined using the relation as given by Abrahamson et al. [47]:
IC50 value: IC50 value was calculated as per the following Cheng-Prusoff equation [48].
where Ki is the binding affinity of the inhibitor, IC50 is the functional strength of the inhibitor, [S] is fixed substrate concentration and Km is the concentration of substrate at which enzyme activity is at half maximal
Spectral analysis
Absorption difference spectra: Ultraviolet-Visible (UV-Vis) absorption difference spectra were measured for CPC (2.3 μM) along with activated papain with a molar ratio of 1:1 at 25°C. Spectra was recorded by measuring the absorption between 190-300 nm on UV-Vis spectrophotometer (Shimadzu 5301) in a cuvette of 1 cm path length. Appropriate controls of the solvent buffer were run, and corrections were made wherever necessary.
Fluorescence spectroscopy: Fluorescence measurements for papain, CPC, and CPC-papain complex were performed on Shimadzu spectrofluorimeter model RF-540 equipped with data recorder DR- 3. The excitation wavelength was 280 nm and the slits were set at 5 nm for excitation as well as emission beams. The path length was 1 cm and the emission wavelength range were 300-400 nm. The protein concentration used in the fluorescence measurements was 2.3 μM. Each spectrum was the average of at least three scans. Appropriate controls were run, and corrections made wherever necessary.
Circular Dichroism (CD) spectroscopy: Circular dichroism measurements were carried out on a Jasco Spectropolarimeter model J-720 using a SEKONIC–XY plotter (model SPL-430 A) with thermostatically controlled cell holder attached to a NESLAB water bath model RTE 110 with an accuracy of ± 0.10°C. The instrument was calibrated with d-10-Camphorsulphonic acid. The concentration of inhibitor for far UV-CD analysis was 4 μM. The path length used was 0.1 cm. The spectra were recorded with a scan speed of 20 nm min-1, and with a response time of 4 s. Each spectrum was recorded as an average of 5 scans. The emission wavelength range was 200-250 nm. The secondary structure was calculated using the following equation as described by Chen et al. [49].
% helix=[(MRE222 – 2340)/ 30300] × 100
Where MRE (Mean residue ellipticity) in deg.cm2.d mol-1 is defined as:
MRE=θobs / (10 × n × l × Cp)
Where θobs is the CD in milli degree, n is the number amino acid residues, l is the path length of the cell, and Cp is the mole fraction.
Immunological properties
Production of antiserum: Antibodies against CPC were raised by injecting 300 μg of purified inhibitor in Freund's complete adjuvant subcutaneously into healthy male albino rabbits. The injection containing CPC in Freund's incomplete adjuvant was repeated every week, and the rabbit was bled every second week. The blood collected was allowed to coagulate at 22°C for 3 h. The antisera were decomplimented at 57°C for 30 min and stored at -20°C in small aliquots.
Immunodiffusion: Immunodiffusion was performed by the method of Ouchterlony [50]. 1% agarose in normal saline containing 0.2% sodium azide was poured on a glass plate and allowed to solidify at room temperature. Required number of wells was cut. 15 μL of suitably diluted antiserum and required amount of antigen (60 μg) were added in different wells. The reaction was allowed to proceed for 12-24 hrs in a moist chamber at RT (room temperature). Cross reactivity was also checked by the same technique using almond cystatin and buffalo heart cystatin purified in our laboratory.
Direct binding ELISA: The generation of antigen specific antibody was measured in the sera of CPC immunized rabbits by the technique of direct binding ELISA (enzyme linked immunosorbent assay) as given by Voller et al. [51]. Ninety-six wells of micro-titre plate (immulon 2 HB, Dynex, USA) were coated overnight with 100 μL of antigen at 4°C. The plate was washed thrice with TBS-T buffer (Tris buffered saline Tween 20, pH 7.4, 20 mM Tris, 14.3 mM sodium chloride, 200 mg potassium chloride and 5 mL Tween 20 dissolved in 1 L of distilled water and pH adjusted to 7.4 with 1 N HCl). The unoccupied sites were saturated by incubation with 100 μL of 1.5% BSA in TBS (Tris buffered saline, pH 7.4, 20 mM Tris, 150 mM sodium chloride) for 5-6 hrs at RT (room temperature). Plates were washed twice with TBS-T. The test and control wells were then loaded with 100 μL of serially diluted serum. The plate was incubated for 2 hrs at RT and then overnight at 4°C. 100 μL of an appropriate conjugate of anti-rabbit alkaline phosphatase (1:3000) was coated in each well and kept for 2 hrs at RT. After regular washing with TBS-T and distilled water, the substrate p-nitro phenyl phosphate (5 μg/100 mL of 50 mM bicarbonate buffer, pH 9.5, containing 0.02% sodium azide) was added to each well and incubated for 30-45 min. The reaction was stopped by addition of 100 μL of 3 M NaOH in each well. The absorbance of each well was monitored at 405 nm on ELISA reader (Qualigens).
Purification of the inhibitor
In the present work, chickpea cystatin (CPC) has been purified from chickpea seeds by the method used by Sharma et al. [52] and modified by Bhat et al. [36]. As detailed in the methods section, the procedure involved two steps after homogenisation, i.e., ammonium sulphate precipitation (40-60%) and gel filtration chromatography on Sephacryl S-100 HR column. Ammonium sulphate fractionation resulted in 2.23-fold purification with a yield of 38.1%. The progress of present purification scheme is summarized in Table 1.
| Step | Volume (ml) | Total Protein (mg)a | Total Activity (units)b | Specific Activity (units/mg protein) |
Fold Purification | Percent Yield |
|---|---|---|---|---|---|---|
| Crude Extract | 200 | 5,463 | 147 | 0.027 | 1 | 100 |
| Ammonium Sulphate Fractionation (40-60%) |
18 | 864 | 56 | 0.06 | 2.23 | 38.1 |
| Sephacryl S-100 HR Chromatography |
15 | 15.56 | 31 | 2.13 | 78.89 | 21.09 |
aProtein concentration was determined by the method of Lowry et al.; bOne unit of enzyme inhibitory activity is defined as the amount of inhibitor bringing about 0.001 change in O.D/mL/min
Table 1: Purification results of chickpea cystatin (CPC).
The protein precipitate obtained after ammonium sulphate fractionation was dissolved in minimum amount of 50 mM sodium phosphate buffer (pH 7.5) and was dialyzed against several changes of the same buffer (containing 0.15 M NaCl). The dialyzed protein was filtered on Whatman paper (Grade 41, retention: 10 μm) and chromatographed on Sephacryl S-100 HR column (70 × 1.8 cm) equilibrated with 50 mM sodium phosphate buffer, pH 7.5. A single peak giving significant papain inhibition was obtained and named as chickpea cystatin (CPC) (Figure 1). The fractions corresponding to this peak were pooled and used for further analyses. The procedure provided a fold purification of 78.89 and percent yield of 21.09 (Table 1). The stages of purification are also depicted physically by PAGE image (Figure 2a).
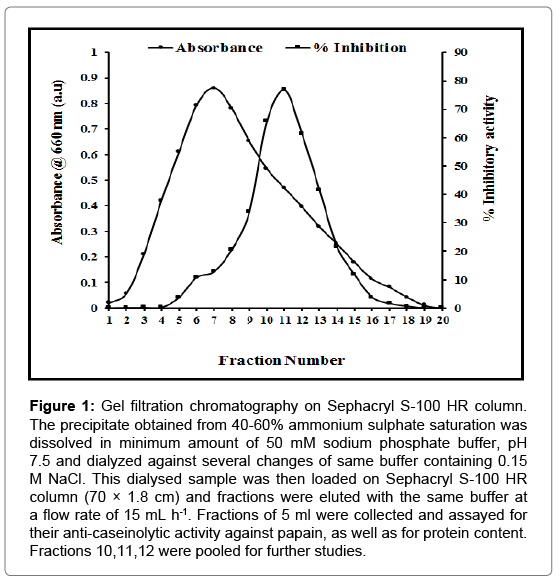
Figure 1: Gel filtration chromatography on Sephacryl S-100 HR column. The precipitate obtained from 40-60% ammonium sulphate saturation was dissolved in minimum amount of 50 mM sodium phosphate buffer, pH 7.5 and dialyzed against several changes of same buffer containing 0.15 M NaCl. This dialysed sample was then loaded on Sephacryl S-100 HR column (70 × 1.8 cm) and fractions were eluted with the same buffer at a flow rate of 15 mL h-1. Fractions of 5 ml were collected and assayed for their anti-caseinolytic activity against papain, as well as for protein content. Fractions 10,11,12 were pooled for further studies.
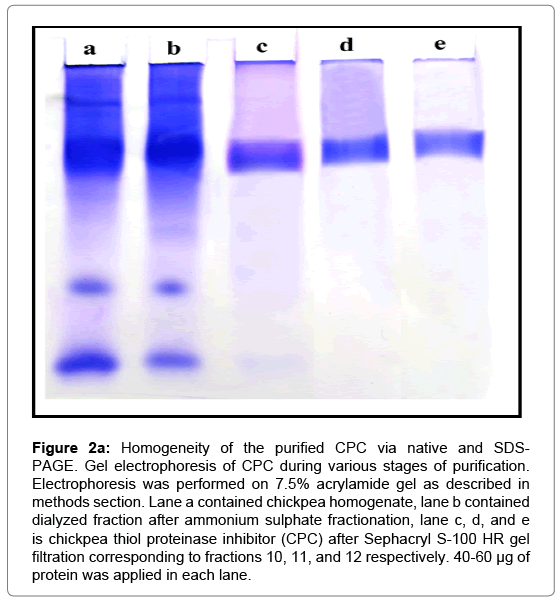
Figure 2a: Homogeneity of the purified CPC via native and SDSPAGE. Gel electrophoresis of CPC during various stages of purification. Electrophoresis was performed on 7.5% acrylamide gel as described in methods section. Lane a contained chickpea homogenate, lane b contained dialyzed fraction after ammonium sulphate fractionation, lane c, d, and e is chickpea thiol proteinase inhibitor (CPC) after Sephacryl S-100 HR gel filtration corresponding to fractions 10, 11, and 12 respectively. 40-60 μg of protein was applied in each lane.
Homogeneity of the purified CPC
As observed in Figure 1, the inhibitor eluted as a single symmetric peak with constant specific activity suggesting a homogenous preparation. In addition, the preparation did not inhibit serine proteinase, trypsin or chymotrypsin. Physical evidence for homogeneity was further provided by gel electrophoresis under non-denaturing conditions. The electrophoretic pattern of CPC is shown in Figure 2a, lanes c, d, e. The inhibitor moved as a single band.
In SDS-PAGE, CPC migrated as a single band under both reducing (in presence of β-mercaptoethanol) as well as non-reducing conditions suggesting the monomeric nature of the protein (Figure 2b).
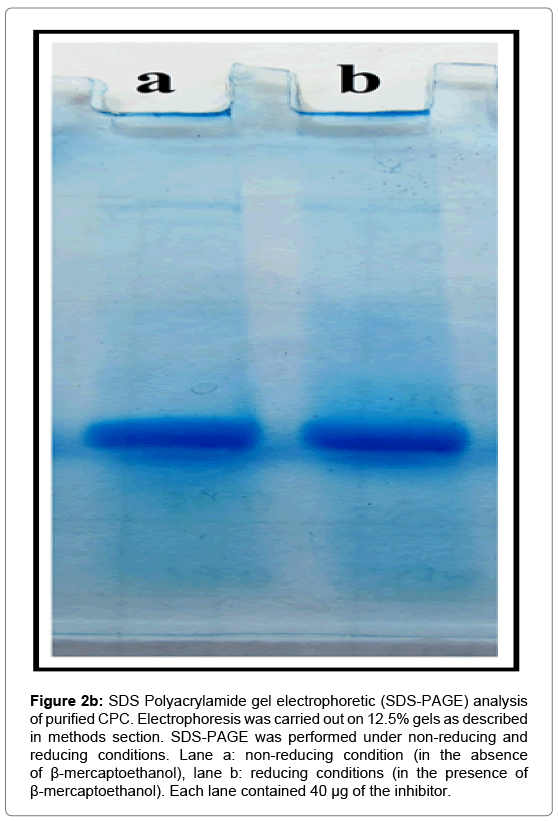
Figure 2b: SDS Polyacrylamide gel electrophoretic (SDS-PAGE) analysis of purified CPC. Electrophoresis was carried out on 12.5% gels as described in methods section. SDS-PAGE was performed under non-reducing and reducing conditions. Lane a: non-reducing condition (in the absence of β-mercaptoethanol), lane b: reducing conditions (in the presence of β-mercaptoethanol). Each lane contained 40 μg of the inhibitor.
Molecular Weight (MW) determination
The molecular weight of chickpea thiol proteinase inhibitor was determined under native as well as denaturing conditions. The molecular weight of native CPC was determined using gel filtration chromatography on Sephacryl S-100 HR column. The marker proteins- Lysozyme (14.3 kDa), Trypsin (23 kDa), Chymotrypsin (25 kDa), Ovalbumin (45 kDa) and BSA (66.5 kDa) were chromatographed on the Sephacryl S-100 HR column (70 × 1.8 cm) equilibrated with 50 mM sodium phosphate buffer, pH 7.5 and their elution volume was determined. Analysis of the data indicated a linear relationship between Ve/Vo and log M by the method of Andrews [42] (Figure 3), where Ve is the elution volume of the protein and Vo is the void volume of the column. The Ve/Vo of the native cystatin corresponds to the molecular weight of 25247 Da (25.3 kDa) as depicted in Figure 3a.
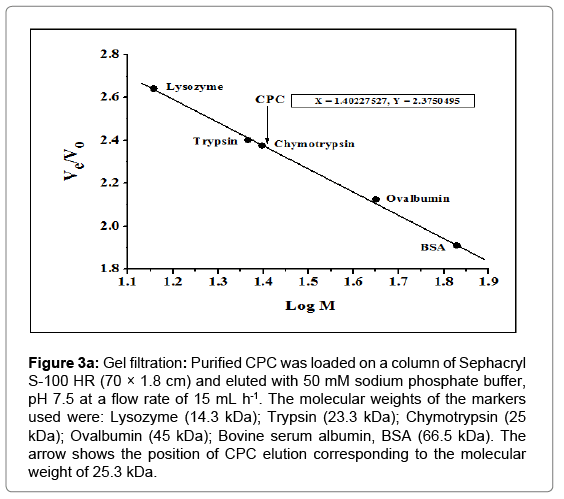
Figure 3a: Gel filtration: Purified CPC was loaded on a column of Sephacryl S-100 HR (70 × 1.8 cm) and eluted with 50 mM sodium phosphate buffer, pH 7.5 at a flow rate of 15 mL h-1. The molecular weights of the markers used were: Lysozyme (14.3 kDa); Trypsin (23.3 kDa); Chymotrypsin (25 kDa); Ovalbumin (45 kDa); Bovine serum albumin, BSA (66.5 kDa). The arrow shows the position of CPC elution corresponding to the molecular weight of 25.3 kDa.
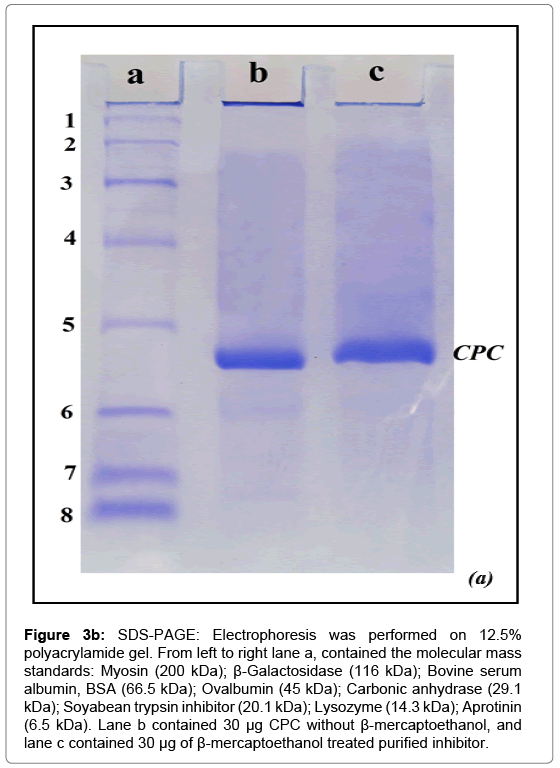
Figure 3b: SDS-PAGE: Electrophoresis was performed on 12.5% polyacrylamide gel. From left to right lane a, contained the molecular mass standards: Myosin (200 kDa); β-Galactosidase (116 kDa); Bovine serum albumin, BSA (66.5 kDa); Ovalbumin (45 kDa); Carbonic anhydrase (29.1 kDa); Soyabean trypsin inhibitor (20.1 kDa); Lysozyme (14.3 kDa); Aprotinin (6.5 kDa). Lane b contained 30 μg CPC without β-mercaptoethanol, and lane c contained 30 μg of β-mercaptoethanol treated purified inhibitor.
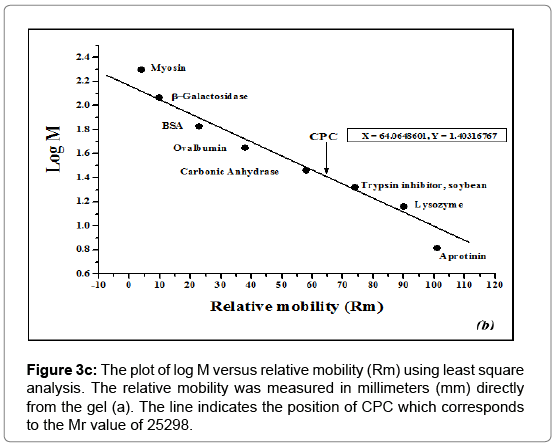
Figure 3c: The plot of log M versus relative mobility (Rm) using least square analysis. The relative mobility was measured in millimeters (mm) directly from the gel (a). The line indicates the position of CPC which corresponds to the Mr value of 25298.
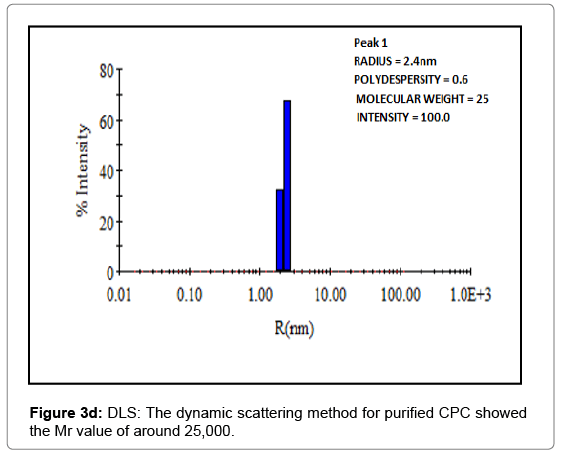
Figure 3d: DLS: The dynamic scattering method for purified CPC showed the Mr value of around 25,000.
The molecular weight of CPC under denaturing conditions was calculated from its mobility in SDS-PAGE (Figure 3b) by the procedure of Weber and Osborn [53]. The mobilities of marker proteins were plotted against the logarithm of their molecular weights (Figure 3c). The least square analysis of the data indicated a linear relationship between the logarithm of the molecular mass (log M) and relative mobility (Rm). The molecular weight obtained was 25298 (25.3 kDa).
The molecular weight of CPC was additionally confirmed and authenticated by dynamic light scattering (DLS) which also showed the value around 25 kDa (Figure 3d).
Carbohydrate and sulfhydryl content
Phytocystatins as well as Type 1 and type 2 cystatins, generally, lack carbohydrate content. However, CPC was found to have some carbohydrate content, although very less (0.34%).
The sulphydryl groups in CPC were titrated against DTNB. Results showed that 1.45% free sulfhydryl groups are present in the purified inhibitor.
Stability to pH and temperature
Effect of pH on the thiol proteinase inhibitory activity of CPC was examined at various pH values. Figure 4 shows that the inhibitor is stable in the pH range 3.0-10.0 and has maximum activity at pH 7.5.
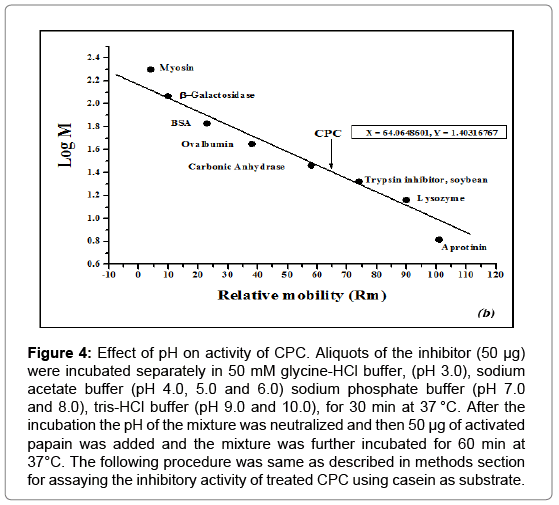
Figure 4: Effect of pH on activity of CPC. Aliquots of the inhibitor (50 μg) were incubated separately in 50 mM glycine-HCl buffer, (pH 3.0), sodium acetate buffer (pH 4.0, 5.0 and 6.0) sodium phosphate buffer (pH 7.0 and 8.0), tris-HCl buffer (pH 9.0 and 10.0), for 30 min at 37 °C. After the incubation the pH of the mixture was neutralized and then 50 μg of activated papain was added and the mixture was further incubated for 60 min at 37°C. The following procedure was same as described in methods section for assaying the inhibitory activity of treated CPC using casein as substrate.
Stability of CPC was investigated as a function of temperature between 30°C and 90°C in 50 mM sodium phosphate buffer pH 7.5, by means of inhibitory activity assay. As can be seen, CPC remained maximally active within a temperature range of 30-70°C (Figure 5). CPC was also exposed to 90°C for varying time intervals, rapidly cooled and residual inhibitory activity determined by the method of Kunitz [38]. As illustrated in Figure 6, CPC retained approximately 12% of its activity until 110 min and about 03% after 130 min. The inhibitor was thus stable up to around 110 min at 90°C.
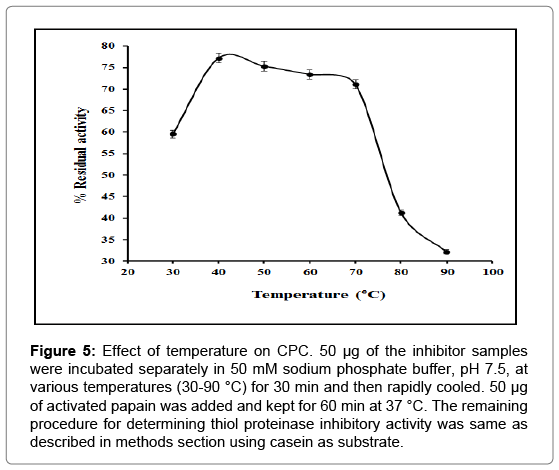
Figure 5: Effect of temperature on CPC. 50 μg of the inhibitor samples were incubated separately in 50 mM sodium phosphate buffer, pH 7.5, at various temperatures (30-90 °C) for 30 min and then rapidly cooled. 50 μg of activated papain was added and kept for 60 min at 37 °C. The remaining procedure for determining thiol proteinase inhibitory activity was same as described in methods section using casein as substrate.
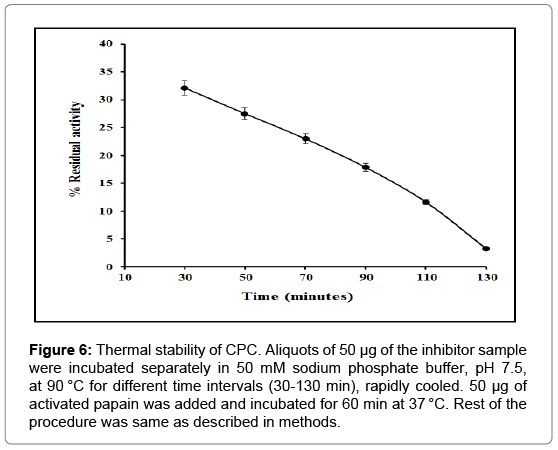
Figure 6: Thermal stability of CPC. Aliquots of 50 μg of the inhibitor sample were incubated separately in 50 mM sodium phosphate buffer, pH 7.5, at 90 °C for different time intervals (30-130 min), rapidly cooled. 50 μg of activated papain was added and incubated for 60 min at 37 °C. Rest of the procedure was same as described in methods.
Hydrodynamic parameters of the purified inhibitor
Stokes radius (Rs): Stokes radius (Rs) is defined as the radius of a smooth sphere that would have the actual frictional coefficient (f) of the protein. Stokes radius of a protein correlates well with its elution behaviour from gel filtration column and reflects the shape or globularity of the protein. The stokes radius of CPC was determined by its elution volume from a calibrated Sephacryl S-100 HR column (70 × 1.8 cm) equilibrated with 50 mM sodium phosphate buffer, pH 7.5 using marker proteins. The column was calibrated by determining the elution volume of several globular proteins with known stokes radii, such as chymotrypsin (20.9 Å), ovalbumin (27.3 Å), BSA (35.6 Å).
The linear plot between known stokes radii and [-log Kav]1/2 of the marker proteins was used for the calculation of CPC’s stokes radius [43]. As depicted in Figure 7, the value was found to be 22.82 Å for the purified inhibitor.
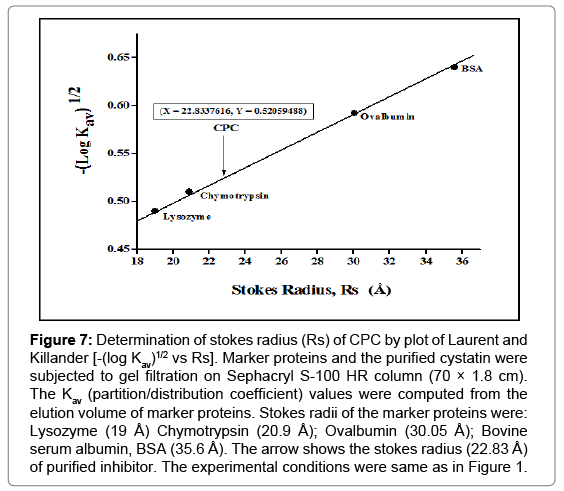
Figure 7: Determination of stokes radius (Rs) of CPC by plot of Laurent and Killander [-(log Kav)1/2 vs Rs]. Marker proteins and the purified cystatin were subjected to gel filtration on Sephacryl S-100 HR column (70 × 1.8 cm). The Kav (partition/distribution coefficient) values were computed from the elution volume of marker proteins. Stokes radii of the marker proteins were: Lysozyme (19 Å) Chymotrypsin (20.9 Å); Ovalbumin (30.05 Å); Bovine serum albumin, BSA (35.6 Å). The arrow shows the stokes radius (22.83 Å) of purified inhibitor. The experimental conditions were same as in Figure 1.
Frictional coefficient (f): The gel filtration column actually separates proteins not on their molecular weights but on their frictional coefficient which in turn is related to the stokes radius. The frictional coefficient of the purified inhibitor was found to be 4.299 × 10⁻⁸ g/s. The frictional coefficient depends on both the size and the shape of the protein.
Diffusion (D) and Sedimentation (S) coefficients: Diffusion coefficient (D) of CPC was found to be 12.68 × 10⁻⁷ cm2 s-1 , as computed from the value of its stokes radius (Rs).
The sedimentation coefficient (S) of a protein is a measure of how fast it moves through the gradient and is given by the Svedberg equation. The sedimentation coefficient of CPC was found to be 2.637 × 10⁻¹³ s. Since the value, 10-13 s is designated a Svedberg unit, S, the sedimentation coefficient of CPC can be written as 2.64 S.
The ratio of Smax/S can be used to interpret the shape of the protein. In the hydrodynamic parameter Smax/S , Smax is the maximum possible sedimentation coefficient for a protein of the given mass, corresponding to a sphere of the minimum diameter, to contain a mass of protein, with no water of hydration. The ratio of Smax/S is the same as f/fmin, where f is the actual frictional coefficient of the hydrated protein and fmin is the frictional coefficient of unhydrated minimal sphere [54]. The Smax/S ratio of CPC is 1.2011 as calculated by the following method.
fmin=6 πηRmin
Where Rmin is the minimal radius of a sphere that could contain the given mass of protein and is given by the equation:
Rmin=0.066 M1/3 (for M in Dalton; Rmin in nanometre)
The Rmin value as calculated by the above equation came out to be 1.937 × 10⁻⁷ cm (19.37 Å). Using this value, fmin calculated was found to be 3.58 × 10⁻⁸ g/s. Thus f/fmin is 1.201.
Immunological properties
Antibody titre: ELISA is a common means of determining the antibody titres. An antibody titre is a measurement of how much antibody a test antigen evokes in an organism that recognizes a particular epitope, and is expressed as the inverse of the greatest dilution. The CPC caused a good immune response and the resulting antiserum had a titre of 4678.46 as determined by direct binding ELISA in rabbit serum (Figure 8a).
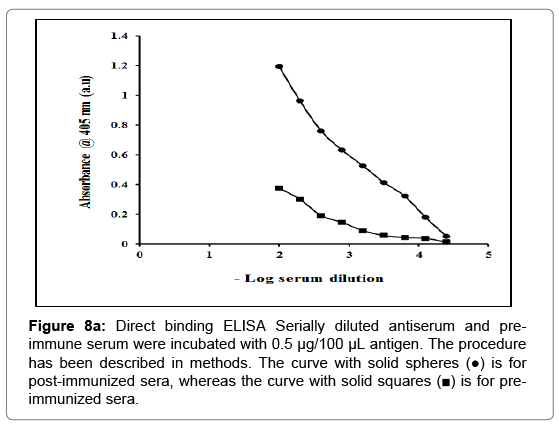
Figure 8a: Direct binding ELISA Serially diluted antiserum and preimmune serum were incubated with 0.5 μg/100 μL antigen. The procedure has been described in methods. The curve with solid spheres (●) is for post-immunized sera, whereas the curve with solid squares (■) is for preimmunized sera.
Cross-reactivity: CPC was immunogenic and induced antibody formation in rabbits. The antiserum raised against purified inhibitor showed cross reactivity with the inhibitor (indicated by single precipitin line on Immunodiffusion plate) exhibiting immunogenic purity and homogeneity of the inhibitor preparation (Figure 8b). It exhibited no immunogenic identity with buffalo heart and almond cystatins isolated in our laboratory.
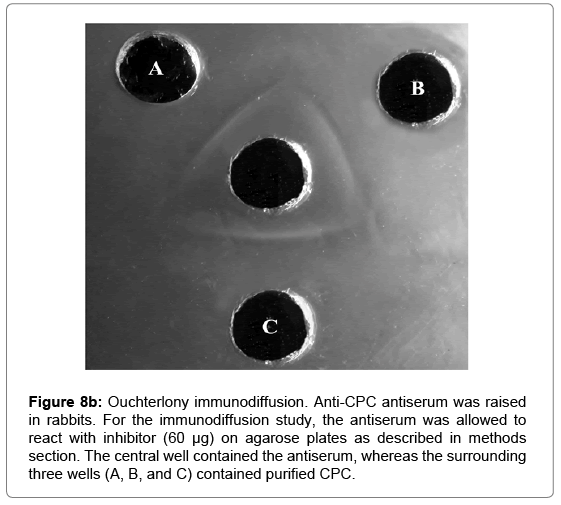
Figure 8b: Ouchterlony immunodiffusion. Anti-CPC antiserum was raised in rabbits. For the immunodiffusion study, the antiserum was allowed to react with inhibitor (60 μg) on agarose plates as described in methods section. The central well contained the antiserum, whereas the surrounding three wells (A, B, and C) contained purified CPC.
Kinetic properties of CPC
The stoichiometry of inhibition: The stoichiometry of inhibition of CPC was examined by varying its molar concentration from 0.01- 0.12 μM at a fixed molar concentration of proteinase. The residual activity of proteinase showed that as the concentration of inhibitor is increased from 0.01-0.06 μM it progressively inhibited papain at 0.06 μM, thus giving a stoichiometric ratio of 1:1, which implies that one molecule of CPC inhibits one molecule of active papain (Figure 9). Similar results were obtained for ficin and bromelain.
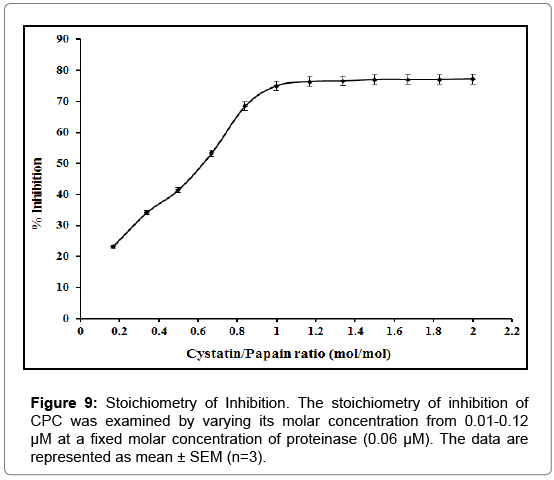
Figure 9: Stoichiometry of Inhibition. The stoichiometry of inhibition of CPC was examined by varying its molar concentration from 0.01-0.12 μM at a fixed molar concentration of proteinase (0.06 μM). The data are represented as mean ± SEM (n=3).
Inhibition of different proteinases: The inhibitory activity of CPC towards thiol proteinases, papain, ficin and bromelain and serine proteinases, trypsin and chymotrypsin were examined using casein as substrate. CPC inactivated papain and ficin very efficiently and bromelain to a slightly lesser extent. The order of inhibition was papain>ficin>bromelain. However, it failed to inhibit bovine trypsin and chymotrypsin (Figure 10).
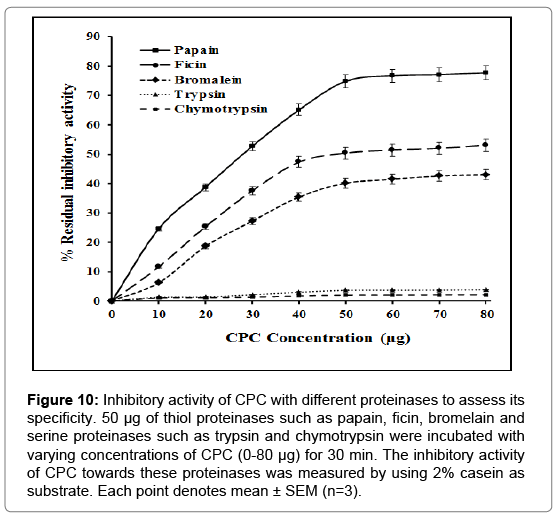
Figure 10: Inhibitory activity of CPC with different proteinases to assess its specificity. 50 μg of thiol proteinases such as papain, ficin, bromelain and serine proteinases such as trypsin and chymotrypsin were incubated with varying concentrations of CPC (0-80 μg) for 30 min. The inhibitory activity of CPC towards these proteinases was measured by using 2% casein as substrate. Each point denotes mean ± SEM (n=3).
Ki determination: Inhibition constants (Ki), for the binding of CPC to cysteine proteinases papain, ficin and bromelain, were determined by working at lower enzyme concentration, which favour the dissociation of the complex. Ki values were determined using the steady state equation derived by Krupka and Laidler [45]. The values of Ki (app) increased as a function of substrate concentration which is indicative of a competitive mechanism of inhibition. The true Ki values were obtained from the replotting of Ki (app) versus substrate concentration [S]o. The Ki values obtained for papain, ficin and bromelain are 0.82, 17.6 and 41.3 nM, respectively, implying the highest affinity of the inhibitor for papain (Table 2).
| Proteinase | Papain | Ficin | Bromelain |
|---|---|---|---|
| Ki(nM) | 0.82±0.06 | 1.76±0.08 | 4.13±0.11 |
| K+1 (M-1 s-1) | 4.44±0.03×10⁵ | 3.99±0.02×10⁴ | 2.7±0.02×10⁴ |
| K-1 (s-1) | 3.64±0.01×10⁻⁴ | 7.02±0.02×10⁻⁴ | 11.3±0.02×10⁻⁴ |
| Half-life Value (s) | 1.925×10³ | 9.87×10² | 6.133×10² |
| IC50 (µM) | 0.03 | 0.0704 | 0.165 |
Results represent the mean ± SEM calculated from three independent experiments
Table 2: Kinetic constants obtained on interaction of CPC with proteinases-papain, ficin, and bromelain.
IC50 value: The half maximal inhibitory concentration (IC50) is a measure of the effectiveness of a substance in inhibiting a specific biological or biochemical function. In the present case, the IC50 value is the concentration of the inhibitor at which 50% of the enzyme is inhibited. The IC50 values obtained with various thiol proteinases are summarized in Table 2. The values obtained for the three proteinases, papain, ficin and bromelain, are 0.03, 0.0704 and 0.165 μM, respectively, again suggesting greater affinity of the inhibitor for papaya proteinase.
Dissociation rate constant (K-1): The conditions for the dissociation were taken such that the enzyme-inhibitor complex obeys first order kinetics during the initial part of the reaction i.e., when there is an almost complete association. The K-1 values obtained for papain, ficin and bromelain from the plots were 3.6 × 10⁻⁴ s-1 , 7.02 × 10⁻⁴ s-1 and 11.3 × 10⁻⁴ s-1 respectively (Table 2).
Association rate constant (K+1): Association rate constants were calculated from measured dissociation rate and inhibition constants by the relation as given in methods section, and hence the affinity of the inhibitor for proteinases is in the following order: papain (4.44 × 10⁵ M-1s-1)>ficin (3.99 × 10⁴ M-1s-1)>bromelain (2.7 × 10⁴ M-1s-1) (Table 2).
The half-life of the complex: The half-life values of enzymeinhibitor complexes were calculated using K-1 values by the equation mentioned in the methods. The calculated half-life value of papain- CPC complex was 1.925 × 10³ s, for ficin-CPC complex it was 9.872 × 10² s, and it was 6.133 × 10² s for bromelain-CPC complex, as reported in Table 2.
Spectral analyses of the purified CPC
Absorption spectrum: CPC gave typical protein absorption with a maximum at 280 nm. The ratio of the absorbance at 280/260 nm was found to be 1.2 [55]. The interaction of inhibitor and papain at its stoichiometric ratio was studied at pH 7.5. Absorption difference spectrum of papain-CPC complex showed peaks in the spectral regions around 210 nm and 280 nm (Figure 11a), illustrating the changes in the microenvironment of aromatic amino acid residues of either one or both the proteins that occur in complex formation.
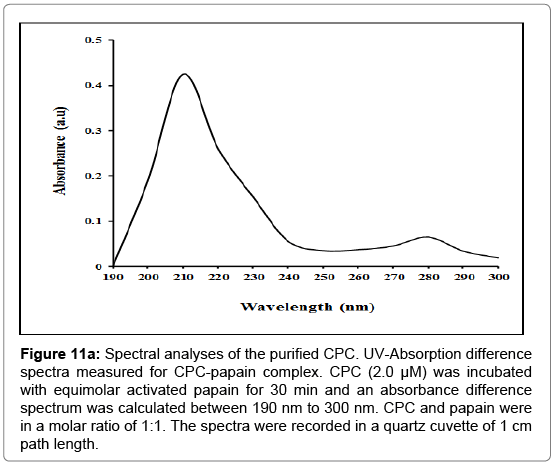
Figure 11a: Spectral analyses of the purified CPC. UV-Absorption difference spectra measured for CPC-papain complex. CPC (2.0 μM) was incubated with equimolar activated papain for 30 min and an absorbance difference spectrum was calculated between 190 nm to 300 nm. CPC and papain were in a molar ratio of 1:1. The spectra were recorded in a quartz cuvette of 1 cm path length.
Fluorescence emission spectrum: After excitation at 280 nm, where aromatic groups absorb, the CPC exhibits an emission spectrum with a maximum (λmax) at 330-35 nm that suggests that the tryptophan residues are buried in nonpolar regions of the protein [56]. The binding of CPC to papain was accompanied by appreciable changes in fluorescence emission (Figure 11b). There was a red shift of fluorescence maximum (from 330 to 335 nm) with considerable enhancement (36.06%) of fluorescence intensity at λmax. This red shift is attributable to the exposition of tryptophan residues to the polar environment. The λmax is uniquely sensitive to the polarity of the Trp micro-environment and even a small change in the conformation of a protein can bring fairly large change in its position.
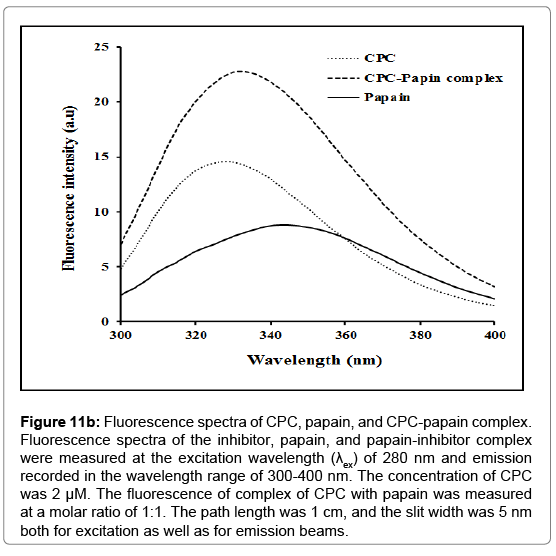
Figure 11b: Fluorescence spectra of CPC, papain, and CPC-papain complex. Fluorescence spectra of the inhibitor, papain, and papain-inhibitor complex were measured at the excitation wavelength (λex) of 280 nm and emission recorded in the wavelength range of 300-400 nm. The concentration of CPC was 2 μM. The fluorescence of complex of CPC with papain was measured at a molar ratio of 1:1. The path length was 1 cm, and the slit width was 5 nm both for excitation as well as for emission beams.
Circular Dichroism (CD) spectroscopy: Far UV-CD spectra (190-250 nm) depict the secondary structural content of the protein. In the present study far UV-CD spectra of the purified inhibitor at a concentration of 3.4 μM, shows a significant negative signal at 209 nm and a small negative peak at 222 nm also. The far-UV CD data of CPC revealed the α-helical structure of 25.34% (Figure 11c) as calculated using equation as given by Chen and his co-workers [49], and described in methods section earlier.
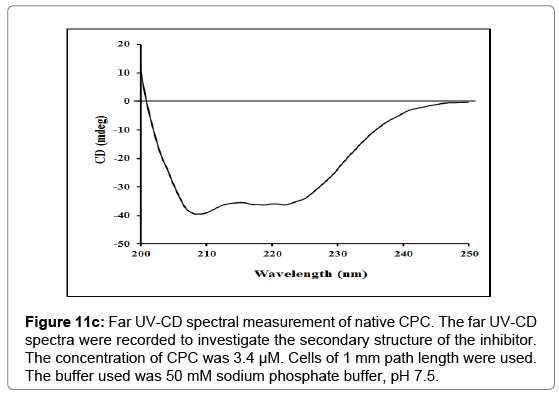
Figure 11c: Far UV-CD spectral measurement of native CPC. The far UV-CD spectra were recorded to investigate the secondary structure of the inhibitor. The concentration of CPC was 3.4 μM. Cells of 1 mm path length were used. The buffer used was 50 mM sodium phosphate buffer, pH 7.5.
Cystatins are a group of cysteine proteinase inhibitors (CPIs) or thiol proteinase inhibitors (TPIs) belonging to the superfamily of evolutionary, structurally and functionally related proteins involved in the inhibition of papain and related cysteine proteinases like ficin and bromelain [57,58]. Most of the evidences indicate that the proteolytic activity of both endogenous and exogenous cysteine proteinases is primarily regulated by this cystatin super family. These inhibitors (cystatins) are ubiquitous in organisms, ranging from viruses to bacteria, plants, and mammals. Cystatins in plant systems perform a variety of functions. They are expressed in abiotic stress and in plant defense processes against insect attacks [34]. Phytocystatins present in some cereal seeds has been reported to prevent certain types of cancer [35]. These CPIs are present in seeds of all plants and are involved in the mobilization of protein reserves, plant senescence etc by providing a powerful regulatory role. These have been isolated in a variety of plant sources some of which have been already discussed in the introduction section. However, isolation and characterization of cystatin from chick pea is reported for the first time through this communication. It was found to be specific for cysteine proteases since no inhibitory activity against aspartic (pepsin) and serine proteinases (chymotrypsin and trypsin) was detected.
Thus, in the present work, a cysteine proteinase inhibitor (CPC) was purified from chickpea seeds by the method as reported in the methods section. The procedure used provided a percent yield of 21.09 and fold purification of 78.89 (Table 1). Purification of CPIs from other sources has been reported using affinity chromatography, chromatofocusing, gel filtration and ion exchange chromatography [13,59,60]. The purified inhibitor was found to be homogenous on the basis of charge and molecular weight as shown by native PAGE (Figure 2a). In SDS-PAGE, both under reducing as well as non-reducing conditions, CPC gave a single band suggestive of the presence of single polypeptide chain (Figure 2b) i.e., lack of subunit structure in the inhibitor molecules.
The molecular weight of the isolated inhibitor was established from several techniques to have more accuracy (Figure 3). From gel filtration chromatography on Sephacryl S-100 HR column, it was found to be 25247 Da (~25300). This result was further ascertained by SDS-PAGE under both reducing and non-reducing conditions giving the molecular weight of the inhibitor as 25298 Da (~25300). Additional confirmatory reinforcement to these findings was provided by DLS (dynamic light scattering) which also gave the molecular mass of CPC around 25 kDa. However, there is a slight variation in the observed molecular mass of these methods, and thus is largely insignificant (Figures 3a-3c). Cystatins type 1 and type 2 have been classified on the basis of molecular weight, presence or absence of disulphide bonds and carbohydrate content [61], and phytocystatins are sometimes regarded as the intermediate family between type 1 and type 2. Generally, cystatins type 1 and type 2 isolated from tissues lack carbohydrates [62] whereas the presence of carbohydrates is a distinguishing property of type 3 cystatins, the kininogens [63]. However, the presence of carbohydrate has been reported in some tissue thiol proteinase inhibitors like cystatins E, F, M and those isolated from goat kidney and brain [59,60,64-66]. With MW of 25.3 kDa, negligible carbohydrate content (0.34%) and a small amount of sulfhydryl content (1.45%), CPC finds its place in between the two families i.e., type 1 and type 2, which is a typical character of phytocystatin family.
Analysis of the influence of pH on the activity of CPC reveals that the inhibitor remains fairly active in the pH range of 3.0-10.0 with maximum activity around pH 7.0-8.0 (Figure 4). CPC also exhibited stability in a wide temperature range of 30-70°C (Figure 5) and remained significantly active up to 110 min when heated to 90°C (Figure 6). High stability of the purified CPC in broad temperature and pH ranges is in good agreement with other cystatins like Phaseolus mungo (black gram) cystatins [52], goat brain cystatin [60], stefin A and B [67] etc.
The purified inhibitor was characterized for its various hydrodynamic properties. Stokes radius of CPC as deduced from its gel filtration behaviour was 22.82 Å (Figure 7). The diffusion coefficient of CPC was found to be 12.68 × 10⁻⁷ cm2 s-1. The sedimentation coefficient of CPC was calculated to be 2.64 S. The values of stokes radius and Smax/S ratio can be used to predict the shape of the protein molecule [68]. Globular proteins typically have Smax/S ratio of 1.2-1.3 (for example catalase and serum albumin have Smax/S of 1.20 and 1.29), and the ratio increases to 1.6-2.0 or more for elongated proteins [69]. For CPC, Smax/S ratio was calculated to be 1.201. The values of stokes radius and Smax/S ratio for CPC are in close agreement with globular proteins (trypsin and ovalbumin), suggesting that CPC is globular in shape.
The antibody titre is the measure of the presence and a number of antibodies produced against a target antigen. The amount and diversity of antibodies correlate with the strength of the body’s immune response. The CPC evoked a fair immune response with an antibody titre of 4578.46 as determined by direct binding ELISA in rabbit serum (Figure 8a). The antibodies raised against purified inhibitor gave a reaction of identity with the inhibitor as indicated by a single precipitin line on immunodiffusion suggesting that the isolated CPC has immunogenic homogeneity (Figure 8b). Experiments also showed that the antiserum had no immunogenic identity with almond and buffalo heart cystatins purified in our lab. This indicates that the epitopes of chickpea thiol proteinase inhibitor are different from almond and heart thiol proteinase inhibitors. The purified inhibitor was found to be specific for cysteine proteinases since no activity against serine proteinases (trypsin and chymotrypsin) was detected (Figure 10). The stoichiometry of binding of purified cystatin to papain, ficin and bromelain was 1:1 (Figure 9). This value shows that CPC is a tight competitive binding inhibitor of these proteinases and essentially all enzyme molecules are able to bind to the inhibitor. Anastasi et al. [13] have also reported equimolar complexes of cystatin with cysteine proteinase. Abrahamson et al. [70] also reported the rapid formation of 1:1 complex between cystatin C and papain. The results are also consistent with the findings of Abrahamson et al. [71]. Members of cystatin superfamily also show different binding stoichiometries with papain. The high molecular weight kininogens from human and sheep plasma as well as low molecular weight kininogens from the latter show 1:2 stoichiometry of interaction with papain [72,73].
The IC50 values of the CPC obtained for papain, ficin and bromelain were 0.03, 0.08 and 0.165 μM, respectively (Table 2). Lower IC50 value suggests a greater affinity of the inhibitor towards the enzyme. This quantitative measure indicates how much of inhibitor is needed to inhibit a given thiol proteinase by half. The values obtained for CPC indicate its relative affinity in the order as papain then ficin and then bromelain. Katunuma and Kominami have found an IC50 value for the inhibitor isolated from rat liver as 0.16 μg for papain, 0.46 μg for ficin, 4.2 μg and 0.14 μg for cathepsin B and H, respectively [74]. This can be exploited in pharmacological research as a measure of antagonist inhibitor potency.
Accurate Ki values were determined by working at lower enzyme concentrations and using equations derived by Krupka and Laidler, and Henderson [45,46]. Ki values were calculated from the slope of the curve obtained for the inhibition of the caseinolytic activity of papain, ficin and bromelain. CPC was found to be a strong inhibitor of CPs as indicated by their Ki values. The data shows that CPC inhibited papain, ficin and bromelain with Ki values of 0.82, 17.6 and 41.3 nM, respectively, under conditions of routine assay system (Table 2). Thus, of the enzymes studied, CPC binds most tightly to papain. These values are in good comparison with other thiol proteinase inhibitors. Sumbul and Bano obtained Ki values of 1.87 × 10⁻⁸ M and 3.125 × 10⁻⁸ M, for inhibition of papain by goat brain cystatins [59]. Quite similar values were obtained for goat kidney cystatins [66]. Human placental cystatin also gave a Ki value of 5.5 × 10⁻⁸ M for papain as reported by Rashid et al. [75]. Ki values of the nanomolar range have been documented for cathepsin B, H, and L with cystatin A, cystatin C, and cystatin D [76-78]. Moreover, with the increase in casein concentration, there was an increase in the values of Ki suggesting the inhibition to be of the competitive type which is also reported earlier by Li et al. [79] and by Nicklin and Barrett [80] for inhibition of human cathepsin B by chicken cystatin.
Association constant obtained for papain-CPC interaction was 4.39 × 10⁵ M-1s-1. In general, proteinases having low Ki also have high K+1 and low K-1 values suggesting the stability of the enzyme inhibitor complex and rapidity of its formation. Our data is in accordance with this, thereby suggesting that the interaction of CPC with papain is rapid and stable. The association rate constants obtained for ficin and bromelain were 3.99 × 10⁴ M-1s-1 and 2.7 × 10⁴ M-1s-1, respectively. Thus, ascertaining the order of affinity as papain>ficin>bromelain. The dissociation constant (K-1) values for the enzyme-inhibitor complex was determined by displacement procedure, in which the inhibitor released from the complex was trapped by the excess substrate (6% casein) with an increase in time. The amount of enzyme released from the complex was monitored at regular durations by measurement of enzyme activity. The respective K-1 values obtained for papain, ficin and bromelain are 3.6 × 10⁻⁴, 7.02 × 10⁻⁴ and 11.3 × 10⁻⁴s-1, respectively (Table 2). The Ki and rate constants for association as well as dissociation of the inhibitor with papain, ficin and bromelain are also comparable with the values reported for chicken cystatin [81], human cystatin C and bovine cystatin C [82] and cystatin D [77] for their interactions with various cysteine proteinases (papain, ficin and cathepsins B, H and L). Thus, our findings of the kinetic data in the present study are in full agreement with the available literature. Furthermore, the above data gives comprehensive information about the kinetics of inhibition of purified thiol proteinase inhibitor with papain, ficin and bromelain and the overall comparison showed that CPC inhibits papain more effectively compared to other two proteinases.
Spectral properties of the purified inhibitor and its interaction with papain were also investigated in the present work. The spectroscopic changes observed in UV-Vis absorption difference spectrum of CPCpapain complex (Figure 11a) accompanying the binding of CPC with papain indicate that the environment of several aromatic residues in the proteins has been perturbed upon interaction. The peak at 280 nm is indicative of changes around tyrosine residues [83-85]. The strong absorbance at 210 nm along with a slight shoulder peak at 230 nm suggests that there exists interaction between CPC and papain, and the microenvironment around CPC and/or papain has changed.
Fluorescence studies showed that complexation of CPC with papain resulted in changes in both the intensity as well as the shape of the emission spectrum. The CPC-papain complex showed redshift of 2 nm with respect to CPC, while as a blue shift of 13 nm was observed with respect to papain along with an increase in fluorescence intensity. The largest increase of intensity was observed between 330- 335 nm (Figure 11b) indicating that these changes arise predominantly from perturbations around tryptophan and/or other aromatic amino acid residues due to interactions of the two proteins. Thus, the results indicate that the UV-Vis absorption and fluorescence emission changes are more due to conformational changes in proteins rather than any local interaction affecting the chromophoric groups of the two constituent proteins of the complex. A CD spectrum in the far UV region depicts the contributions of the secondary structure of the protein [86]. The α-helical structure of the protein in the far UV region is characterized by negative peaks at 208-210 nm, at 222 nm and a positive peak between 190-192 nm [49,86]. CPC has α-helical content of 25.34%, as calculated from the ellipticity values at 222 nm (Figure 11c) using equation given by Chen et al. [49]. Schwabe and co-workers have reported the α-helical content of about 20% in chicken cystatin [87]. The overall characterization has summarized in the Figure 12.
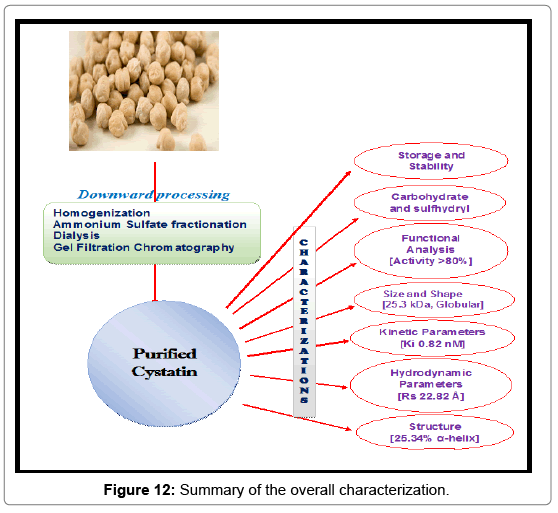
Figure 12: Summary of the overall characterization.
The study shows the structural and functional characteristics of CPC resembling with previously reported phytocystatins and thus aptly places itself in the phytocystatin family or family 4 cystatins. It is interesting to speculate on the physiological role of this newly isolated phytocystatin. It seems likely that this endogenous inhibitor would at least serve a protective function against inappropriate proteolysis during the seed germination when the proteinase machinery is highly active to carry out digestion of stored protein reserves for providing nourishment to the germinating seedlings, and thus signifies the importance of cystatin of chickpea. Moreover, this inhibitor can serve as a model phytocystatin of study as useful tools for potential utilization in agriculture and pharmacology. However, apart from all this further study are needed to establish some other roles of this inhibitor in chickpea.
The authors are highly thankful for the facilities provided by AMU Aligarh. SAB is a Senior Research Fellow of the University Grants Commission (UGC), New Delhi, India. We are grateful to SAP-DRS and DST-FIST programmes for their generous research support.
The authors confirm that this article content has no conflicts of interest.