
Journal of Clinical Trials
Open Access
ISSN: 2167-0870

ISSN: 2167-0870
Research Article - (2022)
Purpose: Endometrial Carcinoma (EC) is recognized as one of the most common female reproductive system malignant tumors. Great efforts have been made to improve the diagnosis and prognostic analysis of EC, however, more sensitive prognostic evaluation system for EC remains to be established. The mutation status of PTEN and its association with clinical characteristics, as well as its prognostic value in EC need to be evaluated.
Methods: TCGA dataset comprised of 526 EC cases were used to perform a comprehensive analysis of PTEN mutation. Kaplan-Meier survival plot were performed to analyze the clinical significance of PTEN mutation. GO, KEGG pathway and IPA network analysis were performed to identify the specific pathways for PTEN mutation patients. And the prognostic value of PTEN mutation was further analyzed.
Results: Here, the highest mutation frequency of PTEN (65%) was found in EC from Pan Cancer. PTEN mutation status was significantly correlated with the better prognosis of EC patients. A total of 66 Differentially Expressed Genes (DEGs) were identified between PTEN-mutant and PTEN-wild groups. KEGG pathway enrichment analysis suggested that some key pathways were relevant to the tumorigenesis and development of EC. The DEGs were mainly associated with endocrine and reproduction related pathways based on the IPA analysis. Then, a PTEN related-genes prognostic signature including CLDN9, UCHL1, BEX2, SLC47A1, PGR, SLC25A35, SCGB2A1, MSX1, CRABP2 and MAL was established. The K-M result showed the significant differences of survival rate between high- and low- risk groups. Furthermore, univariate and multivariate Cox regression analysis results indicated that age, figo-stage and risk score could be identified as independent prognostic factors. Finally, a nomogram for predicting survival rate was established.
Conclusion: The above data suggested that PTEN mutation status could be serviced as a potential prognostic biomarker for EC, which might guide future EC personalized treatment.
Endometrial carcinoma; PTEN; Prognosis; Tumorigenesis
Endometrial Carcinoma (EC) is a group of epithelial malignant tumors that occurs in the endometrium and is one of the most common female reproductive system tumors [1-3]. Endometrial cancer occurs mostly in perimenopausal and postmenopausal women, and 75% of cases occur after the age of 50, 20% of cases occur are between the ages of 40 and 50 years old, 5% of cases occur under the ages of 40 years old, and a very small number of cases occur in young people around 20 years old [4]. There are more than 189,000 new cases of EC and about 45,000 deaths worldwide each year [5]. Although the treatment of endothelial cells has made progress, the survival time and quality of life after treatment have not been significantly improved [6]. EC is an extremely heterogeneous and complex gynecological malignant tumor with diverse clinical and pathological features and diverse treatment responses [7]. Therefore, it is necessary to explore its potential pathogenesis, to identify high-risk patients, customize individualized treatment, and determine potential therapeutic targets [8]. Next-generation sequencing results revealed many gene mutations in EC, which are related to prognosis [9-13]. To the best of our knowledge, EC is a disease with a multifactorial aetiology, and the tumoricgenesis of EC is a continuous process involving multigenicalterations. DNA sequencing and mutation analysis of TCGA EC data identified some prominently mutated genes: p5310, PTEN11 and PIK3CA12. Among them, PTEN was significantly associated with the prognosis of EC13. However, these analyses did not provide an in-depth analysis of the prognosis of PTEN mutation-related characteristic genes on EC.
PTEN is a tumor suppressor which has the functions of controlling a variety of cells, including cell cycle, apoptosis, senescence, transcription and mRNA translation of many genes [14]. In tumor cells, PTEN is often inactivated due to gene mutations and epitope mutations reveals that PTEN may be a promising marker and signal for therapeutic goals. PTEN mutations and PTEN silencing can lead to dysfunction in many cancer types [15]. So far, many studies have reported frequent mutations of PTEN in human cancers, including ovarian cancer, colorectal cancer, breast cancer and stomach cancer [16-18]. Moreover, mutations in the PTEN gene are associated with the prognosis of EC patients. In endothelial cells, PTEN mutation is the most common genetic variation, which has been found in 37%-83% of cases, especially in the early stages. PTEN was found to be required for cell maturation and activation in the regulation of endothelial cells [19]. In addition, PTEN mutations are related to immune infiltrating cells in the tumor microenvironment. And the mutations in the PTEN gene are associated with the prognosis of EC patients. In summary, these findings suggest that PTEN may be a potential predictive and therapeutic target for EC8. However, the role of PTEN mutation in EC is still unclear, so further prognostic analysis of PTEN mutation and related genes is needed [20].
In this study, we used bioinformatics methods to elucidate the possible relationship between the PTEN mutations and EC patient outcomes and analyze the role and prognostic value of genes related to PTEN mutations in EC patients, with hopes of laying a theoretical foundation for clinical work and evaluation of patient prognosis [21].
Data collections based on TCGA
The transcriptome data, VarScan 2-based somatic mutation data and corresponding clinical features of EC PTEN-mutant patients (N=337) and EC PTEN-wild patients (N=189) were accessed from the TCGA data portal. All EC gene expression, clinical, and somatic mutation data were downloaded through the Data Coordinating Center. Patients who met the following criteria were included in the TCGA-EC cohort: 1) histologically confirmed EC; 2) patients with RNA sequencing data; 3) patients with detailed clinical features including Overall Survival (OS). Ultimately, 526 EC patients were enrolled in our research.
Pan cancer analysis of PTEN mutations
Pan cancer somatic mutation data of PTEN was obtained from cBioPortal (https://www.cbioportal.org) database [22]. And then the mutation frequency of PTEN in different cancers was compared.
Clinical significance of PTEN mutation in EC
To analyze the relationship between PTEN mutation and EC patient prognosis, Kaplan-Meier survival analysis was performed in PTEN-mutant patients and PTEN-wild patients using R ‘survival’ package. Then R ‘survminer’ package was used to draw the Kaplan- Meier Overall Survival (OS) curve. In addition, we compared the prognosis difference of different mutation types of PTEN in PTEN- mutant patients using the same method. Furthermore, correlation between clinical stage and PTEN mutation was analyzed.
Differentially expressed genes
Differentially Expressed Genes (DEGs) in the TCGA database were identified between PTEN-mutant and PTEN-wild groups with the threshold of absolute log2-fold-change (FC)>1 and a P<0.05 with R package ‘limma’ (version 1.4.5) [23]. Then, the box line diagram and heat map were drawn using R package ‘ggplot2’ (version 3.3.2) [24] and ‘pheatmap’(version 0.7.7) [25].
GO/KEGG enrichment analysis
Gene Ontology (GO) is an international standard classification system of gene function, which used to describe the properties of genes and gene products in organisms. In this study, GO enrichment analysis was performed for DEGs of PTEN-mutant and PTEN-wild type in EC using R package ‘clusterprofiler’ (version 1.0.2) [26]. Kyoto Encyclopedia of Genes and Genomes (KEGG) is the main public database about the pathway. Meanwhile, KEGG pathway enrichment analysis was performed for DEGs using the same package in R. GO analysis contains three terms, Cellular Component (CC), Molecular Function (MF), and Biological Process (BP). The selection criterion for GO biological processes and KEGG pathways was P<0.05.
Ingenuity pathway analysis
The pathway enrichment analysis and key function mining analysis of all DEGs were performed in Ingenuity Pathway Analysis (IPA) software (version 1-18-05) [27]. And the canonical pathways and disease function related pathways deserved attention.
Establishment of the PTEN-related prognostic gene signature
The TCGA-UCEC dataset was used to identify the prognosis gene signature, and then 526 patients were divided into training set (368 samples) and test set (158 samples) according to the ratio of 7:3. Firstly, Univariate cox regression analysis of DEGs was carried out via the ‘survival’ package (version 3.2-3) [28] in training set. Then, genes with P<0.05 were screened for Least Absolute Shrinkage and Selection Operator (LASSO) to establish prognosis gene signature in R ‘glmnet’ package (version 4.0-2) [29], by setting the parameter family to Cox.
Evaluation and validation of prognostic value of the PTEN- related prognostic gene signature
The risk score was calculated based on the coefficients obtained from LASSO regression analysis of training set to assess each patient’s risk. Then, the patients were divided into high and low-risk group according to the median value of risk score. Next, Kaplan-Meier (K-M) analysis was used to assess the performance of the prognostic gene signature and predict OS. Moreover, Receiver Operating characteristic Curve (ROC) was drawn via R ‘survival ROC’ package (version 1.0.3) [30], and then Area Under the Curve (AUC) was used to check the accuracy of the prediction. In addition, the risk curve, survival state scatter diagram and gene signature expression heat map were drawn. Importantly, previous steps were repeated in the validation set to validate the prognostic significance of prognostic gene signature. Furthermore, the relationship between clinicopathological characteristics and patients' risk scores were analyzed.
Independent prognostic analysis of risk score and clinicopathological features
Univariate Cox regression analysis was performed for age, tumor stage, PTEN mutation or not and risk score to study the prognostic gene signature and clinical characteristics. The prognostic factors with P<0.05 were screened for multivariate Cox regression analysis.
Construction and validation of survival prediction nomogram
Prognostic factors with p-value <0.05 in independent prognostic analysis were used to construct nomogram via R ‘rms’ package(version 1.0.3) [31]. Then, 1-, 3- and 5-year survival rate was predicted by the sum of scores for each independent prognostic factor. Calibration curve was used to evaluate the accuracy of the survival rate.
Statistical analysis
All statistical analyses were performed in R (version 3.5.2), and P<0.05 was considered statistically significant. Pearson's chi-square test was employed for comparison of categorical, clinicopathologic variables. The AUC was used as an accurate index to identify the best combination of multiple markers.
Pan cancer analysis of PTEN mutation
For further confirm the mutation frequency of PTEN for Pan Cancer, cBioPortal database was used to analyze the landscape of PTEN in different tumors. Just as expected, the results indicated that PTEN had the highest mutation frequency in EC (65%) followed by Glioblastoma Multiforme (34%) and Uterine Carcinosarcoma (19%) in Figure 1A. In addition, the mutation sites of PTEN were scattered in the whole gene region, and Arginine mutation was the most frequent in Figure 1B. Furthermore, we compared the mutations of PTEN to TP53 in EC, and the results showed that the mutation frequency of PTEN (64%) was even higher than that of TP53 (37%) in Figure 1C.
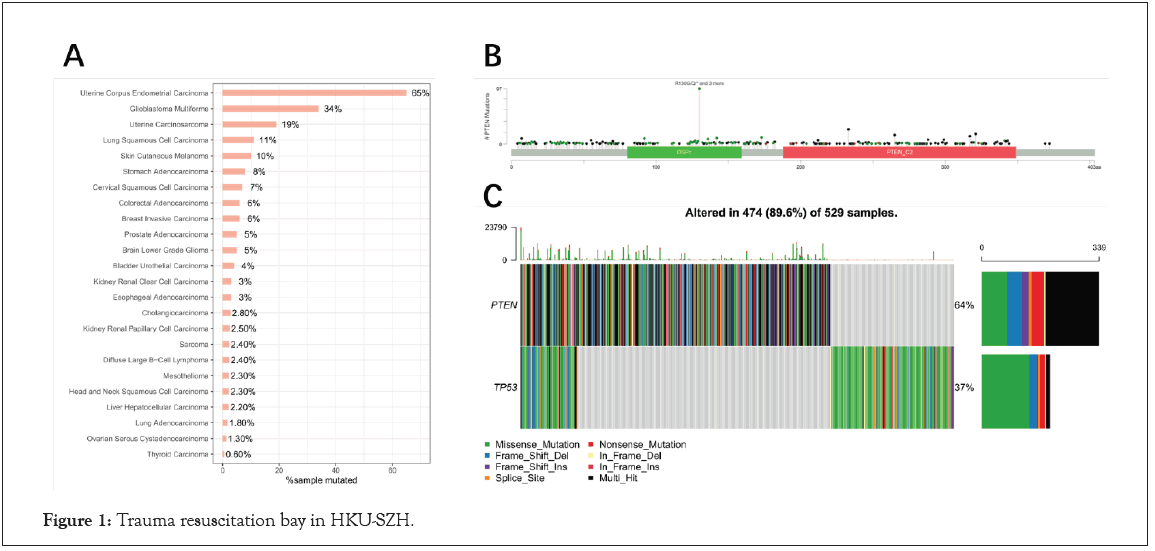
Figure 1: Trauma resuscitation bay in HKU-SZH.
Clinical significance of PTEN mutation in EC
The Kaplan-Meier survival analysis results showed that PTEN mutation status was significantly correlated with the better prognosis of patients with EC (P<0.01, Figure 2A). To investigate whether the mutation types associated with the prognosis, patients with EC were divided into seven groups based on PTEN mutation types. However, survival curve analysis (Kaplan-Meier plots) displayed that there was no significant difference in overall survival among the seven groups (P=0.97, Figure 2B). In addition, the correlation between PTEN mutation status and EC clinical stage was also analyzed in Figure 2C. The result showed that the number and proportion of PTEN mutant survivors were higher than that of wild type in stage I.
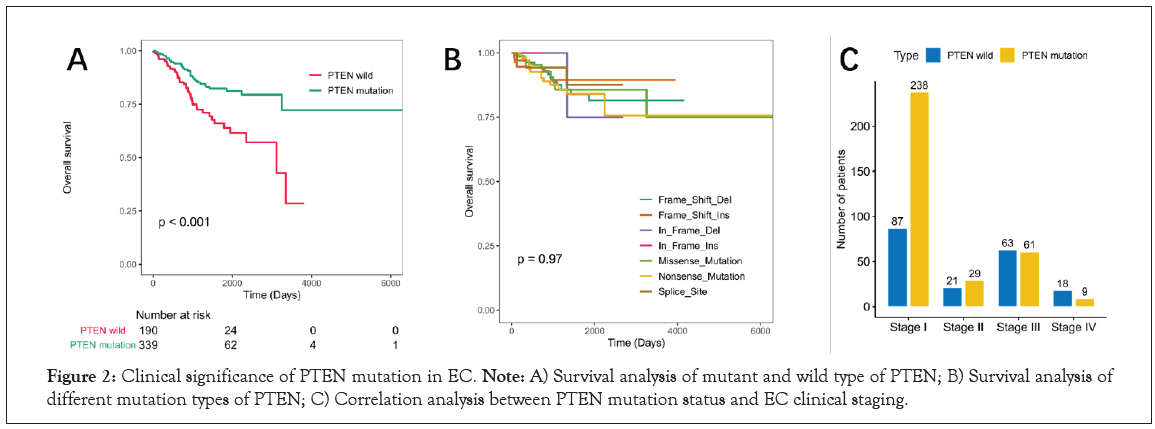
Figure 2: Clinical significance of PTEN mutation in EC. Note: A) Survival analysis of mutant and wild type of PTEN; B) Survival analysis of different mutation types of PTEN; C) Correlation analysis between PTEN mutation status and EC clinical staging.
GO enrichment and pathway analyses for differentially exprKEGG essed genes
PTEN mutation status may be a potential biomarker for guiding treatment in EC. Therefore, we identified the Differentially Expressed Genes (DEGs) between PTEN-mutant and PTEN-wild groups. A total of 66 DEGs were successfully identified, including 40 upregulated and 26 downregulated genes in Table S1. These DEGs were plotted in a Volcano map to demonstrate differences between the two groups, where the red and blue dots represented the up and downregulated genes, respectively in Figure 3A. And the gene expression of each sample could be seen from the heat map, where the red indicates high relative expression and green indicates low relative expression in Figure 3B. A previous study suggested that PTEN may drive cancer progression and regulate cancer treatment, further affect the prognosis of patients. To gain a better understanding of how PTEN may affect the prognosis of EC patients, we next performed the enrichment analysis of DEGs. As a result, the top 10 results of enrichment terms disclosed by biological processes in the GO analysis included in Figure 3C. The results revealed that DEGs enriched in GO biological process categories were closely related to the developmental system in Figure 3C and Table S2, including 'digestive system development', 'epithelial cell development', 'digestive tract development'. We also noticed some morphogenesis functions were more affected, such as ‘embryonic limb morphogenesis’, ‘embryonic appendage morphogenesis’, ‘embryonic forelimb morphogenesis’, etc. In addition, ‘response to estradial’ and ‘response to steroid Hormone’ were the metabolic and endocrine pathways. As for the molecular function categories, DEGs were closely related to enzyme activation and inhibition activity in Figure 3C and Table S3.
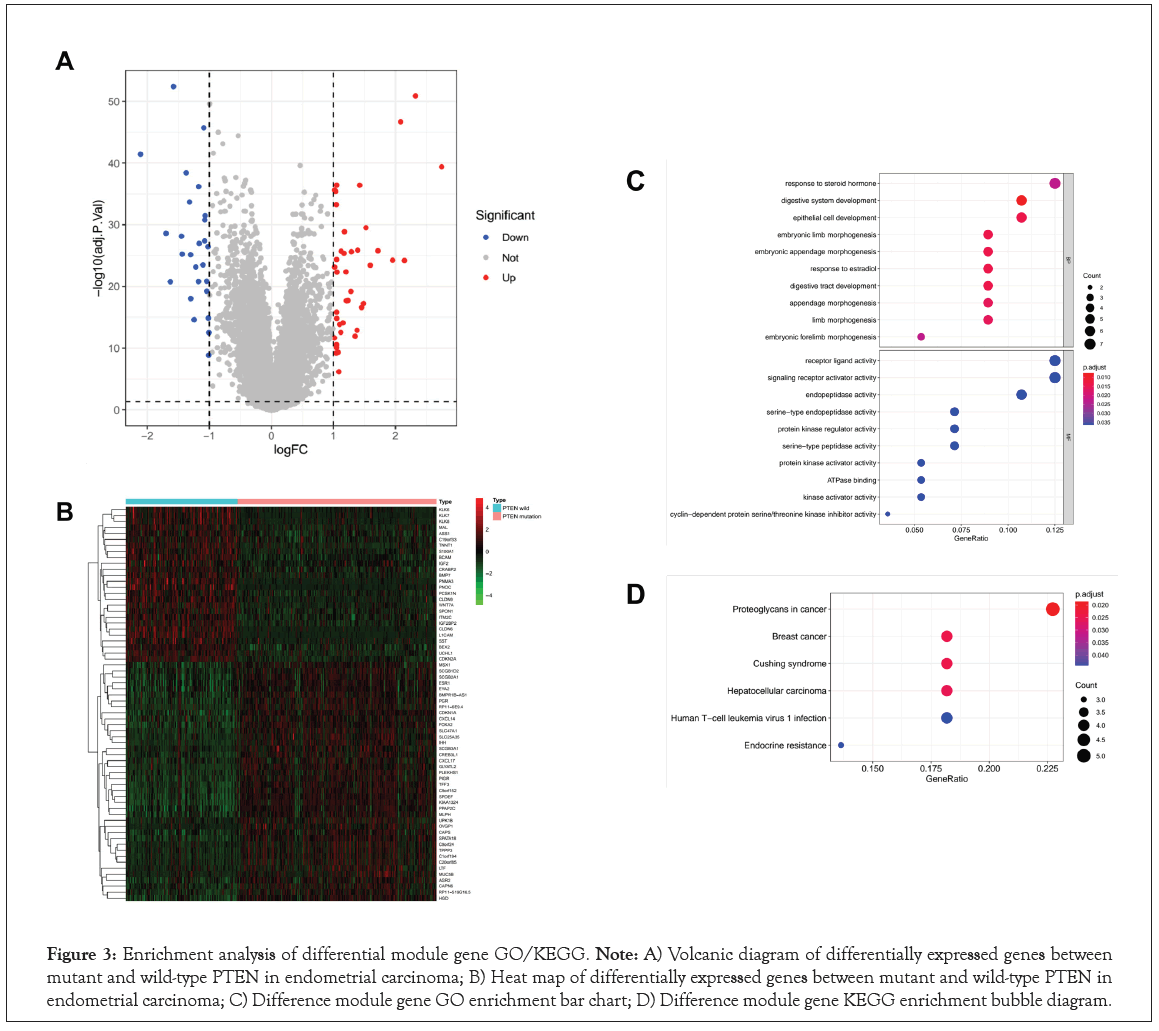
Figure 3: Enrichment analysis of differential module gene GO/KEGG. Note: A) Volcanic diagram of differentially expressed genes between mutant and wild-type PTEN in endometrial carcinoma; B) Heat map of differentially expressed genes between mutant and wild-type PTEN in endometrial carcinoma; C) Difference module gene GO enrichment bar chart; D) Difference module gene KEGG enrichment bubble diagram.
Furthermore, it was suggested by KEGG pathway enrichment analysis that some key pathways were relevant to the tumorigenesis and development of EC, such as ‘proteoqlycans in cancer’, ‘endoerine risistence’ and ‘human t-ell leukemia virus 1 infection’ in Figure 3D and Table S4. Interestingly, some other cancer-related and disease-related pathways were also enriched, such as ‘breast cancer’, ‘hepatocellular carcinoma’ and ‘cushing syndrome’, etc.
Ingenuity pathway analysis
IPA (Ingenuity Pathway Analysis, pathway analysis software) is a graphical interface bioinformatics software based on cloud computing. It can analyze, integrate and understand omics data from the perspective of biological pathways, and is suitable for transcriptomics and proteomics [27]. Big data analysis such as science and metabolomics is also suitable for some small-scale experiments that generate lists of genes and chemical substances. The results of omics data analysis mainly include five results: classical pathways, upstream transcription regulation, downstream regulator effects, diseases and functions, and molecular interaction networks. Its biggest advantage is that it can predict the activation/ inhibition of the pathway based on the up and down adjustment of the molecules in the uploaded data, and then predict the change trend of the entire pathway after it is activated [32]. We used IPA to enrich 115 classical pathways in EC (P<0.05), among which the most important classical pathways include MSP-RON Signaling in Macrophages Pathway, Molecular Mechanisms of Cancer, MSP- RON Signaling in Cancer Cells Pathway, SPINK1 Pancreatic Cancer Pathway and Glioblastoma multiforme signal transduction, in which Glioblastoma multiforme signal transduction is inhibited in Figure 4A and Table S5. In addition, the disease and biological function enrichment analysis of DEGs was performed using IPA. The analysis results of GO, KEGG and IPA show that DEGs are mainly related to endocrine and reproductive pathways, including cancer and endocrine system diseases in Figure 4B and Table S6.
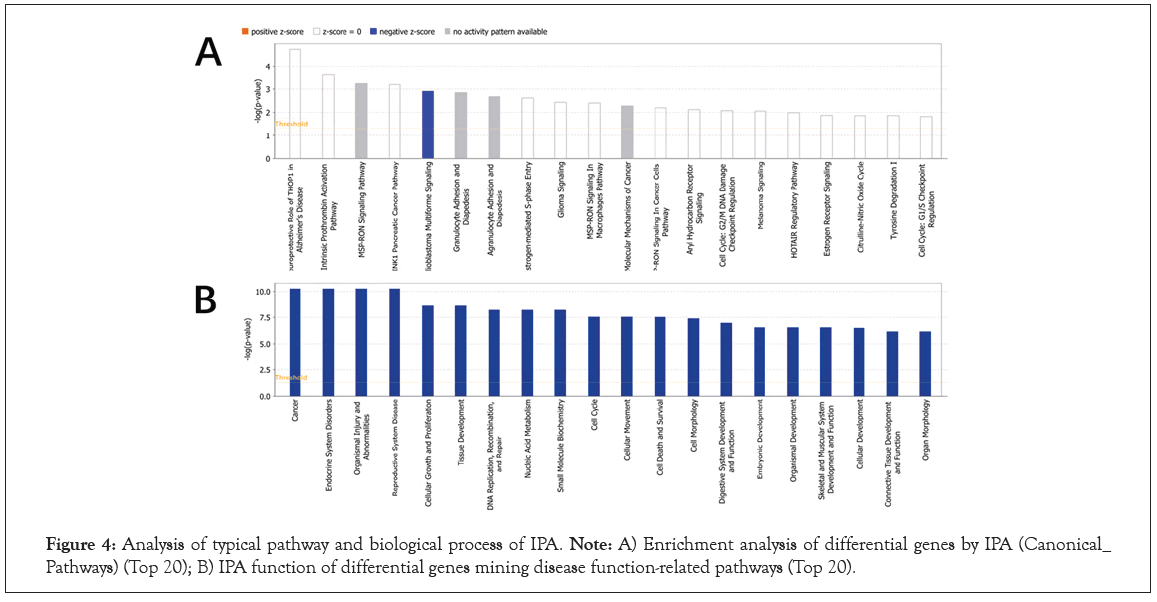
Figure 4: Analysis of typical pathway and biological process of IPA. Note: A) Enrichment analysis of differential genes by IPA (Canonical_ Pathways) (Top 20); B) IPA function of differential genes mining disease function-related pathways (Top 20).
Establishment of the prognostic signature for EC patients
Identification of prognosis biomarkers for EC and as potential therapeutic targets remains an important clinical issue. Therefore, we investigated the potential relationship between PTEN related genes and the prognosis of patients with EC. The 526 samples of TCGA-EC were divided into training set (N=368) and validation set (N=158). Then, a total of 18 overall survival-associated genes were identified based on univariate cox regression analysis of DEGs (P<0.05, Figure 5A and Table S7). In the follow-up LASSO regression analysis of these survival related genes, 10 genes (CLDN9, UCHL1 UCHL1 , BEX2, SLC47A1, PGR, SLC25A35, SCGB2A1, MSX1, CRABP2 and MAL) were screened to be independent prognostic factors for survival while the optimal lambda was 0.0130152 (Figure 5B, 5C and Table S8). Finally, 10-genes prognostic signature was established.
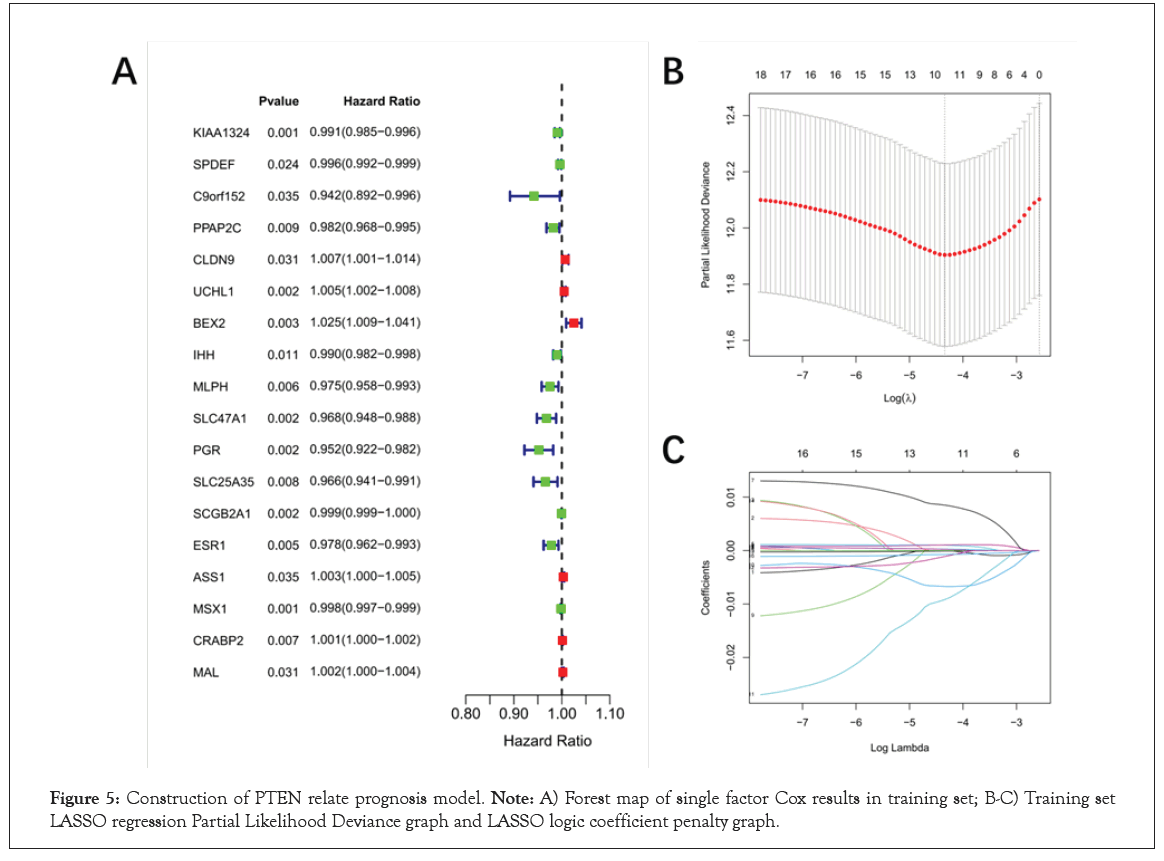
Figure 5: Construction of PTEN relate prognosis model. Note: A) Forest map of single factor Cox results in training set; B-C) Training set LASSO regression Partial Likelihood Deviance graph and LASSO logic coefficient penalty graph.
Evaluation and validation of prognostic value of the PTEN- related prognostic gene signature
The EC patients were divided into a high-risk group and a low-risk group based on the median of the risk score in Figure 6A. And more red dots were found in high-risk group indicating that with the increase of risk score, the rate of death increased in the training set in Figure 6A. Then, prognostic signature genes expression heatmap showed that MSX1, SLC47A1, PGR, SLC25A35 and SCGB2A1 were down-regulated, while CLDN9, CRABP2, MAL, UCHL1 and BEX2 were up-regulated in high-risk group in Figure 6A. The K-M results showed that patients in the high-risk group showed significantly poorer OS than patients in the low-risk group in the training set (P<0.001, Figure 6B). Time-dependent Receiver Operating characteristic Curve (ROC) with AUC values was used to assess the prediction accuracy of the prognostic signature. The AUCs for 1-year, 3-year, and 5-year survival were 0.658, 0.680 and 0.720 for the training set, respectively in Figure 6C.
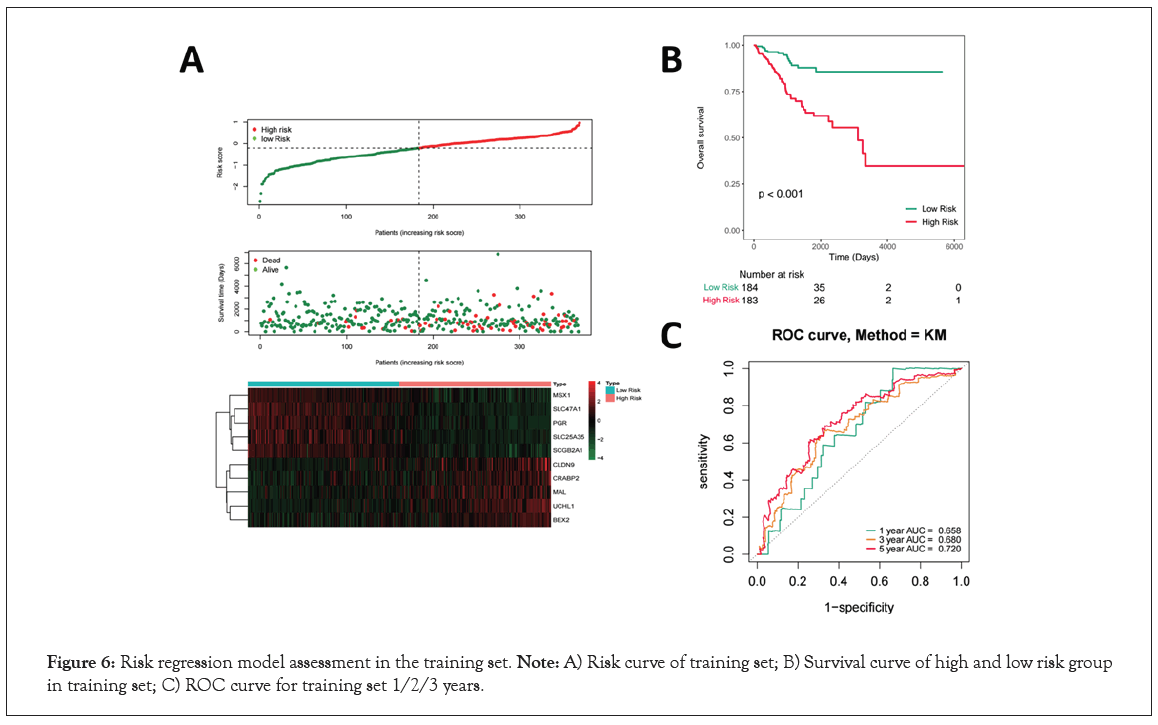
Figure 6: Risk regression model assessment in the training set. Note: A) Risk curve of training set; B) Survival curve of high and low risk group in training set; C) ROC curve for training set 1/2/3 years.
To validate the predictive ability of this 10-genes prognosis signature, similar procedures were carried out in the validation set in Figure 7A. According to the median of the risk score, 158 samples of EC were divided into high- and low-risk group (Figure 7A). And the more dead patients were distributed in high-risk group based on the survival state scatter diagram. The genes expression heatmap showed the similar result with the training set (Figure 7A). Moreover, the K-M results also showed a significantly different survival rate between high- and low- group (P=0.04, Figure 7B). In addition, the AUCs for 1-year, 3-year, and 5-year survival were 0.780, 0.729 and 0.697, respectively in Figure 7C. Collectively, our results indicated a good performance of the prognostic signature for survival prediction.
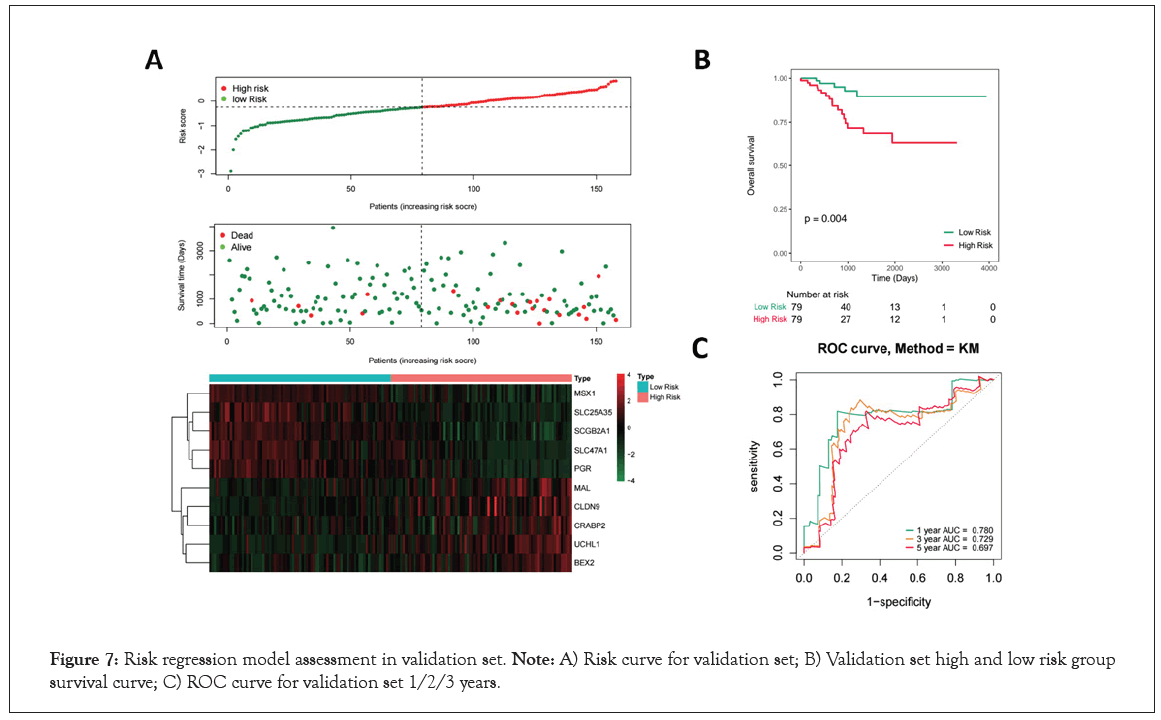
Figure 7: Risk regression model assessment in validation set. Note: A) Risk curve for validation set; B) Validation set high and low risk group survival curve; C) ROC curve for validation set 1/2/3 years.
Correlation between risk score and clinical features
In order to analyze the correlation between risk score and clinical characteristics, 526 patients with clinical information including age and figo-stage were included in further analysis. The risk score of Age (≤ 50 VS. Age >50) showed significantly different, as well as the figo-stage (Stage I VS. Stage II VS. Stage III VS. Stage IV) showed the similar result in Figure 8A and 8B. In addition, risk score was extremely significantly difference between PTEN-wild and PTEN-mutant groups (P<0.0001, Figure 8C). Finally, the heat map of prognostic characteristic gene expression was drawn. It was found that high levels of CLDN9, CRABP2, MAL, UCHL1 and BEX2 were positively correlated with risk value in Figure 8D.
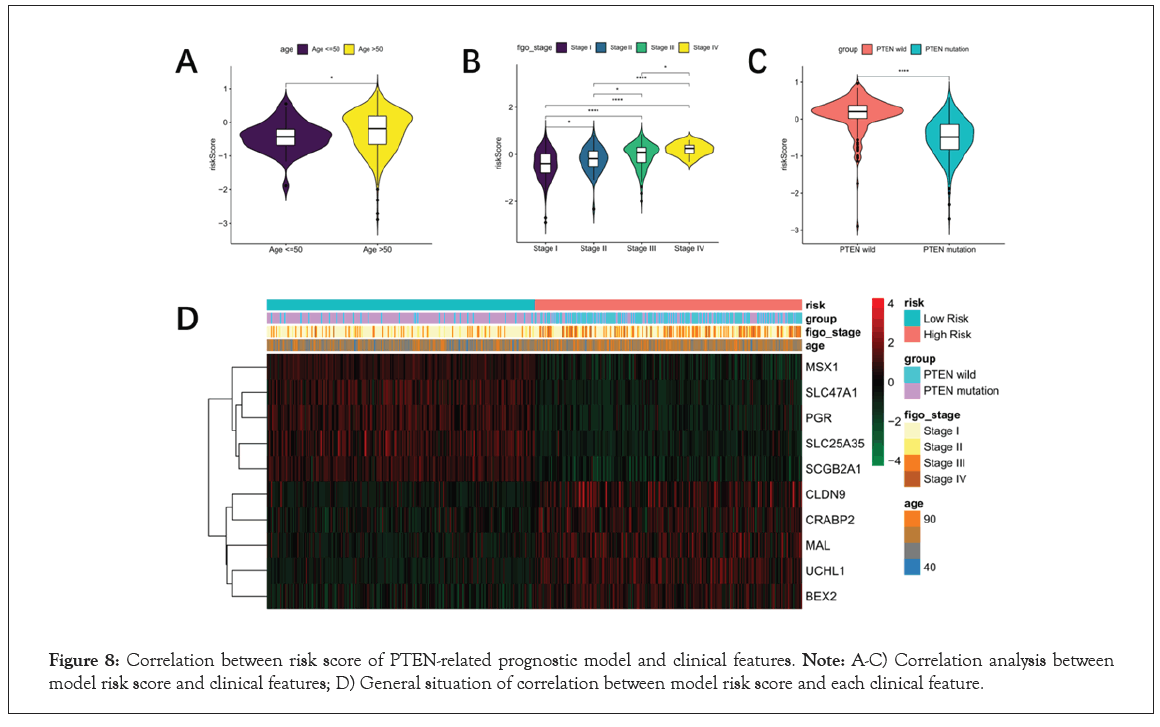
Figure 8: Correlation between risk score of PTEN-related prognostic model and clinical features. Note: A-C) Correlation analysis between model risk score and clinical features; D) General situation of correlation between model risk score and each clinical feature.
Establishment and validation of survival prediction nomogram
In order to further analyze the independent prognostic ability of the 10-genes prognostic signature, Univariate and multivariate Cox regression analyses were performed. The results indicated that age, figo stage, PTEN mutation status and risk score were included in the multivariate Cox regression analysis with P<0.005 in Figure 9A. Then age (P=0.005), figo-stage (P<0.001) and risk score (P<0.001) were identified as independent prognostic factors to establish nomogram for predicting survival rate in Figure 9B. The 1-, 3- and 5-year survival probabilities were estimated by patient's age, figo-stage and risk score in the nomogram in Figure 9C. And then, 1-, 3- and 5-year calibration curve were drawn to validate the accuracy of survival rate prediction. The results showed that 1-year survival rate was more credible than 3- year survival rate according to the nomogram. Conversely, the prediction was not trustworthy in 5-year survival in Figure 9D-9F.
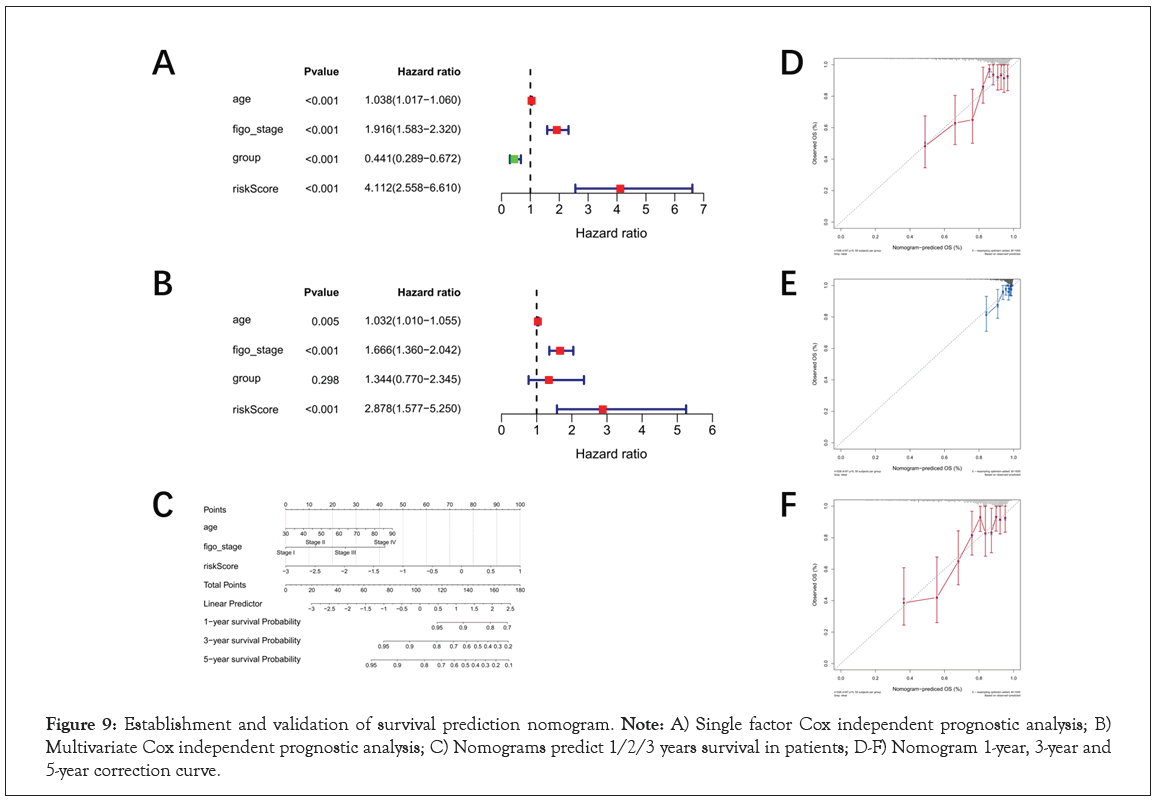
Figure 9: Establishment and validation of survival prediction nomogram. Note: A) Single factor Cox independent prognostic analysis; B) Multivariate Cox independent prognostic analysis; C) Nomograms predict 1/2/3 years survival in patients; D-F) Nomogram 1-year, 3-year and 5-year correction curve.
Interaction of prognostic signature genes
Finally, we return to the analysis of gene interaction on the tumorigenesis and development of UCEC. The Dental Disease, Developmental Disorder, Gastrointestinal Disease, Cancer, Cellular Movement, Endocrine System Disorders, Cancer, Organismal Injury and Abnormalities, Reproductive System Disease, Dermatological Diseases and Conditions, Inflammatory Disease, Organismal Injury and Abnormalities, Cellular Movement, Digestive System Development and Function, Gastrointestinal Disease and Cancer, Cell Death and Survival, Organismal Injury and Abnormalities were the top 6 diseases and functions pathways in Table S9. Ulteriorly, the genes of all pathways were used to construct the interaction network diagram. The results indicated that prognostic signature genes PGR, CRABP2, BEX2 and MSX1 were interacted with more genes than SLC47A1, SCGB2A1, SLC25A35, UCNL1, MAL and CLDN9 in Figure 10. We speculated that PGR, CRABP2, BEX2 and MSX1 may be related to the tumorigenesis and progress of EC.
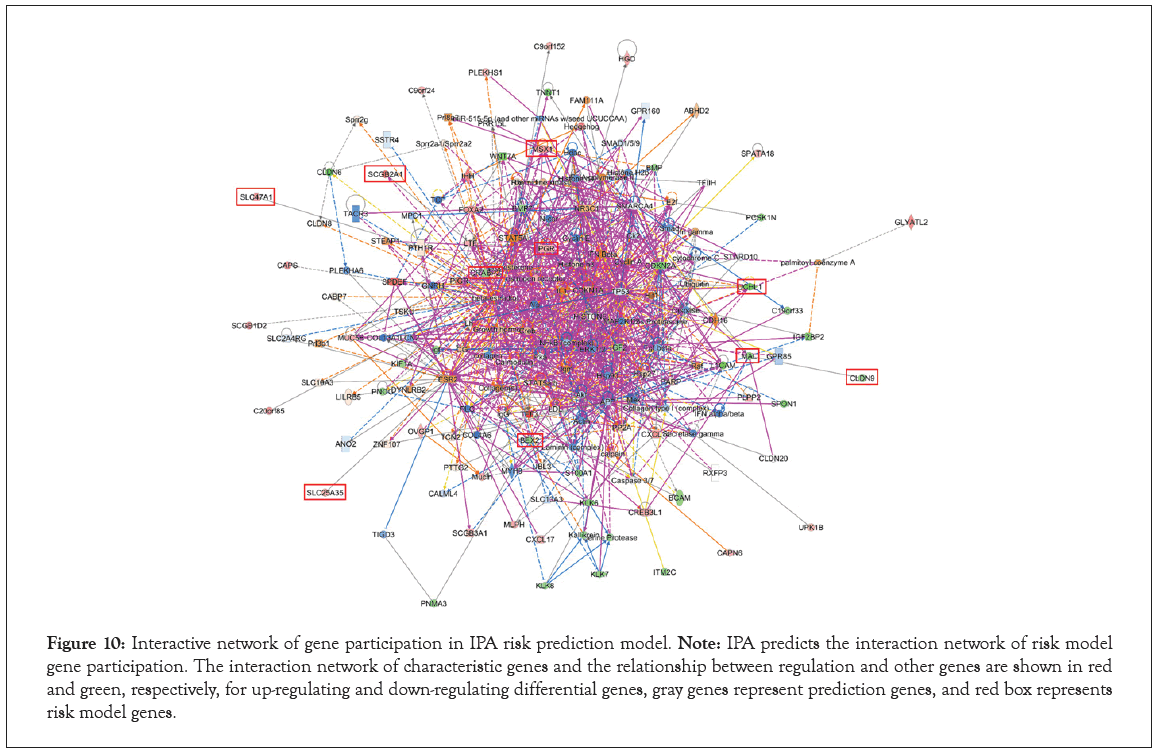
Figure 10: Interactive network of gene participation in IPA risk prediction model. Note: IPA predicts the interaction network of risk model gene participation. The interaction network of characteristic genes and the relationship between regulation and other genes are shown in red and green, respectively, for up-regulating and down-regulating differential genes, gray genes represent prediction genes, and red box represents risk model genes.
In recent years, the incidence rate of endometrial cancer is increasing. The incidence rate is low, and the prognosis is not perfect. In order to improve the curative effect and prognosis of endometrial cancer, people have been studying the influencing factors. At present, the staging system of the International Federation of Obstetrics and Gynecology (FIGO) identifies tumor staging, tumor grade and histological type as risk stratification factors. There is no routine diagnosis or prognostic purpose in Endometrial Cancer (EC). However, an accurate prognostic model has not been developed for predicting the outcome of EC patients [33].
Our studies found that the mutation frequency of PTEN in EC was relatively high, and it was related to the age, histological type, mutation site and type, clinical stage and grade of EC patients. We conducted a comprehensive analysis of PTEN mutant and wild- type clinical samples. According to the Kaplan-Meier curve, PTEN- mutant patients had a better correlation than PTEN wild-type patients. And these data were correlated with the clinical outcome and prognosis of EC patients, and it was found that the number of patients during Stage-I was different in the proportion and number of PTEN wild-type and mutant types.
For a long time, PTEN has been a research hotspot in many fields such as cell biology, molecular biology, and oncology. As a multifunctional tumor suppressor gene, how can PTEN exert its activity? PTEN is a PIP3 phosphatase, contrary to the function of PI3K, which is the main negative regulator of PI3K/Akt signal transduction. However, under physiological conditions, PTEN is mainly distributed in the cytoplasm and nucleus. Only some cell lines can be observed PTEN protein transport to the cell membrane under specific conditions. PI3K/Akt signaling pathway is regulated by PI3K/Akt signaling pathway gene mutation to exert its tumor inhibitory activity, which directly antagonizes PI3K mediated cell growth, metabolism, proliferation and survival signals by phosphorylating PIP3 to PIP2 [34].
In the regulation of immune cells, PTEN, as a necessary factor for cell maturation and activation, inhibits cell proliferation by regulating intracellular signal transduction pathway. Vidotto, et al. reported that PTEN plays an important role in maintaining the integrity of the genome. The loss of PTEN may affect the immune response and help mediate the failure response to immunotherapy. PTEN can also regulate the antiviral interferon network, thereby changing the way cancer cells communication with immune cells and the way they are targeted by immune cells [35]. Aquila, et al. determined that PTEN plays a role in metabolism and tumor stroma in cancer models. In mouse mammary stromal fibroblasts, gene inactivation of PTEN accelerates the occurrence of breast cancer [36]. Therefore, the clinically isolated PTEN mutations are crucial to the function of the encoded protein, to the prognosis of tumors and to the exploration of related molecular mechanisms [37].
Mutations in specific genes, including Oncogene activation and tumor suppressor gene inactivation, are crucial for the prognosis of endometrial cancer [38]. However, the high frequency of PTEN mutations, deletions or promoter methylation silencing will lead to the inactivation of PTEN enzyme activity, resulting in increased cell proliferation and decreased cell death [39]. In addition to genome inactivation, many other pathogenic mechanisms related to the suppression or abnormal subcellular compartmentalizations of PTEN gene expression are also related to tumorigenesis.
The abundance and activity of PTEN are highly regulated by various complementary mechanisms at the transcription, post- transcriptional and post-translational levels [40]. Hu M, et al. reported that the combined use of miRNA ectopic expression and PI3K/Akt pathway inhibitors may achieve synergistic therapeutic effects [41].
In recent years, more and more studies have confirmed that PTEN mutation has a good correlation with the prognosis of EC. Tao Y, et al. reported that PTEN mutations are associated with better Overall Survival (OS) and Disease-Free Survival Time (DFS) in EC patients, which are consistent with the results of this study. Compared with EC patients without PTEN mutation, the OS and DFS of EC patients with PTEN mutation are prolonged. According to verification, PTEN mutation is an independent prognostic factor of DFS8. Rodríguez, et al. found that loss-of-function mutations of the PPTEN gene are common in human cancers and the germline of patients with PTEN Hamartoma Tumor- associated Syndrome (PHTS), and that the catalytic activity of tumor-associated PTEN mutant proteins is heterogeneous. Westin, et al. reported that PTEN loss in obese patients was associated with improved progression-free survival when stratified by body mass index [42]. Therefore, we could prove that PTEN was significantly mutated in EC, and the higher the mutation frequency, the better the prognosis of patients.
In addition, to predict whether the differentially expressed genes between PTEN mutant and wild-type are related to patient survival, we established a prognostic model of PTEN-related genes including CLDN9, UCHL1, BEX2, SLC47A1, PGR, SLC25A35, SCGB2A1, MSX1, CRABP2 and MAL. Because COX analysis and LASSO algorithm can be used for survival analysis and regression model establishment, they are particularly suitable for us to determine and predict genes related to EC patients. Through this method, we divided patients into high and low-risk groups according to the median value of risk and analyzed the survival of the high and low- risk groups. We identified 10 survival coefficient-related genes in EC patients that high levels of MSX1, SLC47A1, PGR, SLC25A35, and SCGB2A1 are negatively correlated with risk values, while high levels of CLDN9, CRABP2, MAL, UCHL1, and BEX2 are positively correlated with risk values. According to reports, these genes are also involved in the occurrence of a variety of cancers. MSX1, which acts as a transcriptional inhibitor during embryogenesis, is believed to play a role in limb formation, craniofacial development, tooth formation and tumor growth inhibition, and has also been confirmed to have an important role in endometrial carcinogenesis [43]. SLC47A1 gene encoded (MATE1) protein interacts with a variety of drugs to regulate the pharmacokinetics of metformin and the long-term hypoglycemic effect of metformin [44]. CLDN9 is a proto-oncogene for hepatocellular carcinoma, which affects the Stat3 signaling pathway through Tyk2, and ultimately enhances the metastatic ability of liver cells [45]. However, the remaining risk model genes in this study need to be further investigated in EC.
Our studies indicated that PTEN mutations and mutation-related genes were significantly associated with the prognosis of EC patients. They can be used as potential biomarkers for predicting EC. In addition, we constructed a nomogram that predicted survival in EC patients and showed strong clinical application value. In order to explore the correlation between the risk score of the PTEN prognostic model and the clinical characteristics of EC patients, we used Cox independent prognostic analysis to predict age, tumor stage, PTEN mutation and risk score, and mapped the data to ROC curve and risk curve. Our research has certain limitations, which need to be verified in future large-scale prospective clinical studies. Furthermore, we can further understand the biological role of PTEN in endometrial cancer through in vitro and in vivo functional assays. These PTEN mutation-related genes may become potential clinical biomarkers and therapeutic targets, providing guidance for future basic research and clinical work.
We found that PTEN mutation is significant in EC, and the higher the mutation frequency, the better the prognosis of patients. PTEN mutant has better prognosis correlation than PTEN wild type. The correlation between risk score of PTEN prognostic model and clinical characteristics of EC patients was predicted, and the ROC curve and risk curve were drawn to determine the effectiveness. It is necessary to further explore the specific mechanism of PTEN mutation and its application in the treatment of EC.
Ethics approval and consent to participate
The program has been reviewed by the Ethics Sub-committee of Biomedical Experimental Animal Medical Research of Henan University (Ethics Committee No.: HUSOM2021-303), and the research content of Prognostic Analysis of PTEN Mutation in Endometrial Carcinoma meets the ethical requirements of experimental animal/human samples and is approved for research in Figure 11.
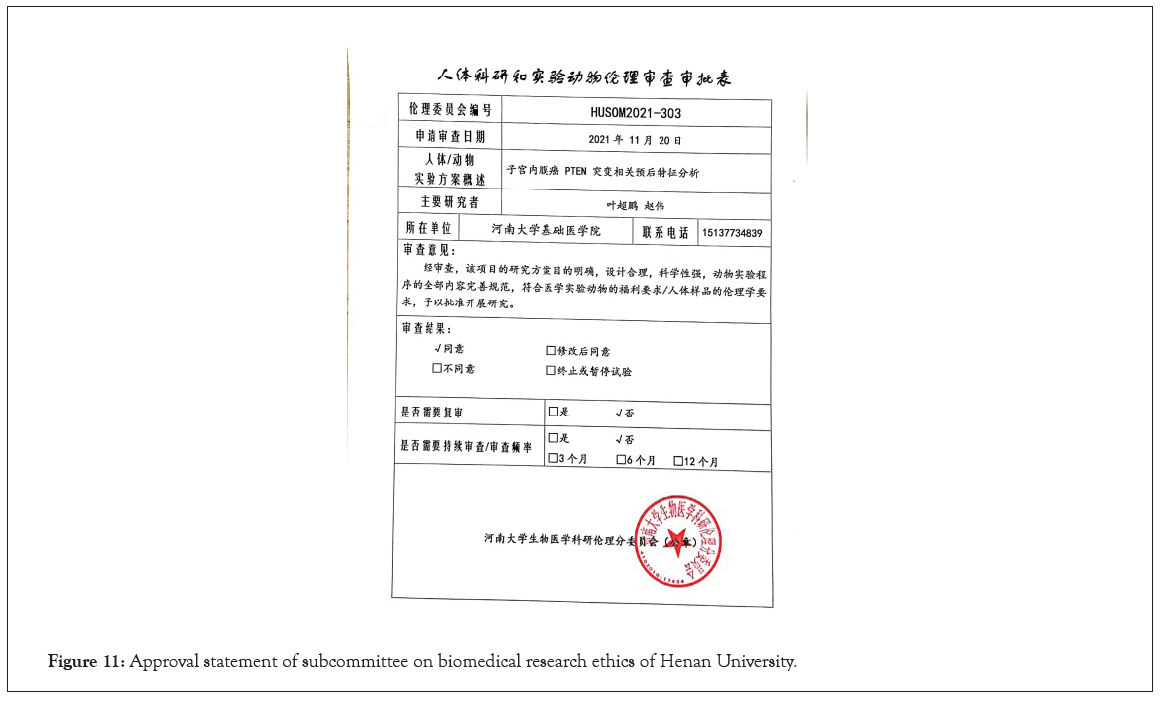
Figure 11: Approval statement of subcommittee on biomedical research ethics of Henan University.
Not applicable
All databases used in this study were derived from the TCGA database (https://portal.gdc.cancer.gov/). The data in this database are publicly available, free of charge, for public download and use.
The authors have declared that no competing interest exists.
There is no financial support from other organizations or institutions or individuals.
Chapeng Ye wrote the main manuscript text, Yuanqiao Ma was responsible for data proofreading, and all authors reviewed the manuscript and made necessary changes.
Thanks to Ji's team for their technical help, including providing instruments, equipment or related experimental materials, cooperating with experimental work, providing beneficial inspiration, suggestions, guidance and review, undertaking certain auxiliary work, and so on.
Chaopeng Ye, Wei Zhao, Yuanqiao Ma and Qi Zhang belong to Laboratory of Cell Signal Transduction, Medical School of Henan University, Henan, China. Guoqing Li belong to Henan university of Science and Technology, Henan, China.
[Crossref] [Google Scholar] [Pubmed]
[Crossref] [Google Scholar] [Pubmed]
[Google Scholar] [Pubmed]
[Google Scholar] [Pubmed]
[Google Scholar] [Pubmed]
[Google Scholar] [Pubmed]
[Google Scholar] [Pubmed]
[Google Scholar] [Pubmed]
[Google Scholar] [Pubmed]
[Google Scholar] [Pubmed]
[Google Scholar] [Pubmed]
[Google Scholar] [Pubmed]
[Google Scholar] [Pubmed]
[Crossref] [Google Scholar] [Pubmed]
[Crossref] [Google Scholar] [Pubmed]
[Google Scholar] [Pubmed]
[Crossref] [Google Scholar] [Pubmed]
[Google Scholar] [Pubmed]
[Google Scholar] [Pubmed]
[Google Scholar] [Pubmed]
[Google Scholar] [Pubmed]
[Google Scholar] [Pubmed]
[Google Scholar] [Pubmed]
[Crossref] [Google Scholar] [Pubmed]
[Google Scholar] [Pubmed]
[Google Scholar] [Pubmed]
[Crossref] [Google Scholar] [Pubmed]
[Google Scholar] [Pubmed]
[Google Scholar] [Pubmed]
Citation: Ye C, Ma Y, Zhang Q, Zhao W, Li G (2022) Prognostic Analysis of PTEN Mutation in Endometrial Carcinoma. J Clin Trials. S17 :002.
Received: 08-Apr-2022, Manuscript No. JCTR-22-15654; Editor assigned: 11-Apr-2022, Pre QC No. JCTR-22-15654(PQ); Reviewed: 25-Apr-2022, QC No. JCTR-22-15654; Revised: 02-May-2022, Manuscript No. JCTR-22-15654(R); Published: 09-May-2022 , DOI: 10.35248/2167-0870.22.S17.002
Copyright: © 2022 Ye C, et al. This is an open access article distributed under the terms of the Creative Commons Attribution License, which permits unrestricted use, distribution, and reproduction in any medium, provided the original author and source are credited.