Fisheries and Aquaculture Journal
Open Access
ISSN: 2150-3508
ISSN: 2150-3508
Research Article - (2016) Volume 7, Issue 2
Somatolactin (SL), the member of the growth hormone (GH)/prolactin (PRL) family, is fish-specific pituitary hormone with diverse functions. However, little is known about its biological function in fish hepatocytes. Using tilapia as a model, SLtranscripts were shown to be widely expressed in various extrapituitary tissues with the relatively high expression level in liver. To explore the biological action of SL in hepatocytes, we produced and purified recombinant tilapia SL protein which could induce pigment aggregation in tilapia melanophores. Further, the antiserum for the SL was produced and its specificity was confirmed by antiserum preabsorption. During 4 week starvation, hepatic SL transcripts in starved fish were significantly higher than the control fish starting on the 1st week of starvation until 4th week. After re-feeding, the SL transcripts level returned to normal. Using primary cultures of tilapia hepatocytes, insulin-like growth factors (IGF1 and IGF2) gene expression were elevated by static incubation with recombinant tilapia SL. In contrast, removal endogenous SL by immunoneutralization using SL antiserum was shown to inhibit IGF1 and IGFgene expression. These findings, taken together, provide evidence for the first time that SL may serve as a novel regulator in fish stimulating IGF1 and IGF gene expression in hepatocytes.
Keywords: Somatolactin; Insulin-like growth factor; Tilapia hepatocytes; Fasting and refeeding
SL: Somatolactin; GH: Growth Hormone; PRL: Prolactin; IGF: Insulin-like Growth Factor
Somatolactin (SL), a member of the growth hormone (GH)/ prolactin (PRL) family, is fish-specific hormone as the gene has been lost in tetrapods during the period of land invasion [1]. It is well demonstrated that SL possesses both glycosylated and non-glycosylated forms in fish [2]. Biochemical and physiological studies demonstrated that SL might be involved in a variety of physiological actions including reproduction [3-5] smoltification [6] acid-base balance [7] background adaptation [8,9] phosphate transport [10] melanosome aggregation [11,12] and immune response [13]. Although major physiological actions of SL remain an interesting yet unresolved issue, direct evidences from mutant of medaka [14-16] and “cobalt” rainbow trout [17,18] support the concept that major functions of SL are involved in chromatophore regulation and lipid metabolism.
The insulin-like growth factors (IGFs), including IGF1 and IGF2, are polypeptide hormones. The production of IGF1 is stimulated by GH and its main action is mediated by binding to specific IGF receptors present on many cell types in virtually all tissues, especially in liver, muscle and bone [19]. In fish, IGF1 has been involved in numerous essential functions including but not limited to growth [20] metabolism [21] development [22] reproduction [23] and immunity [24]. The precise role of IGF2 in fish tissues is still under investigation, although its mRNA expression pattern has been detected in liver and in numerous other organs [25]. At present, the effect of SL on IGFs gene expression is confined to in vivo studies and still controversial. In previous studies, injection of coho salmon SL stimulated IGF gene expression [26] and over-expression SL could increase IGF1 and IGF2 mRNA levels in zebrafish embryo [27], whereas intraperitioneal injection of a single dose of SL to juvenile gilthead sea bream did not modify the circulating amount of IGF1 [28]. These findings raise the possibility that IGF gene expression may be under SL control in fish. However, no information is available regarding the biological actions of SL on IGF gene expression in fish hepatocytes.
Tilapia is the second largest species of fish farmed (after carp) worldwide with 40% produced by China [29]. Since a better understanding of IGF regulation in tilapia may have important implication in the improvement of the specie culture, the tilapia was chosen as the animal model to investigate biological functions of SL. Although, two SL subtypes, i.e., SLa and SLb, have been identified in fish, only one copy of SL (SLa) is found in the tilapia genome. In the present study, the distributions of SL transcripts were investigated in extra pituitary organs of the tilapia. Moreover, the recombinant protein and specific antiserum for tilapia SL were produced. The hepatic SL mRNA expression in response to fasting and subsequent re-feeding was also evaluated. Using primary cultures of tilapia hepatocytes as a model, the hepatic actions for SL regulation of IGF1 and IGF gene expression were investigated. Our results demonstrated for the first time that SL could serve as a novel stimulator for IGFs gene expression in tilapia hepatocytes.
Animals
Sexually mature male tilapia (Oreochromis mossambicus) (standard length: 11 ± 0.5 cm, body weight: 50 ± 5 g) were maintained in freshwater aquaria at 28°C under 10 h dark/14 h light photoperiod. The fish were fed commercial diet (40% protein, 12% fat, 2% fiber, 8.5% moisture, 8% ash, Tongwei, China) to satiety twice a day at 10:00 am and 16:00 pm. During the process of tissue sampling, the fish were sacrificed by spinosectomy after anesthesia with 0.05% MS222 (Sigma, St Louis, MO) according to the procedures approved by the Animal Ethics Committee of Sichuan University.
Extrapituitary SL gene expression in Tilapia
The extrapituitary distribution of SL was examined by using realtime PCR. Briefly, total RNA was isolated from selected tissues using RNAzol (MRC, Cincinnati, OH, USA), digested with RNase-free DNase I to remove genomic DNA contamination, and reversely transcribed using M-MLV (TaKaRa, Dalian, China). After that, real-time PCR assays were performed on the CFX96 real-time PCR Detection System (Bio- Rad Laboratories, CA, USA). PCR reaction was conducted with a SYBR Select Master Mix kit (Applied Biosystems) using the primers specific for tilapia SL (SL forward primer: 5’ CCCACTCCCTTTGCGACTT 3’ and SL reverse primer: 5’ TAGCGGTCCAGTGTCGTCT 3’). Real-time PCR for the SL was performed with initial denaturation at 94°C for 3 min followed by 35 cycles of amplification with denaturation at 94°C for 30 sec, annealing at 56°C for 30 sec, and extension at 72°C for 30 sec and then fluorescent signal collection at 80°C for 1 sec. For data calibration, serial dilutions of plasmid DNA containing the ORF of SL were used as the standards for these real-time PCR assay. As an internal control, real-time PCR for 18S rRNA was conducted using the primers specific for 18S rRNA (forward primer: 5’ GGACACGGAAAGGATTGACAG 3’ and reverse primer: 5’ GTTCGTTATCGGAATTAACCAGAC 3’). In these experiments, no significant changes were observed for 18S rRNA expression. The quantitative results were normalized as a ratio of the target gene/18S rRNA expression level.
Recombinant protein for tilapia SL
The open reading frame of the tilapia SL (GenBank Accession No: AB442015) was PCR-isolated using an Expand High Fidelity system using primers specific for tilapia SL (forward primer: 5’ CGGGATCC GTA AGC ATG CCA CTA GAC 3’ (BamHI site underlined) and reverse primer: 5’ GGAATTC TTA TGC ACA GTT GAA TTT 3’ (EcoRI site underlined). The restriction sites introduced into the respective primers were used for subsequent cloning of PCR products into the prokaryotic expression vector pET28a His-tag vector (Novagen, Madison, WI). PCR amplification of SL was initiated by denaturation at 94°C for 1 min followed by primer annealing at 55°C for 1 min and extension at 72°C for 2 min for a total of 30 cycles. After size fractionation by 1% agarose gel electrophoresis, PCR products for SL were gel-purified using a QIAquick Gel Extraction kit (Qiagen, Hilden, Germany) and subcloned into the prokaryotic expression vector pET28a His-tag vector. Sequence identity of the SL inserts was confirmed by DNA sequencing using ABI310 genetic Analyzer (BGI, Shanghai, China). The expression vector generated, namely “pET28a- SL” was introduced into E. coli. BL21 (DE3) competent cells and single colonies of transformed bacteria were used for recombinant protein production in 250 ml Luria-Bertani medium with 50 μg/ml antibiotics ampicillin at 18°C with constant shaking (220 rpm). IPTG induction (0.5 mM, Sigma-Aldrich, St. Louis, MO) was added when the OD260 reading of bacteria culture reached the level of 0.4-0.5. After incubation for appropriate duration, the bacteria with SL protein expression was harvested by centrifugation at 300 g for 20 min at 4°C and resuspended in 1x PBS (pH 8.0) for protein extraction. In this case, the cell suspension obtained was then subjected to 3 cycles of repeated freezing and thawing, followed by a 5 min sonication using a Branson Sonifier 250 (VWR Scientific, San Diego, CA). Maximal preparations of soluble protein fractions (~ 40%) can be reached after IPTG (0.5 mM) induction. Soluble and insoluble protein fractions of the cell lysate were isolated by high-speed centrifugation at 1,200 xg for 20 min at 4°C. After that, tilapia SL expressed as His-tagged recombinant protein was purified from soluble fraction by immobilized metal ion affinity chromatography using Ni-NTA Superflow™ columns (Qiagen, Hilden, Germany) according to the manufacturer’s instructions. The recombinant protein produced was quantified using a BCA protein assay kit (Pierce, Rockford, IL) and tested for bioactivity by using a pigment aggregation assay in tilapia melanophores.
Pigment aggregation assay in tilapia melanophores
Scales were collected from the dorsal fin of individual tilapia and a pigment aggregation assay for the testing of SL bioactivity was established as described previously [30]. Briefly, the scales collected were washed 3-5 times using fish physiological saline (pH: 7.4, 6.4 c g/L NaCl, 0.1 g/L KCl, 0.2 g/L CaCl2, 0.1 g/L MgSO4, 0.08 g/L NaHCO3, and 0.0 g/L NaH2PO4) to remove the mucus and then cultured in 6-well plates (Corning-Costar, Oneonta, NY) with MEM medium (Invitrogen) at 28°C under 5% CO2 and saturated humidity. After incubation with drugs treatment for 1 h, the melanophores with different levels of pigment aggregation was evaluated by cells counting under an inverted microscope (Leica, Germany) and the extent of pigment dispersion was scored as aggregated, partially dispersed, or fully dispersed according to the melanophore index (M.I.) described by Hogben [31]. Since norepinephrine (NE) could induced melanosomes aggregation in fish scales [11,12,30], parallel treatment with NE was used as a positive control for pigment aggregation.
Production of SL antisera
The recombinant protein of SL was used to raise antiserum in rabbit as described previously [32]. Briefly, after harvesting the preimmunized serum (as a negative control for antiserum), ~200 μg recombinant protein dissolved in 0.6% NaCl was mixed with Freund’s complete adjuvant and injected at multiple sites on the back and in the limbs of the rabbit. Booster injection with ~100 μg recombinant proteins mixed with Freund’s incomplete adjuvant was initiated one month later and maintained for four months with regular booster injection once every 3 weeks. After that, final bleed was collected and the specificity of the antiserum obtained was tested in tilapia pituitary and liver lysates using Western blot with and without antiserum preabsorption with the antigen.
N-glycosidase digestion assay
To examine the status of glycosylation of SL expressed in tilapia pituitary, enzymatic deglycosylation was conducted as described previously [32]. Briefly, 35 μl pituitary cell lysate was introduced into a reaction mixture containing 2.5 μl β-mercaptoethanol, 2.5 μl 10% (wt/ vol) SDS, and 10 μl 5x N-glycosidase F buffer (30 mM Na2HPO4, 20 mM EDTA, pH 7.2). After boiling for 5 min, 2.5 μl 20% (vol/vol) Triton X-100 containing 1 unit of N-glycosidase F (Calbiochem, San Diego, CA) was added. The sample was then incubated for 3 h at 37°C, sized fractionated by SDS-PAGE, and subjected to Western blotting using the antiserum for SL.
Western blot of Tilapia SL
Western blot for SL immunoreactivity was performed as described previously [30]. Briefly, tissues lysates were lysed in RIPA buffer (50 mM Tris-HCl, 150 mM NaCl, 1 mM EDTA, 1% NP-40, and 0.25% Na deoxycholate) containing with appropriate levels protease and phosphatase inhibitors (Roche Diagnostics, Mannheim, Germany). After clearing with high speed centrifugation at 4°C, these protein samples were resolved by SDS-PAGE, electroblotted onto nitrocellulose membrane, and subjected to Western blot using the antiserum for SL (1:5,000). After that, signal development was performed using ImmobilonTM Western Chemiluminescent Reagent (Millipore, Billerica, MA). For antiserum preabsorption on SL immunoreactivities, Western blot of tilapia tissues lysates were performed with SL antiserum incubated for 15-18 h at 4°C with the recombinant SL (0.1 μg/ml).
Expression patterns of hepatic SL under fasting conditions
Tilapia was distributed in twelve 70 liter tanks with 5 replicates each. The fish were allowed to acclimate to the tanks for 2 weeks prior to the beginning of the experiment as our described recently [33]. The tanks were siphoned daily, and regularly cleaned to remove algae. Fish were self-fed with a commercial diet (Tongwei, China). Ten fish, five fed and five fasted/re-fed, were periodically sampled in buckets containing 0.05% MS222 (Sigma, St Louis, MO) at days 0,7,14,21 and 28 of fasting (F0,F7,F14,F21 and F28, respectively) and days 7 of refeeding (RF7). After that, the RT samples obtained from livers were subjected to real-time PCR to determine the gene expression levels of SL. As an internal control, real-time PCR for 18S rRNA was conducted. In these experiments, no significant changes were observed for 18S rRNA expression. The quantitative results were normalized as a ratio of the target gene/18S rRNA expression level.
Primary cultures of tilapia hepatocytes
Primary cultures of tilapia hepatocytes were prepared by collagenase digestion method as our described recently [33]. Briefly, liver slices were excised from tilapia and diced into 0.4 mm fragments with a McILwain tissue chopper (Brinkmann, Mississauga, ON, Canada). After a 5 min incubation in Ca2+/Mg2+-free HBSS (HBSS medium with 4 mM NaHCO3, 10 mM HEPES and 1% antibiotics- antimycotic; pH 7.63) with 1 mM EDTA, the liver fragments were digested in Ca2+/ Mg2+-free HBSS medium with 20 mg/ml type IV collagenase (Sigma) for 30 min with constant shaking at 28°C. Hepatocytes were filtered through a nylon mesh with ~20 μm pore size to remove the undigested fragments/debris. After that, the cells were harvested by centrifugation at 5 g for 5 min and resuspended in M199 medium (Invitrogen). Total cell yield and percentage viability were estimated by cell counting in the presence of trypan blue using a hemocytometer.
IGFs gene measurement in cultured tilapia hepatocytes
Tilapia hepatocytes were seeded at a density of ~0.8 × 10⁶ cells/ ml/well in PEI (5 μg/ml) precoated 24-well culture and treated with hormones or drugs for the duration as indicated in individual experiments. After that, total RNA was isolated by using RNAzol (MRC, Cincinnati, OH, USA), digested with RNase-free DNase I to remove genomic DNA contamination, and reversely transcribed using M-MLV (TaKaRa, Dalian, China). The RT samples obtained were subjected to real-time PCR with primers specific for tilapia IGF1 (IGF1 forward primer: 5’ CAGTGCGATGTGCTGTATCTCCT 3’ and IGF1 reverse primer: 5’ TCTTGGGAGTCTTGACAGGTGC 3’) and IGF2 (IGF2 forward primer: 5’ ACCCGTGGGATCGTAGAG 3’ and IGF2 reverse primer: 5’ GGGCATCACCGGTAT GAC 3’). Real-time PCR for the IGFs were performed with initial denaturation at 94°C for 3 min followed by 35 cycles of amplification with denaturation at 94°C for 30 sec, annealing at 62°C for 30 sec, and extension at 72°C for 30 sec and then fluorescent signal collection at 80°C for 1 sec. For data calibration, serial dilutions of plasmid DNA containing the ORFs of IGF1 and IGF2 were used as the standards for these real-time PCR assay. As an internal control, real-time PCR for 18S was also conducted in each experiment. The quantitative results were normalized as a ratio of the target gene/18S rRNA expression level.
Data transformation and statistics
For fasting experiments, data presented (as means ± SEM, N=5) were analyzed using two-way ANOVA with Bonferroni posttest to examine the effects of the time and treatment on SL gene expression in liver. For real-time PCR of IGFs and SL transcripts, standard curves were constructed with serial dilutions of plasmids carrying the ORF of the respective gene targets. After linear regression of CT values, standard curves with a dynamic range of 105 and correlation coefficient of ≥ 0.95 were used for data calibration with Bio-rad CFX 3.0 software. The raw data for the respective gene targets were quantified in terms of femtomole transcript detected per million cells. Since no significant changes were observed for 18S rRNA expression, the quantitative results were normalized as a ratio of the target gene/18S rRNA expression level and transformed as a percentage of the mean value in the control group without treatment (referred to as “%Ctrl”). For each batch of experiments, hepatocytes were prepared from 4 individual fish. All of the experiments were performed at least twice. Data presented (as means ± SEM) were analyzed using ANOVA followed by Duncan’s test. Differences between groups were considered as significant at P<0.05.
Extrapituitary SL gene expression in Tilapia
To characterize the extrapituitary expression profiles of SL, realtime PCR was performed in RNA samples prepared from selected tissues. The expression pattern of SL was ubiquitously detected in various tissues. The relatively high level of SL expression was detected in liver, to a lower extent in fat, kidney, muscle, spleen and stomach, and with the lowest level in heart (Figure 1).
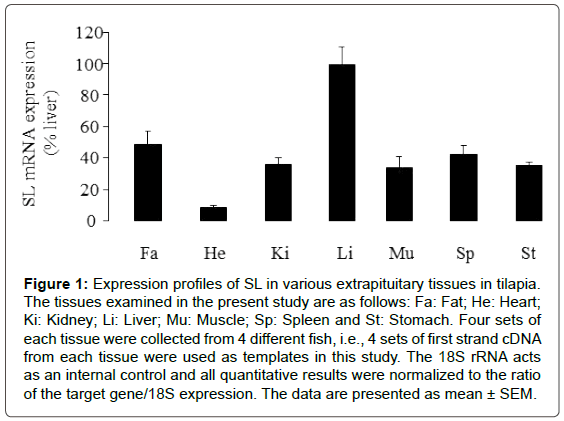
Figure 1: Expression profiles of SL in various extrapituitary tissues in tilapia. The tissues examined in the present study are as follows: Fa: Fat; He: Heart; Ki: Kidney; Li: Liver; Mu: Muscle; Sp: Spleen and St: Stomach. Four sets of each tissue were collected from 4 different fish, i.e., 4 sets of first strand cDNA from each tissue were used as templates in this study. The 18S rRNA acts as an internal control and all quantitative results were normalized to the ratio of the target gene/18S expression. The data are presented as mean ± SEM.
Production of recombinant Tilapia SL
To produce recombinant protein for tilapia SL, E. coli. BL21 (DE3) cells were transformed with pET28a-SL. As shown in (Figure 2A) target proteins for 30 kDa for SL were detected both in soluble and insoluble of fractions after IPTG induction. In subsequent studies, only the soluble fraction was used for protein purification using immobilized metal ion affinity chromatography. The 6x His fusion protein of SL in the soluble fraction of bacterial lysate was trapped with Ni-NAT columns and contaminating proteins of bacterial origin were removed by repeated washing. As revealed by Coomassie Blue staining, the final product of SL purified from the Ni-NTA columns was at high quality purity (>90%) without noticeable levels of contaminating proteins. These protein bands could also be detected by 6x His-tag antibody (Figure 2B), confirming that they are the 6x His-tag recombinant fusion protein of tilapia SL.
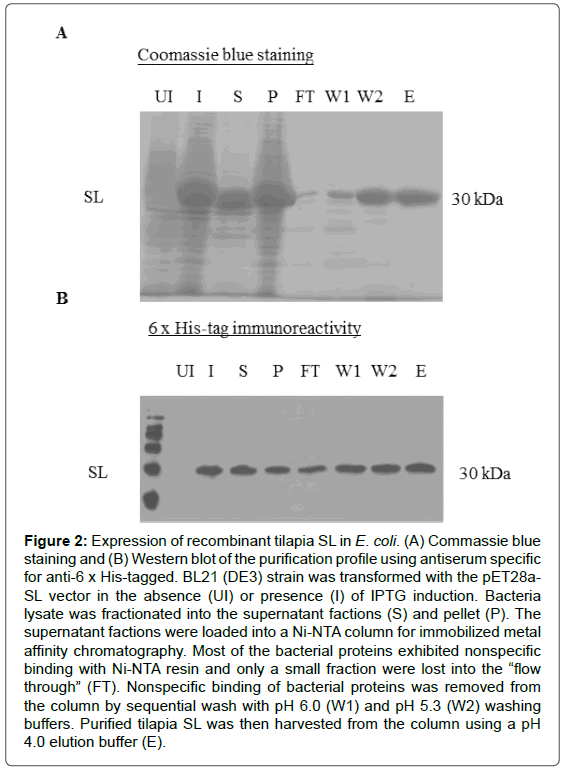
Figure 2: Expression of recombinant tilapia SL in E. coli. (A) Commassie blue staining and (B) Western blot of the purification profile using antiserum specific for anti-6 x His-tagged. BL21 (DE3) strain was transformed with the pET28a-SL vector in the absence (UI) or presence (I) of IPTG induction. Bacteria lysate was fractionated into the supernatant factions (S) and pellet (P). The supernatant factions were loaded into a Ni-NTA column for immobilized metal affinity chromatography. Most of the bacterial proteins exhibited nonspecific binding with Ni-NTA resin and only a small fraction were lost into the “flow through” (FT). Nonspecific binding of bacterial proteins was removed from the column by sequential wash with pH 6.0 (W1) and pH 5.3 (W2) washing buffers. Purified tilapia SL was then harvested from the column using a pH 4.0 elution buffer (E).
Melanophore aggregating response to recombinant SL
To test the bioactivity of recombinant SL, the effect of SL on melanophore aggregation was examined. Using the melanophore index to evaluate the extent of pigment dispersion, melanophores of scales were aggregated within 1 h of incubation with 1 μM SL treatment (Figure 3A). To further evaluate the dose-response effects of SL on melanophore aggregation, a dose-dependent study was also performed with the recombinant protein of tilapia SL. As shown in Figure 3B, tilapia SL was effective in increasing the melanophores aggregation in a concentration-related fashion. Parallel treatment with NE (1 μM) was used as a positive control in these experiments.
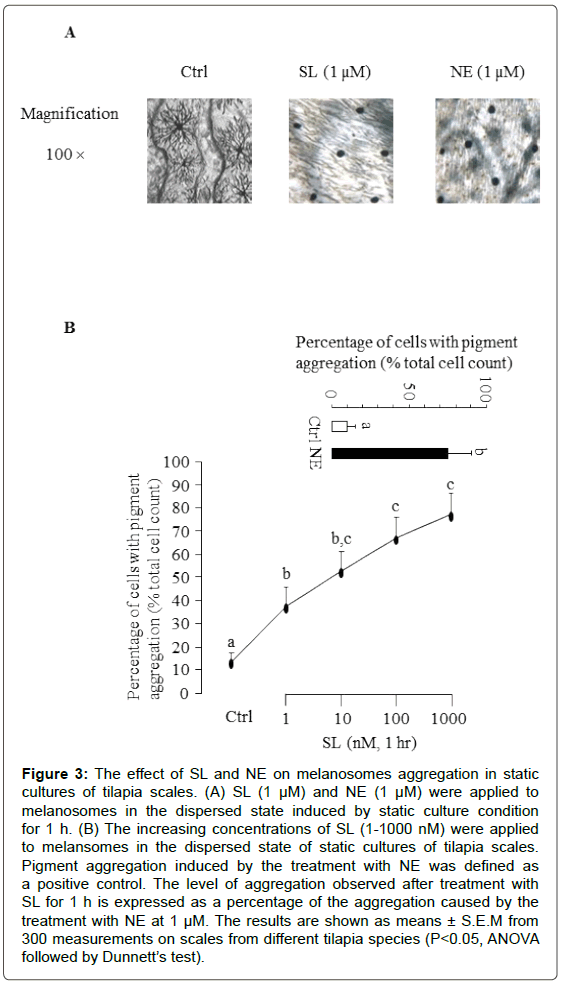
Figure 3: The effect of SL and NE on melanosomes aggregation in static cultures of tilapia scales. (A) SL (1 μM) and NE (1 μM) were applied to melanosomes in the dispersed state induced by static culture condition for 1 h. (B) The increasing concentrations of SL (1-1000 nM) were applied to melansomes in the dispersed state of static cultures of tilapia scales. Pigment aggregation induced by the treatment with NE was defined as a positive control. The level of aggregation observed after treatment with SL for 1 h is expressed as a percentage of the aggregation caused by the treatment with NE at 1 μM. The results are shown as means ± S.E.M from 300 measurements on scales from different tilapia species (P<0.05, ANOVA followed by Dunnett’s test).
SL immunoreactivities in Tilapia liver and pituitary lysates
To test the specificity of the newly raised antiserum, Western blot of tilapia liver and pituitary lysates was performed with the antiserum raised against SL. In this case, two protein bands with the size of 29 kDa and 27 kDa were detected in tilapia pituitary and liver lysates. As a positive control, the recombinant protein of tilapia SL (a single protein band of 30 kD in size) could be detected by SL antiserum (Figure 4A). In parallel studies, the specific signals for SL (29 kDa and 27 kDa) detected in liver and pituitary lysates could be totally abolished by preabsorption of SL antisera (1:5,000) with the SL recombinant proteins (0.1 mg/ml; Figure 4B). To further evaluate the glycosylation status of native SL, N-glycosidase digestion was performed using pituitary lysate. After N-glycosidase F digestion (1 Unit/50 μl), the 29 kD protein band for SL was obliterated with simultaneous rise in the signal intensity of the 27 kD band for SL (Figure 4C).
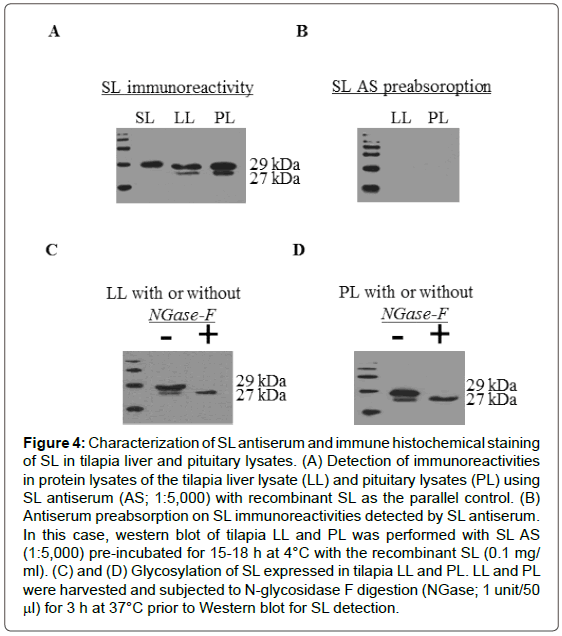
Figure 4: Characterization of SL antiserum and immune histochemical staining of SL in tilapia liver and pituitary lysates. (A) Detection of immunoreactivities in protein lysates of the tilapia liver lysate (LL) and pituitary lysates (PL) using SL antiserum (AS; 1:5,000) with recombinant SL as the parallel control. (B) Antiserum preabsorption on SL immunoreactivities detected by SL antiserum. In this case, western blot of tilapia LL and PL was performed with SL AS (1:5,000) pre-incubated for 15-18 h at 4°C with the recombinant SL (0.1 mg/ml). (C) and (D) Glycosylation of SL expressed in tilapia LL and PL. LL and PL were harvested and subjected to N-lycosidase F digestion (NGase; 1 unit/50 μl) for 3 h at 37°C prior to Western blot for SL detection.
Effects of long-term fasting on hepatic SL gene expression
To assess the effects of prolonged fasting and subsequent refeeding on SL gene expression in liver, the hepatic transcription profiles of SL were investigated by using real-time PCR. As shown in Figure 5, significantly increased expression levels of SL transcripts were observed in liver of fasted Tilapia at days 7, 14, 21 and 28 compared with the normally fed animals. Following re-feeding for 7 days, the SL expression level in liver returned to the continuously-fed control.
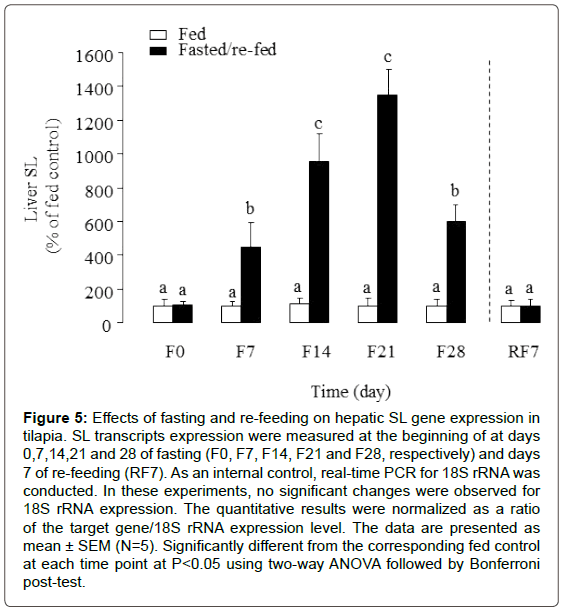
Figure 5: Effects of fasting and re-feeding on hepatic SL gene expression in tilapia. SL transcripts expression were measured at the beginning of at days 0,7,14,21 and 28 of fasting (F0, F7, F14, F21 and F28, respectively) and days 7 of re-feeding (RF7). As an internal control, real-time PCR for 18S rRNA was conducted. In these experiments, no significant changes were observed for 18S rRNA expression. The quantitative results were normalized as a ratio of the target gene/18S rRNA expression level. The data are presented as mean ± SEM (N=5). Significantly different from the corresponding fed control at each time point at P<0.05 using two-way ANOVA followed by Bonferroni post-test.
SL induction of IGF1 and IGF gene expression in tilapia hepatocytes
To elucidate for the direct actions of exogenous SL on IGFs gene expression in tilapia hepatocytes, we performed time-course studies of the effects of SL on IGF1 and IGF gene expression. Of note, significant increases in IGF1 and IGF gene expression were observed with 12 h and 24 h time points after the addition of 100 nM tilapia SL (Figure 6A). By fixing duration of drug treatment at 24 h, dosedependent experiments were also performed by exposing hepatocytes to increasing concentrations of tilapia SL (1-1000 nM). In this case, tilapia SL treatment was effective in increasing IGF1 and IGF gene expression levels in a dose-dependent manner. The minimal effective doses for SL induction of IGFs gene expression were found to be at 10 nM does range while maximal responses observed in the 100 nM dose (Figure 6B). To further confirm if endogenous SL was involved in IGFs expression, immunoneutralization was performed in hepatocytes for 24 h with increasing levels of antiserum raised against tilapia SL. In this case, tilapia SL antiserum resulted in a dose-dependent decrease in IGF1 and IGF gene expression (Figure 6C). The significant decrease in IGF1 and IGF gene expression were noted at 1:5,000 by SL antiserum, respectively. In this study, treatment with pre-immune serum (PS, 1:2,500) was not effective in altering IGFs gene expression, suggesting that the effect of SL antiserum was not due to the non-specific action of serum treatment.
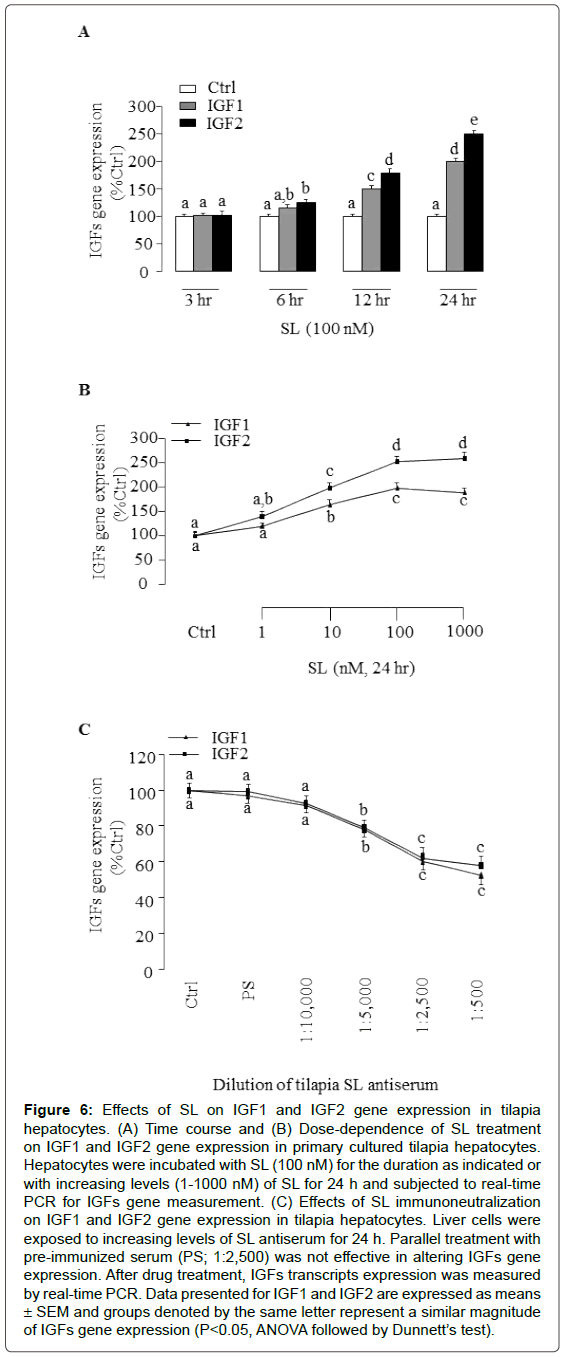
Figure 6: Effects of SL on IGF1 and IGF2 gene expression in tilapia hepatocytes. (A) Time course and (B) Dose-dependence of SL treatment on IGF1 and IGF2 gene expression in primary cultured tilapia hepatocytes. Hepatocytes were incubated with SL (100 nM) for the duration as indicated or with increasing levels (1-1000 nM) of SL for 24 h and subjected to real-time PCR for IGFs gene measurement. (C) Effects of SL immunoneutralization on IGF1 and IGF2 gene expression in tilapia hepatocytes. Liver cells were exposed to increasing levels of SL antiserum for 24 h. Parallel treatment with pre-immunized serum (PS; 1:2,500) was not effective in altering IGFs gene expression. After drug treatment, IGFs transcripts expression was measured by real-time PCR. Data presented for IGF1 and IGF2 are expressed as means ± SEM and groups denoted by the same letter represent a similar magnitude of IGFs gene expression (P<0.05, ANOVA followed by Dunnett’s test).
Although SL is a pituitary hormone unique to fish models, SL transcripts have been detected in extrapituitary tissues, e.g., in liver of tilapia observed in our present study, grass carp [34] and goldfish [35] and SL receptor was most highly expressed in liver of Tilapia [36] and Salmon [37]. These findings raise the possibility that SL may act locally as an autocrine/paracrine regulator in liver. To test our hypothesis, recombinant protein for Tilapia SL was produced in E. coli and purified to almost homogeneity by immobilized metal ion affinity chromatography. A previous study demonstrated that native red drum SL protein could cause melanosome aggregation both in vivo and in vitro [11]. Recently, recombinant zebrafish SL induced melanosome aggregation in a concentration-dependent manner in skin of zebrafish scales [12]. In our present studies, recombinant tilapia SL protein could elicit melanosome aggregation at a low concentration of 1 nM, which is also in good correlation with our previous studies where similar concentration of carp SL could be effective in stimulating mealnosome aggregation [30]. Using recombinant protein of tilapia SL, specific polyclonal antiserum against the recombinant SL was developed. This antiserum appeared to be highly specific as
• Specific proteins with appropriate size for SL could be detected by Western blot of pituitary and liver lysates, and
• The immunostaining signals could be abolished by preabsorption of the antiserum with the recombinant protein for tilapia SL.
In fish models, both glycosylated and non-gylcosylated forms of SL have been reported, but the abundance of glycosylated SL form varied from different fish species (e.g., a major form in cod [38] and Cichlasoma dimerus [39]; a minor form in grass carp [30] and sole [2]). In our studies with tilapia pituitary and liver lysate, only the 29 kDa SL but not the 27 kDa SL was sensitive to N-glycosidase F digestion. Given that the signal intensity of 29 kDa SL protein band was much stronger than that of the 27 kDa SL band in lysates, it is conceivable that the glycosylated SL may be the major form of SL in tilapia.
In fish, liver is one of the main sites of lipid storage [40]. In the initial stage of fasting, lipids in liver are rapidly decomposed for energy in tilapia [41]. There is some evidence for the involvement of SL in the regulation of energy homeostasis in fish species. Plasma SL levels are down-regulated in response to dietary amino acid profile and dietary protein source in gilthead sea bream [42]. More directly causal links from genetic evidence, the SL-deficient mutant of medaka showed that both triglycerides and cholesterol were significantly higher in liver than that of the wild type [16]. These observations indicated that SL could suppress lipid accumulation in organs. Since the SL transcripts can be detected in liver of Tilapia, these findings promote us to investigate the effect of long-term fasting and re-feeding on hepatic SL mRNA expression. In our current study, fasting for 4 weeks produced significant elevation in hepatic SL transcripts, whereas the hepatic SL expression levels returned to the continuously-fed controls following re-feeding. The increased hepatic SL expression in response to fasting strongly indicates that SL is involved in certain aspects of energy homeostasis. It is worth mentioning that SL transcripts in response to fasting status change might be tissue- and species-specific. In tilapia, pituitary SL transcripts were significantly reduced during 4 weeks fasting [43], whereas pituitary SL mRNA levels were unaffected by either fasting or re-feeding in rabbitfish [44].
In fish, GH effects are generally thought to be indirect through GH stimulation of hepatic IGFs expression. In our present study, we postulate that SL, a family member of the GH/PRL lineage, may retain properties of GH to control IGF gene expression in hepatocytes. This idea is supported by our present studies in which treatment of tilapia SL could time- and dose-dependently stimulate IGF1 and IGF gene expression in tilapia hepatocytes. In contrast, removal of endogenous SL by immunoneutralization could reduce IGF1 and IGF2 transcripts in a dose-dependent manner, suggesting that local production of SL is required to maintain basal level of IGFs gene transcription in tilapia hepatocytes. IGFs have been found to be expressed in teleosts in a wide range of tissues throughout life, which suggests that the autocrine/ paracrine role of IGFs may be of particular physiological importance in bony fish [45-47]. Liver-derived SL may act on a broad array of physiological functions such as development, growth and metabolism to some extent as GH does through IGF signaling in tilapia.
In summary, SL transcripts were detected in various extrapituitary tissues. The recombinant protein of tilapia SL with bioactivity in inducing pigment aggregation in tilapia melanophores has been produced. Using this recombinant protein, the antiserum for SL was produced and its specificity was confirmed by antiserum preabsorption. Fasting for 4 weeks resulted in an increase SL gene expression in liver, whereas hepatic SL transcripts were restored after 7 days of re-feeding. Using primary cultures of tilapia hepatocytes, we have demonstrated for the first time that IGF1 and IGF gene expression could be elevated by treatment with exogenous tilapia SL. Consistent with these results, removal of endogenously SL by immunoneutralization resulted in a significant inhibition of IGF1 and IGF gene expression. Further study is warranted to elucidate whether increased hepatic IGFs output could further regulate SL production at the tilapia pituitary level.
The project was supported by grants from the National Natural Science Foundation of China (31302165). We are grateful to Dr. Yajun Wang (Sichuan University) for providing technical assistance.