Journal of Chromatography & Separation Techniques
Open Access
ISSN: 2157-7064
ISSN: 2157-7064
Review Article - (2017) Volume 8, Issue 3
In this paper, the fundamental concepts of stoichiography is presented which open up a new area to determine chemical composition, phase, molecular and ionic, of complicated mixtures of polyelement and polyphase inorganic substances. Doing it, there is no need to use standards of individual compounds and to get selective separation. At the same time, a high possibility occurs to determine quantitatively chemical composition of the mixture occurs. The general principles of two stoichiographic methods are set out: differential dissolution dedicated to analyze mixtures of solid inorganic compounds; ionic chromato-stoichiography to analyze composition of water solutions. Some examples are given concerning applications of the methods to analysis of heterogeneous and homogeneous catalysts.
Keywords: Catalysis; Heterogeneous catalysts; Homogeneous catalysts; Stoichiography; Stoichiographic Differential dissolution method; Ion chromatostoichiography
Catalysis is among the most knowledge-intensive and promising fields of science, catalytic technologies are employed in various industries. Such technologies are used in oil refining and petrochemistry, in the production of semiproducts and monomers for main and fine organic synthesis; in the synthesis of polymeric materials and production of bulky chemical products and fertilizers, in pharmaceutical industry for manufacturing drugs, vitamins, plant protectants and other biologically active substances. In modern industry, ~70% of chemical processes are based on catalysis. At the chemical plants that were put into operation in recent years, catalysis underlies ~90% of chemical processes. In highly industrialized countries, up to 30-35% of gross national product is obtained with the aid of catalysis and catalytic technologies [1].
The nature of catalytic systems has two essential features determining the choice of methods for their investigation. The majority of catalysts are inorganic substances that generally comprise almost all chemical elements of the Periodic Table- in different combinations and quantitative ratios. On the other hand, the initial, intermediate and final products of catalytic processes are represented mostly by various mixtures of different organic compounds. An important feature of all these substances is that their chemical composition often remains unknown. So, such steps of investigation as the detection and identification of components of catalytic systems is a routine work for specialists, both chemists and physicists.
Advances in this area of science and practice are related mostly to the application of modern physicochemical methods, the total number of which reaches some tens, including their variants [2]. This review presents and discusses new principles of stoichiography and stoichiographic methods for separation and determination of the composition and structure of complex multielement multiphase objects in catalysis. Such methods differ from conventional ones: being “reference-free” and not requiring selective separation of components of solid and liquid mixtures of substances, they can rapidly find solutions for the problems related to investigation of such objects, which were earlier considered as irresolvable.
Chemical composition
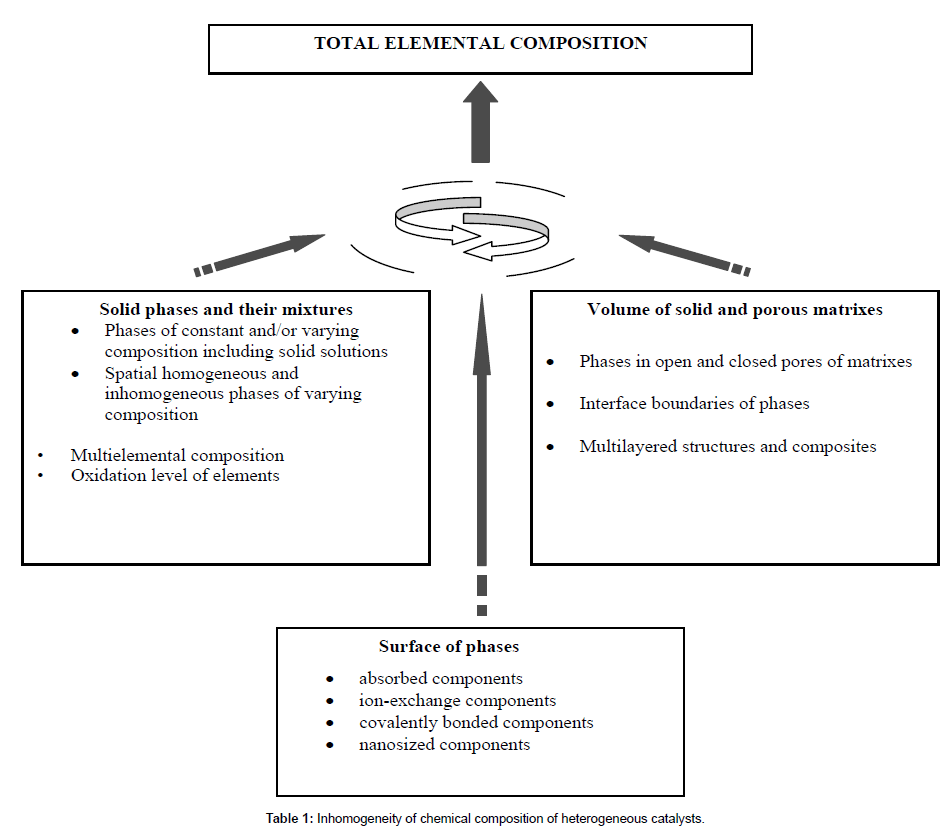
Chemical composition is the first and most important characteristic of any catalyst. The composition of catalysts determines their main properties – catalytic activity and selectivity as well as chemical, thermal and mechanical stability during their synthesis and operation. However, until now the chemical analysis of catalysts was reduced to determination of their gross elemental composition. But it is absolutely insufficient! Such substances may have a similar elemental composition but often exhibit different catalytic and other functional properties. Only two causes can be responsible for this: the difference in the composition of compounds of the corresponding elements and/ or the difference in the spatial structure of these compounds, both the atomic (crystal or amorphous) and nano- or macrostructure. Of prime importance becomes the determination of the surface composition of solid phases in catalysts at the atomic level and with due regard to the distribution of these phases and their components on the surface and in the pore structure of solid supports, Table 1. However, the potential of advanced analytical methods is often insufficient for solving such problems. The discovery of stoichiography and the development of stoichiographic method of differential-separating-issolution (DD) have strongly improved the situation in this field.
Here, attention should be drawn to the dissolution of solid substances. It is an uncontested fact that the flow of products of the dissolution process, which starts from the surface of solids and then passes into their bulk, contains all information about chemical composition of the solid substances. Such a solution flow resembles the flow of ions from an ion source of a mass spectrometer or the flow of a mobile phase with substances to be separated in a chromatographic column. Information on the composition is contained exactly in the flow. When the flow is stopped or homogenized, the information passes out. This important and meaningful conclusion, which was first formulated in our works [3,4], allows considering dissolution processes in the context of radically new ideas. However,s the first question is how to extract information on the chemical (phase, surface, etc.) composition of a dissolving substance from its flow, taking into account that this versatile and complex information changes in the course of dissolution, Table 1. The development of new principles of stoichiography and stoichiographic methods made it possible to answer this question. In 1986, a new method of phase analysis has been devised-the stoichiographic method of differential dissolution [5], and later the ion chromatostoichiography (ICS) [6].
Stoichiography
The concept of stoichiography is a system of new ideas on the stoichiometry of non-steady-state hetero- and homophase mass transfer processes. Stoichiography (and stoichiographic methods) resulted from a long search for new efficient ways of solving a general problem of chemistry - how to determine the composition of mixtures containing unknown chemical compounds [7-9]. This problem does not exist in elemental analysis: all stable elements have already been discovered, their total number is relatively small, and methods for determining each element in the presence of other elements are known. On the contrary, chemical compounds are uncountable, and most of them are still undiscovered.
The problem of chemical analysis is most topical for the mixtures of inorganic solids. Physical diffraction and spectroscopic methods prevail here: XRD, IR, Raman spectroscopy, NGR, NMR, and electron microscopy. Chemical methods of phase analysis play only a minor part now.
The essence of chemical stoichiographic methods is the combination of mixture separation processes (chromatography, electromigration, dissolution, extraction, etc.) and determination of the time-varying stoichiometry of elemental composition of the substance flow being separated. Stoichiographic methods are distinguished from all known chemical and physical methods of analysis by their ability to perform molecular analysis without reference samples of chemical compounds. This unique and fundamental feature is based on specific calibration procedure: measuring instruments are calibrated against standard samples of the elements constituting the analyte, whereas reference samples of the compounds are not used. However, results of analysis are presented as the stoichiometric formulas of compounds being identified and as the quantitative data on their content in the objects under consideration. This refers also to earlier unknown chemical compounds that are discovered for the first time.
To formulate the stoichiography postulates, it was necessary to introduce some new terms (italicized), which are defined in the text.
The idea and principles of stoichiography and stoichiographic methods are of the utmost simplicity. This can be illustrated by a chromatographic example. Figure 1a shows a model chromatogram for a mixture of two compounds, АВ2С3 and D2E3, which can be obtained using a conventional chromatographic detector. Such detectors record the appearance of chemical compounds in chromatograms as isolated peaks. Figure 1b shows a chromatogram of the same mixture, but recording was performed with the use of so-called absolute detector [7], which records all chemical elements of the Mendeleev’s Periodic Table in a mobile phase flow. Unfortunately, such a detector has not been developed as yet, but advanced ICP spectrometer can perform most of the necessary functions. Thus, the ICP AES analyzer detector was used to develop a new method of ionic chromatostoichiography [6].

Figure 1a: Model chromatogram of a mixture of two (unknown) compounds; conventional detector.

Figure 1b: Chromatogram of elements A, B and C of this mixture, absolute detector.
The intensity of analytical signals recorded by absolute detector should be expressed in moles. In this case, the molar ratios of every two elements at each point of their separated peaks will be equal to coefficients that relate these elements in the simplest stoichiometric formulas of the compounds being separated. This allows finding such formulas immediately. In our example, these will be АВ2С3 and D2E3, Figure 1c. At the same time, the total peak area of the elements corresponds to the content of each compound in the analyte sample. Thus, stoichiographic methods provide simultaneous detection, identification and quantitative determination of chemical compounds by their primary feature- the stoichiometry of elemental composition. Note that preparative isolation of these compounds in pure form is not necessary here.

Figure 1c: Chromatogram of a mixture.
Stoichiographic differential dissolution method
For a long time, there was no method similar to chromatography for separation of solid phase mixtures. Such a method has been developed in 1986 and called (as an alternative to selective dissolution) the differential dissolution (DD) method [5,10]. The DD method is based on two physicochemical regularities that determine (1) the course of consecutive passing of individual phases from their mixtures to the solution in a specially created dynamic dissolution regime and (2) the changes in the dissolution stoichiometry during these processes.
Dynamic dissolution regime
For the chemical reaction A+R=P, a dynamic regime of reaction occurrence is possible at which the concentration of component R taken in a large excess increase with time, although R is partially spent upon interaction with A. To provide such dissolution regime of complex solid, the concentration of solvent, for example a strong acid, should be increased intentionally during the process.
The essence of the dynamic regime consists in increasing the chemical potential μ with an increase in the concentration of active components of the solvent - protons, reductants or oxidants. Under such non-stationary dynamic conditions, various solid phases successively pass into solution when μ values corresponding to each phase are attained. This effect resembles voltammetry, first of all the stripping voltammetry. Respectively, the dynamic kinetic curves for dissolution of multiphase solid substances have the form of well-known voltammetric dependences. No works analyzing the dynamic regime from this point of view were found in the chemical literature.
This may be explained by a seeming uselessness of such regime: why to increase the concentration of reactant which already has a large excess in the system? However, a large excess of solvent increases the chemical potential in the dynamic regime of differential dissolution, when a negligible part of the solvent is spent for dissolution of solid phases.
There are many reasons why it is impossible now to measure changes in the chemical potential of the solvent components in DD processes.
The main thing is unclear - how and with respect to potential of which system such measurements should be made. This is why researchers have to record the dynamic kinetic DD dependences in the coordinates “time – concentration of elements passing into solution”.
Solid phases are destroyed upon dissolution; so, it is possible that dissolution rate is recorded not for the entire phase, but only for the constituting elements or some fragments. A problem arises of reconstructing the kinetic curves of element dissolution into kinetic curves of phase dissolution. To solve this problem, the notion of dissolution stoichiometry of solids was introduced [10].
The dissolution stoichiometry S is characterized by a family of stoichiometric (molar) ratios, where elements at each time point pass from a solid substance into solution; i.e., S is equal to the dissolution rate ratio of the element. It seems reasonable to transform the differential kinetic curves of elements’ dissolution into the time functions of molar ratios of dissolution rates for each two elements of the substance under analysis, S(t). Such functions are called stoichiograms. Their total number is equal to the number of pair combinations of elements constituting the substance. An essential feature of stoichiograms is that upon dissolution of individual phases of a constant composition, the stoichiograms retain constant values equal to stoichiometric coefficients relating the respective two elements in each individual phase.
It is known that the dissolution rate of each individual phase is determined, on one hand, by its chemical nature and real structure, i.e., by the crystal structure (defects taken into account) and dispersity - linear dimensions of solid particles, their pore structure, and specific surface area, which determine, in particular, the area of reacting surface. On the other hand, the dissolution rate of solids depends on the chemical composition and concentration of solvents, on the temperature and hydrodynamic conditions of dissolution. Of principal importance is that the dissolution stoichiometry of individual phases of constant or variable composition is invariant to changes in all these characteristics and parameters (the invariance principle of dissolution stoichiometry). The dissolution stoichiometry of a NaCl sample with any real structure remains equal to a constant molar ratio Na: Cl=1 over the entire period of dissolution in any solvent under any constant or time-varying conditions. Principles for determination of phases with a variable composition are reported elsewhere [9].
In general, the invariance principle of dissolution stoichiometry is trivial, because stoichiometry of a phase with constant composition is independent of the amount of this phase and conditions of its existence. However, the application of this principle to analysis of phase mixtures has important and unexpected consequences. First, this opens a way to broad variation of the dynamic regime parameters when searching for conditions of successive phase dissolution; second, a degree of phase separation upon dissolution can be fixed unambiguously. This is reflected by the time profile of stoichiograms rather than by kinetic curves of element dissolution. The regularities that determine the form of S(t) functions make it possible to perform phase analysis without reference samples of the phases. Such regularities were revealed at mathematical modeling of DD processes and verified by many experiments. The theory, methodology, and instrumentation of the DD method were reported in numerous publications and a review [10]; a brief overview is presented below.
For a mixture of phases with constant composition, the time profile of stoichiograms is determined by two main regularities.
1. During the dissolution of individual multielement phases with a constant composition, molar ratios of each two elements of these phases, Si, retain the time-constant values equal to stoichiometric coefficients ci, which relate these elements in empirical formulas of phases, i.e., Si(t)=ci.
2. During the simultaneous dissolution of two or more multielement phases, molar ratios of each two elements entering the composition of only one phase of the mixture, Si, retain the timeconstant values equal to stoichiometric coefficients ci, which relate these elements in empirical formulas of the corresponding phases, whereas all other molar ratios Sj are time-varying, i.e., Si(t)=ci=const and Sj(t) ≠ const.
These regularities were revealed by mathematical modeling of the DD processes and verified in numerous experiments [10]. Figure 2 illustrates the model of a two-phase mixture dissolution in the dynamic DD regime.

Figure 2a: Kinetic curves of A, B, C elements dissolution and stoichiogram. The C:A, B:A, C:B ratios are constant during single-phase dissolution and variable during dissolution of two or several phases.

Figure 2b: Reconstructed from the kinetic curves (А) of AC1.5 and AB2C3 phases dissolution. The ranges of the single-phase dissolution and dissolution of two phases are shown.
The dissolution of solid substances in a great excess of solvent under the flow dynamic regime creates conditions in the “solid phase - solvent” system that are far from equilibrium. Most of DD processes are irreversible, because the chemical interaction products rather than initial solid substances pass into solution. Note also that dissolution of solids is the consequence of rapidly running coupled elementary reactions between solvent components and unit cell atoms of the solid phase, which lead to its complete destruction. As a result of such macroprocess, all unit cell atoms pass into solution to provide electroneutrality of the solid phase residue that has not been dissolved yet. This is why the stoichiometric ratios of elements in the resulting solution are equal to their ratios in the initial solid phase. It should be noted that the condition of simultaneous dissolution of the solid phase components underlies the concept of the solubility product for difficultly soluble substances. It is a general rule that conjugated bond cleavage in the reacting substances is more advantageous for thermodynamically allowed reactions. Such a mechanism provides compensation for the energy required for cleavage of the existing bonds between atoms by the energy released at the formation of new bonds [7]. Processes of incongruent dissolution, for example in the case of layered structure crystals, can be an exception. Such processes are similar to the ion exchange processes and are observed quite rarely in the practice of DD analysis. Changes in the DD conditions make it possible to transform incongruent processes into congruent ones [6].
Non-steady-state nature of hetero- and homophase transfer processes is the mandatory condition for stoichiographic methods. Steady-state processes are characterized by invariable mass transfer rate. Thus, when mixtures are transferred instead of individual compounds, the stoichiograms will also be constant but not reflecting the stoichiometry of chemical compounds. For DD analysis, it is essential that the non-steady-state criterion is satisfied and manifested in all analytical signals as peaks: on chromatograms, voltammetric and electromigration curves, mass spectrometric patterns and other dependences. Such form of the signals indicates that mass transfer in analytical systems occurs at a variable rate.
Experimental procedure
When phase composition of a substance is unknown, it is natural that all parameters determining the dissolution rate of each constituting phase are also unknown. During the dissolution, it is possible to specify and control the composition and concentration of solvents, the temperature, and to some extent the hydrodynamic conditions [11]. However, the dissolution kinetics of a substance under analysis cannot be described a priori, since there are no data on the reacting surface area of individual phases and its changes during the dissolution, on the rate constants, order of the reactions, and activation energy for dissolution of each phase of the mixture. Besides, these and other parameters can change in the dynamic regime. However, when choosing the conditions of successive phase dissolution, it is not necessary to know these characteristics and parameters, since separation conditions for each sample can be found quite easily in experiments from the shape of stoichiograms.
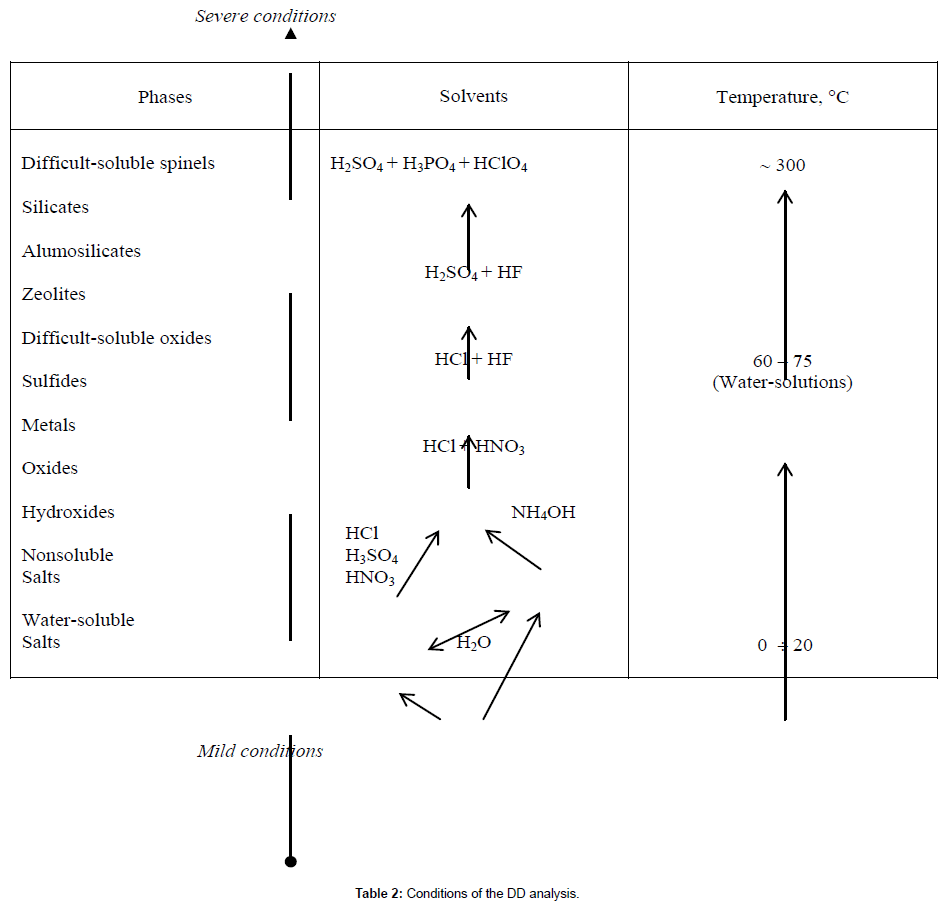
The composition of differentiating solvents, starting from water, is usually arranged in the following order: NaOН ← NH4OH ← H2O → HCl, HNO3, H2SO4 → (HCl+HNO3) → (HCl+HF) → (H2SO4+HF) → (H2SO4+H3PO4+HClO4). This simple series of solvents allows analyzing various substances of different nature, Table 2.
Stoichiograph
Efficiency of the DD method is related to the use of precise and highly sensitive multielement methods of elemental analysis, which are computerized because the number of elementary computing operations exceeds 106 for DD analysis of a substance comprising, e.g., 5 elements. About 25 years ago, a device that strongly enhanced the possibilities of DD method was devised at the Boreskov Institute of Catalysis SB RAS, Novosibirsk. This device, called stoichiograph, successfully operates until now [10].
A scheme of the stoichiograph, Figure 3a, includes vessels 1 and 2 with the solvent components (for example, water and a concentrated solution of HCl), peristaltic pumps 4 and 5 delivering the solvent components through capillaries to mixer 6 at different rates, and electronic device 3 controlling flow rates of the solvent components by a preset program and providing a joint solvent flow from mixer 6 to reactor 7 with a constant volumetric rate (~2 mL min-1) and progressively increasing concentration of the solvent. A sample is dissolved in the reactor, and the resulting solution goes directly to analyzer detector 8 - an inductively coupled plasma atomic emission spectrometer (ICP AES). Operation of the entire system is controlled by a computer.

Figure 3a: Scheme of the stoichiograph.
A microprocessor electronic device for controlling the solvent flow rate is incorporated into the casing of a pump. This device is used to program the pumping of solvents to the mixer with a decreasing rate from one vessel and with an increasing rate from another one given that the volumetric flow rate of solvent from mixer is constant. The ICP AES analyzer detector allows simultaneous determination of the majority of elements in the resulting solution with periodicity of ≥ 1 s. Recording of kinetic dissolution curves is actually continuous, which makes it possible to reveal fine effects during the process. A software package was developed to control the course of differential dissolution and make necessary calculations.
As seen from Figure 3b, design of a stoichiograph formally resembles the classical design of the J. Heyrovský polarograph (the 1959 Nobel Prize). In the stoichiograph, the vessels with the solvent components correspond to the voltage source of a polarograph, an electronic device controlling the solvent composition - to rheochord, reactor- to electrolytic cell, and ICP AES- to galvanometer. However, in distinction to the polarograph that records a single voltammetric dependence, the stoichiograph records the “current” of all elements of the substance being dissolved, which are determined by the analyzer detector. The fundamental distinction between these analytical systems is that electron flux used in voltammetry is replaced in stoichiograph by the flows of protons, reducing or oxidizing reactants, which allows not only redox, but also the acid-base reactions to be involved in the dissolution process. Accordingly, stoichiography provides a much greater body of data and more significant information as compared to voltammetric analysis. Figure 3c displays a photo of the first lab-scale stoichiograph.

Figure 3b: Schemes of the polarograph and stoichiograph.

Figure 3c: The first lab-scale stoichiograph.
Stoichiographic titration
Optimal parameters for dissolution of particular objects can be chosen only empirically, because data necessary for preliminary calculations are usually lacking. A key role in selection of DD conditions was played by stoichiographic titration. This method can form parameters of dynamic regime corresponding to a real structure of each phase being separated and, which is most important, makes it in situ - on a real-time basis, directly in the DD process. The titration process matches the rates of changes in dynamic regime parameters with the observed dissolution rates of elements constituting the analyzed substance. At that, one should monitor changes not in the color of indicator, but rather in the rate of element dissolution [6]. This can be done easily, as the kinetic curves of element dissolution are displayed at the stoichiograph monitor on a real time basis. Parameters of the dissolution process are adjusted immediately according to two rules.
1. If dissolution proceeds slowly or stops, the concentration of solvent components and/or temperature should be increased more frequently and to a greater extent.
2. If dissolution of at least one element (i.e., a minimum number of elements in the phase) proceeds at a significant rate, variation of the solvent concentration and temperature should be decreased or terminated.
Direct analogs of the stoichiographic titration are gradient elution and temperature programming in chromatography, electrolysis at a constant potential in quantitative analysis, and Q-regime in thermography. However, stoichiographic titration essentially differs from the classical analytical procedure: it is not necessary to take into account the consumption of a titrant (differential solvent), to know the ratios of the reacting solvent and solid phases, and to use the reactions running at high rates. All this becomes possible for one simple reason: stoichiographic titration quantitatively records the interaction products of a titrant and a titrated substance, i.e. the elements that pass into solution.
In practice, such titration consists in controlling the operation rate of peristaltic pumps in stoichiograph by means of an electronic device, which provides the desired changes in parameters of dynamic dissolution regime. The main advantage of stoichiographic titration consists in extremely fast (often, in a single experiment) optimization of successive dissolution and determination of solid phases with unknown elemental composition and stoichiometry, number and quantitative content in the analyzed object, real structure and dissolution rates. The unique potential of this new procedure is based on invariance of the dissolution stoichiometry to changes in the parameters of dynamic DD regime of this process.
Direct analogs of the stoichiographic titration are gradient elution and temperature programming in chromatography, electrolysis at a constant potential in quantitative analysis, and Q-regime in thermography. However, stoichiographic titration essentially differs from the classical analytical procedure: it is not necessary to take into account the consumption of a titrant (differential solvent), to know the ratios of the reacting solvent and solid phases, and to use the reactions running at high rates. All this becomes possible for one simple reason: stoichiographic titration quantitatively records the interaction products of a titrant and a titrated substance, i.e. the elements that pass into solution.
Stoichiographic calculations
The calculation and estimation of differential dissolution results include three steps. The first step is the processing of primary data and plotting of kinetic curves for dissolution of elements of the analyzed sample. The second step includes stoichiographic calculations leading to the simplest empirical formulas of the phases and providing data on their amount in the sample. At the third step, results of the stoichiographic calculations are correlated with the conditions of the dynamic dissolution regime to reveal possible ways for increasing the degree of phase separation and optimization of the separation process aimed at its acceleration, higher accuracy, microanalysis, concentration or preparative isolation of microphases [12].
An example of stoichiographic calculations for a mixture of phases ABc1 +ABc2 (or F1+F2) is considered below. There are two initial groups of data.
1) A and B are the number of mole elements A and B passing into solution at each time point upon complete dissolution of the sample. These data are extracted from kinetic curves for dissolution of elements А and В.
2) Stoichiometric coefficients c1 and c2 in the phase formulas, which are determined from linear segments of stoichiogram SB:A.
The calculations are not difficult if phases are separated completely in the course of differential dissolution. If separation of two phases is incomplete, then the problem for a segment of kinetic curves corresponding to joint dissolution of A and B is reduced to finding the values of AF1 and BF1, AF2 and BF2, i.e., the number of mole elements A and B in each of two phases ABc1 +ABc2 . Taking into account that A and B, c1 and c2 are known, BF1=c1AF1 and BF2=c2AF2, a set of two equations with two unknown AF1 and AF2 is solved for each point of the element dissolution kinetic curves:
A=AF1+AF2
B=c1AF1 + c2AF2
Accordingly, the number of moles F1 and F2 for each of the two phases 1 and 2 is found as
F1=AF1
F2=AF2
Ultimately, kinetic curves of element dissolution can be reconstructed as phase dissolution curves, areas under the curves being equal to the content of phases in the mixture, cf. Figure 2. Note that the stoichiograph software allows solving more complicated problems as compared to the example considered above [12].
Separation of substances in DD processes
To make stoichiographic calculations, it is necessary to ensure the selective separation of phases of the analyte mixture and/or their fanlike separation in the DD process. The selective separation needs no comments. It should be noted that for the phases comprising elements that do not enter the composition of other phases of the mixture, only the recording of their kinetic dissolution curves is needed. Separation of such phases is not required because kinetic curves are recorded by the ICP AES spectrometer independently of each other. Let us discuss the principles of fan-like separation, which is a novel method for obtaining data on the separation of mixtures. Information about this method is absent in the chemical literature.
The DD method ensures a complete dissolution of a sample of the tested solid substance. When the process occurs in a flow mode, the zones containing elements from each of dissolved phases are formed in the solution flow. Such zones are always shifted relative to one another, although they represent the unseparated mixture of all elements constituting the sample. Such shift of the zones takes place because, first, in the dynamic DD mode the dispersed phases give kinetic dependences with different time instants at which the dissolution begins and finishes and, second, the zones emerge owing to different rates of phase dissolution from the mixture. This issue is considered in detail elsewhere [13]. Here, it should be noted that the recorded rate of phase dissolution of a polydisperse solid substance depends on the distribution functions of particle shape and size, representation of different crystal faces on the reaction surface, different specific rates of dissolution, and unpredictable changes of reacting surface areas of phases upon dissolution. As a result, the stoichiographic detector records the “crowd” of unseparated kinetic dependences of chemical elements constituting the analyzed sample, Figure 3a, and similar elements may enter the composition of different phases of the mixture. In terms of traditional separation of substances, the final result of such DD processes has unsatisfactory characteristics of selectivity and efficiency of the phase separation or demonstrates a complete absence of separation per sec. The phase composition of the analyte cannot be derived from the time profile of such kinetic dependences of the dissolution of elements. However, the fan-like separation of phases appears on the corresponding stoichiograms. Such a fan is a sequence of linear regions of stoichiograms having constant molar ratios of elements (dissolution of individual phases), which are separated by nonlinear regions (simultaneous dissolution of two and more phases). This effect is produced by the above-mentioned difference in the time instants at which the dissolution of phases begins and finishes. Thus, the unique feature of the DD method is the possibility to separate individual phases from their unseparated mixtures by stoichiographic calculations, the principles of which are presented above. The total “images” of such kinetic dependences are obtained by superposition of kinetic curves of the dissolution of elements and phases (one onto another) in a unified time scale. This radically distinguishes stoichiographic DD dependences from mass spectrograms, chromatograms or diffractograms represented by uniform curves with consecutive signals of separated components of the mixture [3].
Figure 3c: The first lab-scale stoichiograph.
For example, in the model DD experiment, the stoichiographic detector records a “crowd” of unseparated kinetic dependences of the dissolution of chemical elements. However, the fan-like separation of phases shows up on the stoichiograms, Figure 4a. As a result of three stoichiographic calculation operations, data are obtained on the stoichiometric composition and quantitative content of six phases in their “crowd” with the earlier unknown phase composition, Figure 4b.

Figure 4a: Kinetic curves of dissolution of elements from the composition of a mixture of solid phases, wt %: A, 10.5; B, 16.8; C, 16.8; D, 37.8; E, 9.7; and F, 8.4, with the sum being 100. At the top of the figure is an explicit fan of the stoichiograms B: A and D: C.

Figure 4b: Kinetic curves of dissolution of elements E, C, F and phases P1, P2, and P3. At the top of the figure is an explicit fan of the stoichiograms E: P1 and F: C.
The metrology of differential dissolution
The specificity of estimating the metrological characteristics of DD techniques and results consists in the necessity to analyze mixtures with unknown phase composition. So, the accuracy of DD analysis data and its sensitivity are provided mainly by metrological characteristics of elemental analysis of the solutions formed in the DD processes Figure 4c.

Figure 4c: Kinetic curves of dissolution of phases of the composition, wt %: E1a, 3.16; A2B3, 21.0; A1B2E3, 12.6; C2D3, 42.0; D3F2, 21.0; and E1b, 0.21, with the sum being 100.
The reliability of DD data is confirmed by comparing them with the data obtained by structural methods, e.g., XRD, IR, CS, NMR, and NGR. However, the agreement of DD and structural data is often revealed only on a qualitative level, because, in distinction to DD, data of structural physical methods can almost never be quantitative. In many cases, such a comparison cannot completely confirm or disprove the DD data. The reason is that the DD method acquires unique data at determination of amorphous modifications of phases and stoichiometry of compounds with a variable composition as well as at determination of small phases and phase microanalysis.
The DD method in the analysis of heterogeneous catalysts
It should be noted that the DD method was originally developed to analyze heterogeneous catalysts, which have a complex, multielement and often unpredictable phase and surface composition. For more than 25 years, this method has been in common use for chemical analysis of heterogeneous catalysts and supports. Thousands of various samples have been analyzed; overall, their composition encompasses more than 60 elements of the Periodic Table. The DD method was efficient for studying the regularities underlying the formation of phase composition of catalysts at different stages of their synthesis and operation as well as for revealing the composition of active components and products of their interaction with supports. The objects of DD analysis may include dispersed powders, ceramics, crystals, thin films or nanosize structures containing crystalline and/or amorphous phases of constant and/or variable composition.
Depending on the chemical composition of multielement substances under analysis and on the nature of constituting elements, three types of results can be obtained by the DD method. First, researchers may fail to obtain the desired results if (a) they did not manage to choose the DD conditions that provide selective separation of phases or (b) phases consist of the elements that cannot be determined by ICP AES. Second, the DD analysis gives some results, but they do not differ qualitatively from the results of conventional structural methods (XRD, IR spectroscopy, etc.). However, the DD analysis virtually always afford the quantitative data. And third, the DD results can be considered as unique. Such results are obtained at the detection, identification and determination of new, earlier unknown phases, at the analysis of amorphous substances, low-content phases or phases with variable composition, in particular, spatially inhomogeneous ones. The fields of application of the DD method for investigating the catalyst composition, structure and properties are as follows. A preparative version of the DD method, which allows precise correction of the catalyst phase composition, is employed to investigate the structure and various properties of catalysts. About 200 publications and several review papers are devoted to application of the DD method for analyzing solid inorganic substances and materials, the most comprehensive review being presented in [10]. Two recent studies in this field are considered in our paper.
Phase composition determination can be exemplified by the analysis of catalysts for the synthesis of Multilayer Carbon Nanotubes (MCNT). Carbon nanotubes are now becoming the key materials for nanotechnologies, particularly in the production of general-purpose composite materials. The features of MCNT – their diameter, number of layers, and length -strongly depend on the chemical composition and structure of catalysts used in the synthesis. The DD method was employed to analyze the oxide Fe-Co catalysts intended for the synthesis of MCNT supported on Al2O3. Such catalysts possess high catalytic activity, thermostability and dispersion (particle size of the catalyst active components varies from 3 to 20 nm. Gross elemental composition of these catalysts (Fe 41.9 %, Co 23.5 %, Al 34.6 %) was found quantitatively without any difficulties, whereas determination of the phase composition by XRD, EDX and other methods was made only qualitatively, with many assumptions and presumptive conclusions. This is caused by multielement composition of the catalysts and substantial amorphization of the crystal structure of nanoparticles in the corresponding phases. Actually, the phase composition of these catalysts remained unclear to a great extent.
The use of the reference-free DD method in the analysis of substances with unknown phase composition makes it possible to perform in a single experiment all three steps of the analytical study: detection of phases in the analyte composition, their identification and quantitative determination. In the process, the detection of phases consists in revealing the linear segments of stoichiograms, which corresponds to the detection of two element fragments of respective phases. The identification of phases consists in determining the simplest stoichiometric formulas of the detected phases. Such formulas are compiled from the fragments of phases that are revealed by stoichiographic calculations. All steps of the calculations, their essence and sequence are described in detail in [14]. The final quantitative determination of identified phases in their mixture is made from the area under kinetic curve for dissolution of each phase, its value being found by numerical integration.
Table 3 lists data on the phase composition of Fe2Co/Al2O3 catalyst acquired by the DD method. The analysis was carried out in the flow dynamic regime of stoichiographic titration using a stoichiograph. The elemental composition of the nascent solution flow was estimated each 5 s from spectral lines of the elements (nm): Al 308.2, Co 238.8, and Fe 238.2. The flow dynamic regime was started with an aqueous solution with pH=2, which was then replaced with a 1:10 HCl solution. The dissolution was performed at a temperature gradually increasing from 20 to 75°C. In the HCl (1:10) solution, this process resulted in a complete dissolution of the sample.
| No. | Results of the DD method | % | Forms of Co, Fe |
|---|---|---|---|
| 1 | Co0.32 ± 0.02 Fe0.69 ± 0.1Al1 or 0.6CoO·1.4Fe2O3·Al2O3 |
38.3 | Co2+, Fe3+ |
| 2 | Co0.25 ± 0.01 Fe0.26 ± 0.02Al1 or Co0.5Fe0.5Al2O4 |
46.5 | Co2+, Fe2+ |
| 3 | Co1 or CoO | 2.8 | - |
| 4 | Fe1, probable Fe3O4 | 12.4 | Fe3++ Fe2+ |
Table 3: The phase composition of the sample Fe2Co/Al2O3, (DD method).
Let us consider sequential steps of stoichiographic calculations for the DD analysis of Fe2Co/Al2O3 catalyst, Table 3.
Figure 5 shows the kinetic dissolution curves of Fe, Co and Al and the stoichiograms Co/Al in a parametric form in dependence on the dissolution degree of the sum of Fe, Co and Al. In a set of such dependences, of special interest is the stoichiogram Co/Al. In the initial section this stoichiogram tends to infinity; this is followed by two linear sections with constant molar ratios Co/Al=0.25 ± 0.01 and Co/Al=0.32 ± 0.02, which pass into each other. These data indicate the presence of Co1, Co0.32Al1 and Co0.25Al1 fragments in the catalyst as components of three incompletely separated phases. The subtraction of Co0.32Al1 and Co0.25Al1 fragments from the kinetic dissolution curves of Co and Al makes it possible to obtain individual kinetic dissolution curves of these three fragments (completion of step 1). Note that the subtraction process should be performed in two steps. At the first step, Co0.32Al1 and a part of Co0.25Al1 are separated. The remaining Co0.25Al1 and Co1 are separated at the second step. Such two-step calculations are necessary because phase separation in stoichiographic calculations is possible only for two incompletely separated phases. Phase composition of the substance under analysis is unknown; in the case of single-step separation, a part of Co in the Co1 phase could be used incorrectly to form the excess amounts of Co0.32Al1 or Co0.25Al1 fragments.

Figure 5: The kinetic dissolution curves of Fe, Co and Al and the stoichiograms Co/Al in a parametric form in dependence on the dissolution degree of the sum of Fe, Co and Al of Fe2Co/Al2O3 catalyst.
Figure 6 displays kinetic dissolution curves of the Co1 phase, Co0.32Al1 fragment of the Ph1 phase, and two Co0.25Al1 fragments (Ph2 and Ph3) in a parametric form versus the dissolution degree of a sample. The latter two fragments are continuations of each other, they form a joint fragment of the composition Co0.25Al1. Figure 6 depicts also the kinetic dissolution curve of Fe and the stoichiogram Fe/Ph1. The linear segment of this stoichiogram (Fe/Ph1=0.68 ± 0.03) allows introducing the appropriate amount of Fe into Co0.32Alas fragment to obtain the ultimate formula of Fe0.68Co0.32Al1 phase (completion of step 2). At this step, stoichiographic calculations should be supplemented with data on the content of two iron species, Fe2+ and Fe3+, in the Fe2Co/Al2O3 catalyst. Data on the Fe2+ content were obtained during the differential dissolution using test strips impregnated with 2.2-bipyridine. The Fe3+ content was found from the difference of total iron content and Fe2+ content. Accordingly, the composition of (Ph2+Ph3) phase was presented as a fractionary (without oxygen) formula Fe0.26 ± 0.02Co0.25 ± 0.02Al1. Taking into account the oxide nature of this phase and the oxidation state of Fe and Co equal to 2+, full formula of the phase will be (Fe0.50Co0.50) O·Al2O3, i.e., MeO·Al2O3, where Me=Fe+Co. The latter formula corresponds to the oxide phase with the spinel structure, MeAl2O4 (completion of step 3).
Figure 6: The kinetic dissolution curves of Fe, the phase Co1, two fragments of the phase Co and Co0.25Al1 (Ph2 and Ph3), fragment of the phase Co0.32Al1 (Ph1), as well as the Fe/Ph1 stoichiogram in the parametric form in dependence on the dissolution degree of the sum of all components of Fe2Co/Al2O3 catalyst.
If an appropriate amount of Fe is introduced into the Co0.25Al1 fragment (Ph2 and Ph3) and the Fe0.26Co0.25Al1 phase is completely subtracted, the iron phase (Feres) is revealed (completion of step 4). The stoichiograms Feres/Ph2 and Feres/Ph3, which are shown in Figure 7, are time variable; according to the DD principles, this indicates the absence of a stoichiometric compound between Feres and Fe0.26Co0.25Al1 phases. These two phases start and complete the dissolution simultaneously, thus suggesting high homogeneity of their nanoparticle mixtures. Quantitative data on the phase composition of the catalyst sample are listed in Table 3; kinetic dissolution curves of all the detected and identified phases are displayed in Figure 8.

Figure 7: The kinetic dissolution curves of Fe, the phase Co1, the phase Fe0.68Co0.32Al1 (Ph1), two fragments of the phase Co0.25Al1 (Ph2 and Ph3), as well as the stoichiograms Feres/Ph2 and Feres/Ph3 in the parametric form in dependence on the dissolution degree of the sum of all components of Fe2Co/Al2O3 catalyst.

Figure 8: The kinetic dissolution curves of all the phases detected and identified for the catalyst Fe2Co/Al2O3.
Thus, the single experiment and four calculation operations allowed us to obtain quantitative data on the catalyst phase composition. However, it should be noted that, similar to chess problems (“white chess pieces start the game and give check mate in three moves”), stoichiographic calculations require a certain time to estimate the experimental DD data that are graphically presented as kinetic dissolution curves of elements and stoichiograms (the so-called DD patterns). DD patterns are analyzed to form the calculation steps, their content and sequence. Different versions of stoichiographic calculations leading to the final result are considered. The initial DD patterns are saved in computer memory, their copies being used one after another to find the final version of calculations. It means that in the DD analysis, as in chess problem solving, different variants of moves leading to the victory are considered.
Mastering the rules, techniques and theory of the game are necessary to play chess; by analogy, the appropriate special knowledge is needed for DD analysis. In this respect, the DD method is quite similar to chromatography, mass spectrometry, voltammetry and optical spectrometry. However, this stoichiographic method has some individual features strongly distinguishing it from other methods of modern analytical chemistry. Many conventional elements of analytical studies are not required for DD analysis: stepwise approach to the development of techniques (sample preparation, separation and identification) is absent, reference samples of compounds are not used, and calibration curves are not plotted. Stoichiographic calculations make it possible to perform quantitative analysis at incomplete separation of phases. Such key attributes of analytical chemistry as equilibrium, distribution and sorption constants as well as retention time and volume are not employed here; metrological estimation of analytical data by the “introduced-found” procedure is not carried out. In the case of DD method, such attributes are either inapplicable or useless. These may be one of the reasons why the DD method still remains obscure for specialists in analytical chemistry. However, the main reason is that phase analysis is a neglected area in the modern analytical chemistry. It is believed to be the sphere of structural methods, first of all the XRD. The appearance of DD method has radically changed such concept. This is a rapidly developing method, which is recognized by material engineers, though not by analytical chemists. As was noted above, about 200 scientific papers have been published to date, including several reviews [10]. The DD method was successfully applied by specialists from 100 research teams in Russia and 14 other countries, in particular the USA, Germany, France, China, Japan, India, Korea, and South Africa.
Determination of the surface composition can be illustrated by the DD analysis of fiberglass catalysts. Silicate glass fibers are commercially produced as filaments, fabrics and glass wool and employed in various fields of industry as heat and electric insulators and fillers for polymers and composite materials. Glass fibers modified with supported metals are used as heterogeneous catalysts. Such catalysts possess many essential features: they are active at extremely low content of noble metals (0.01 - 0.05 wt.%), highly resistant to catalytic poisons, the catalyst layers have low friction loss and can take any geometrical shape. Fiberglass materials are X-ray amorphous; their structure is examined by the IR spectroscopy, 29Si NMR and BET methods. Meanwhile, many aspects concerning the chemical composition of fiberglass materials remain poorly investigated, in particular, determination of their phase composition, surface layer composition, and chemical forms of the modifying components introduced into fiberglasses in small amounts.
The DD method was used to reveal the composition of surface layers in (1) SiO2 fiberglass supports with zirconium addition and (2) catalysts prepared with such supports. The specific surface area of the samples was 1 m2/g. Accordingly, surface area of a 10-mg sample used for DD analysis was equal to 100 cm2, and weight of a 5 Å × 1 cm2 SiO2 layer was 13.3 μg. The ICP AES detection limit for Zr and Si is 0.05 μg/mL, which is by 1-2 orders of magnitude lower as compared to Zr concentration in a solution flow that forms during the DD analysis.
The DD method resembles the secondary ion mass spectrometry (SIMS) when determining the surface composition. These two methods are based on ionization and transfer of the solid phase surface components into vacuum (SIMS) or solution (DD). Ionization is produced by a flux of inert gas ions (SIMS) or a solvent proton flux (DD). The calculations and experimental data showed that the surface composition of solid phases can be determined by the DD method with a resolution of 5-10 Å. Figure 9 displays the kinetic DD dependence for dissolution of a 100 Å thick gold film deposited onto the surface of a ∼0.3 cm2 silicon plate. Thickness of the gold film was found by independent methods. The DD dependence for Au in Figure 9 was plotted by 18 points; this corresponds on the average (for a period between two measurements) to the 5.5 Å thickness of dissolved gold layer.

Figure 9a: DD analysis of SiO2fiberglass.

Figure 9b: Model of surface layer of fiberglass SiO2.
The DD method was used to analyze the Co-containing catalyst prepared by deposition of 0.02 wt.% Co on the surface of Si-Zr glass fabric (90.9 wt.% Si and 9.0 wt.% Zr). Forms of spatial inhomogeneity in the chemical composition of this glass fabric were detected, identified and quantitatively characterized for the first time, Figure 9a. The analysis revealed the hydrated Si species on the surface of Zr0.074Si1 matrix phase and two Co species: (1) 0.018 wt.% Co on the surface of hydrated Si species and (2) ~0.002 wt.% Co in the pore structure of Zr0.074Si1 matrix, Figure 9a and 9b.
Homogeneous Catalysts
To analyze aqueous solutions of homogeneous catalysts, the ion chromatography method has been developed. The ion chromatostoichiograph combines the ion chromatograph with the multielement ICP AES analyzer detector and is equipped with the software package for stoichiographic calculations [6]. Unfortunately, in our studies the ICP AES spectrometer was employed for the analysis of only aqueous solutions. The results obtained by ion chromatostoichiography (ICS) demonstrate the potential of stoichiography applied to chromatography. We had no opportunity for developing such studies because our attention was completely focused on the DD method.
Ion chromatostoichiography
The application of ICS is most promising in the cases where chromatograms are characterized by low selectivity and/or efficiency of separation of the mixture components. In DD terms, this indicates the fan-like separation of components.
The first objects of ICS were aqueous solutions of the mixtures of sodium sulfite Na2SO3 and sodium selenosulfate Na2SSeO3 salts. The study was carried out in a stainless steel chromatographic column (50 mm in length and 6 mm in diameter) filled with a universal anion-exchange sorbent HIKS-1. A carbonate solution (0.003 M NaHCO3+0.0024 M Na2CO3) served as the eluent. Note that the use of ICP AES detector in ICS makes unnecessary the suppressing column of ion chromatograph intended for the removal of components hindering the detection of the target ions from the eluate. Figure 10a displays the chromatogram of an aqueous solution of the Na2CO3 and Na2SSeO3 mixture obtained on the ion chromatograph with electrical conductivity detector. Direct interpretation of this chromatogram with two unseparated peaks is impossible. Figure 10b shows chromatograms S and Se, which were obtained on the ion chromatostoichiograph. The stoichiogram Se:S has two linear regions with the Se:S molar ratio equal to 0 and 1. This testifies to the presence of two anions in the mixture: one contains only sulfur, while another contains selenium and sulfur in a 1:1 ratio; thus, the fragmentary (without oxygen) formulas of the anions are S1 and Se1S1. As a result of stoichiographic calculations, individual chromatograms S1 and Se1S1 were obtained, Figure 10c, and concentration of SO32- and SSeO32- anions in the analyzed solution was found.

Figure 10a: Chromatogram of an aqueous solution of the Na2SO3 and Na2SSeO3 mixture; ion chromatograph and electrical conductivity detector.

Figure 10b: Chromatograms S and Se and stoichiogram S: Se; ion chromate stoichiograph and ICP AES detector.

Figure 10c: Chromatogram of the SO32- and Se SO32- mixture transformed from chromatogram 1b by stoichiographic calculations.
The application of ICS for the analysis of homogeneous catalysts seems to be particularly efficient in the case of complex aqueous solutions of heteropoly compounds (P-Mo, Si-Mo, As-W and others), sulfophthalocyanines of metals (Co, Ni, Cu), etc. Figure 11 displays the consecutively obtained chromatograms of two solutions of phosphomolybdic heteropoly acid with different degree of decomposition. It is clear that the fan-like separation of the mixture of compounds has occurred. Stoichiographic calculations made it possible to detect, separate and quantitatively determine in these solutions both the ions of heteropoly acid and the ions of phosphoric and molybdic acids without the use of reference samples or selective separation.

Figure 11: Chromatograms of two solutions of phosphomolybdic heteropoly acid with different degree of decomposition.
We believe there is an actual opportunity now to create chromatostoichiographs for GC, GLC and HPLC as well as a stoichiograph for capillary electrophoresis. The necessary devices, where multielement analyzers serve as detectors, have been described many years ago – these are the atomic emission spectrometers and mass spectrometers with inductively coupled plasma; it remains only to render the functions of stoichiographs to such devices.
Certainly, the DD method cannot replace other methods (XRD, NMR, ESR, IR and Raman spectroscopy, ТА, and EM), but it occupies a proper place in this list. The significance of its place is related to the unique reference-free nature of DD and its ability to determine in a single experiment, rapidly and with high sensitivity the stoichiometric formulas and content of crystal and amorphous phases with constant and variable composition in solid multielement multiphase objects. The DD analysis is applicable not only to catalysts, but also to various functional materials, natural minerals, ores and products of their processing as well as to atmospheric aerosols and archaeological findings. Phase composition of such substances may be unclear, comprising yet unknown phases.
At present, inorganic analysis of solid substances is dominated by the elemental analysis methods. Although data on the elemental composition are of fundamental importance, it should be noted that modern science and engineering require information about chemical compounds constituting various solid substances and materials and about fine variation of the spatial structure and composition of such objects. It is desirable for specialists in inorganic analytical chemistry to change their attitude to the indicated problem and turn their mind to unique possibilities provided by the stoichiography and DD method. Many years of successful application for investigation of various substances and materials suggest that the DD method could play the same role in analyzing the mixtures of inorganic solids as chromatography in analyzing the mixtures of organic compounds.
The authors appreciate the support of their studies from Presidium of the Russian Academy of Sciences (Project No. 8) and the Russian Foundation for Basic Research (Project 11-03-00093).