Journal of Chromatography & Separation Techniques
Open Access
ISSN: 2157-7064
ISSN: 2157-7064
Research Article - (2015) Volume 6, Issue 2
To develop the stability indicating, highly accurate precise and linear method for related substance of the Dabigatran through the reverse phase high performance liquid chromatography and it is validated as per the current ICH guideline. The optimize method uses a reverse phase column, Poroshell 120 EC -18 (150 mm × 4.6 mm, 2.7μ), Mobile Phase of hexane-1 Sulfonic acid sodium salt monohydrate (6.5 ± 0.05) and Methanol through gradient flow rate of 0.6ml/min. Keeping the column at temperature 30°C and using the sample amount 10 μL at 5°C and detected all the impurities at 230 nm by the UV detector. In the developed method, elution of Dabigatran was at 26.9 min and all the eluted Impurities were well separated and met the system suitability criteria. The precision is exemplified by relative standard deviation of 0.40%. Method percentage mean recoveries of all the impurities are within the range (90.0% to 115.0%) as per the protocol. Resolution results show that the method is robust. Linearity coefficient for all Impurities is more than 0.999. The LOD obtained is 0.01% and LOQ is 0.03%. A new highly accurate, precise and stability indicating method was developed for related substance of Dabigatran with all the impurities well separate from the degradation product of Dabigatran. It is ready to use for the routine analysis of related substance of Dabigatran in Pharmaceutical industry.
Keywords: Dabigatran etexilate mesylate; HPLC; Method development; Method validations; ICH
DBA: Dabigatran Etexilate Mesylate; ICH: International committee of Harmonization; HPLC: High Performance Liquid Chromatography; Impurity-A: 3-(2-((4-Amidinophenylamino) methyl)-1-methyl-N-(pyridin-2-yl)-1H-benzo[d]imidazole- 5-carboxamido)propanoic acid; DAB-2B: E t h y l 3-(2-((4-amidinophenylamino)methyl)-1-methyl-N-(pyridin-2-yl)- 1H-benzo[d]imidazole-5-carboxamido)propanoate; Impurity-C : Ethyl 3-[[[2-[[[4-[[[(ethylloxy)carbonyl]amino] iminomethyl]phenyl] amino]methyl]-1-methyl-1H-benzimidazol-5-yl]carbonyl](pyridin- 2-yl)amino] propanoate; Impurity-D: 3-(2-(((4-(N-((hexyloxy) carbonyl)carbamimidoyl)phenyl)amino)methyl)-1-methyl-N- (pyridin-2-yl)-1H-benzo[d]imidazole-5-carboxamido)propanoic acid; Impurity-E: Hexyl ((4-(((5-((3amino-3-oxopropyl) (pyridin-2-yl)carbamoyl)-1-methyl-1H-benzo[d]idazol-2-yl) methyl)amino)phenyl)(imino)methyl)carbamate; Impurity-G: Ethyl 2-(((4-(N-((hexyloxy)carbonyl)carbamimidoyl)phenyl) amino)methyl)-1-methyl-1H-benzo[d]imidazole-5-carboxylate; Impurity-H: 2-(((4-(N-((hexyloxy)carbonyl)carbamimidoyl) phenyl)amino)methyl)-1-methyl-1H-benzo[d]imidazole- 5-carboxylic acid; Impurity-J: Ethyl 3-(2-(((4-(((hexyloxy) carbonyl)carbamoyl)phenyl)amino)methyl)-1-methyl-N-(pyridin-2- yl)-1H-benzo[d]imidazole-5-carboxamido)propanoate; Impurity-K: Ethyl 3-[[[2-[[[4-[[[(pentyloxy) carbonyl]amino]iminomethyl]phenyl] amino]methyl]-1-methyl-1H-benzimidazol-5-yl]carbonyl](pyridin-2- yl)amino]propanoate
Dabigatran is a newly available oral direct thrombin inhibitor approved for anticoagulation therapy to prevent strokes in patients with non-valvular arterial fibrillation. It is being studied for various clinical indications and in some cases it offers an alternative to Warfarin as the preferred orally administered anticoagulant ("blood thinner") because it does not require frequent blood tests for international normalized ratio (INR) monitoring while offering similar results in terms of efficacy. Dabigatran Etexilate chemically Ethyl 3-(1-{2-[({4[Amino({[(Hexyloxy)Carbonyl] Imino})Methyl] Phenyl}Amino)Methyl]-1-Methyl-1H-1,3-Benzodiazol-5-Yl}-N- (Pyridin-2 Yl)Formamido)Propanoate (Figure 1).
Dabigatran (then compound BIBR 953) was discovered from a panel of chemicals with similar structure to benzamidinebasedthrombin inhibitor α-NAPAP (N-alpha-(2- naphthylsulfonylglycyl)-4-amidinophenylalanine piperidide), since 1980s this panel of chemicals had been known as powerful inhibitors of various serine proteases, specifically of thrombin, but also of trypsin [1-3].
The most commonly reported side effect of dabigatran is GI upset. When compared to people anticoagulated with warfarin, patients taking dabigatran had fewer life-threatening bleeds, fewer minor and major bleeds, including intracranial bleeds, but the rate of GI bleeding was significantly higher. Dabigatran capsules contain tartaric acid, which lowers the gastric pH and is required for adequate absorption. The lower pH has previously been associated with dyspepsia; some hypothesize that this plays a role in the increased risk of gastrointestinal bleeding [4-10].
Dabigatran has about nine reported impurities chemicals. The chemical structure and the origin of impurities reported under Table 1 [11-13]. Any impurity is defined as a substance coexisting with the original drug, such as starting material or intermediates or that is formed, due to any side reactions. Analysis of impurities in drug substance plays a key role in the novel journey of any drug substance in the pharmaceutical industry. Several analytical method have been reported in literature for the Assay determination of Dabigatran through different analytical methods but no literature reveals the accurate and precise method for the determination of related substances by the RP-HPLC [14-16].
| S.No | Impurity Code | Structure | Chemical Name | Remarks |
|---|---|---|---|---|
| 1 | DAB Impurity -A | 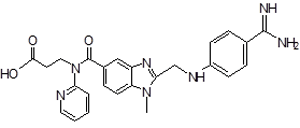 |
3-(2-((4-Amidinophenylamino)methyl)-1-methyl-N-(pyridin-2-yl)-1H-benzo[d]imidazole-5-carboxamido)propanoic acid | Process related , and Metabolite |
| 2 | DAB Impurity -B | 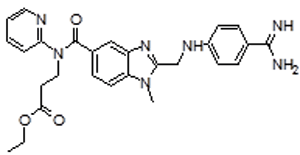 |
Ethyl 3-(2-((4-amidinophenylamino) methyl)-1-methyl-N-(pyridin-2-yl)-1H-benzo[d]imidazole-5-carboxamido)propanoate | Process related, Degradation (oxidative) and Metabolite |
| 3 | DAB Impurity -C | 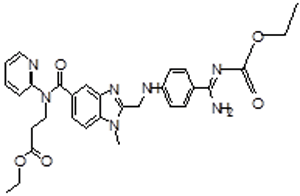 |
Ethyl 3-[[[2-[[[4-[[[(ethylloxy)carbonyl]amino] iminomethyl]phenyl]amino] methyl]-1-methyl-1H-benzimidazol-5-yl]carbonyl](pyridin-2-yl)amino] propanoate | Process related |
| 4 | DAB Impurity -D | 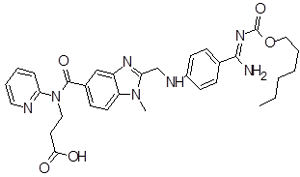 |
3-(2-(((4-(N-((hexyloxy)carbonyl)carbamimidoyl) phenyl)amino)methyl)-1-methyl-N-(pyridin-2-yl)-1H-benzo[d]imidazole-5-carboxamido)propanoic acid | Process related , degradation (acid,base) and Metabolite |
| 5 | DAB Impurity -E | 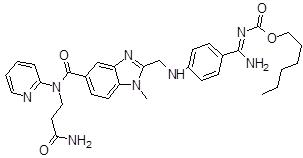 |
Hexyl ((4-(((5-((3amino-3oxopropyl)(pyridin-2yl) carbamoyl)-1methyl-1H-benzo[d]idazol2yl)methyl) amino)henyl)(imino)methyl)carbamate | Process related |
| 6 | DAB Impurity -G | 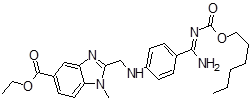 |
Ethyl 2-(((4-(N-((hexyloxy)carbonyl) carbamimidoyl)phenyl)amino)methyl) -1-methyl-1H-benzo[d]imidazole-5-carboxylate | . Process related |
| 7 | DAB Impurity -H | 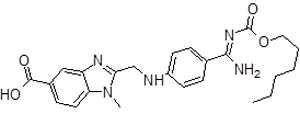 |
2-(((4-(N-((hexyloxy) carbonyl)carbamimidoyl) phenyl)amino)methyl) -1-methyl-1H-benzo[d]imidazole-5-carboxylic acid | . Process related |
| 8 | DAB Impurity -J | 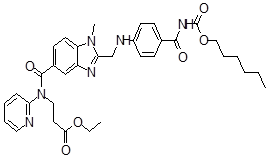 |
Ethyl 3-(2-(((4-(((hexyloxy)carbonyl)carbamoyl)phenyl)amino)methyl)-1-methyl-N-(pyridin-2-yl)-1H-benzo[d]imidazole-5-carboxamido)propanoate | Process related and Degradation (Temp.& humidity) |
| 9 | DAB Impurity -K | 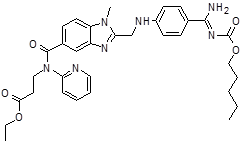 |
Ethyl 3-[[[2-[[[4-[[[(pentyloxy) carbonyl]amino]iminomethyl] phenyl]amino]methyl]-1-methyl-1H-benzimidazol-5-yl]carbonyl](pyridin-2-yl)amino]propanoate | Process related |
Table 1: Origin and pathway of DBA impurities
Reverse Phase liquid chromatography has been proven as a versatile, sensitive, reproducible and highly precise method for its ability to separate the complex mixture of Drug Substances with impurities and its easy handling [17,18]. All these advantages of RP-HPLC make this the first choice of modern chemists. So in this scenario a reproducible and accurate method of analysis with proper documented validation give huge support to Pharmaceutical industry.
A Sample of Dabigatran etexilate mesylate is provided by Micro labs Bangalore with purity of more than 99.0%. All the used Impurities are as per the reference standard. All the solvent and reagent those are used during the analysis are highly pure and HPLC graded. Instrument HPLC with UV/PDA Detector Shimadzu LC-2010CHT, HPLC with UV Detector Waters Alliance Analytical Balance, Micro Balance, PH meter were used during the analysis. All instruments were calibrated prior to Method development and validation.
Buffer preparation
1.88 g hexane-1 sulfonic acid sodium salt monohydrate was dissolved in 1000 mL of water. Add 1 mL of triethylamine to it and adjust the pH to 6.5 ± 0.05 with diluted orthophosphoric acid. Filter through 0.45 μ filter paper.
| Time | 0.01 | 15 | 20 | 35 | 45 | 46 | 55 |
| % of Mobile phase A | 60 | 30 | 20 | 15 | 15 | 60 | 60 |
| % of Mobile phase B | 40 | 70 | 80 | 85 | 85 | 40 | 40 |
Mobile Phase preparation
Mobile phase A prepared as degas Mixture of 20% of methanol and 80% Buffer and Mobile phase B prepared as a degas Mixture 80% methanol and 20% Buffer and both mobile phases use as per the below gradient for obtaining better separation . Poroshell 120 EC -18 (150 mm × 4.6 mm, 2.7μ) column is used with flow rate 0.6 ml/min. Keep the column at 30°C and using the sample amount 10 μL at 5°C and detected all the impurities at 230 nm by the UV detector on the HPLC.
System suitability solution
Accurately weighed about 1 mg each of DAB reference/working standard and DAB Impurity-J reference standard and transferred into a 100 mL volumetric flask, added about 25 mL of diluent, dissolve the sample and make the volume up to 100 ml with diluent. Shake well to mix.
Sample solution
Accurately weigh about 20 mg of sample and transfer into a 100 mL volumetric flask. Add about 25 mL of diluent to it, dissolve and dilute to volume with diluent. Shake well to mix.
Procedure
The system was Equilibrate until stable baseline was achieved. Inject 2 injection of Blank (Diluent), single injection of system suitability solution and single injection of sample solution. Record the chromatogram and report the result by area normalization method. Eliminate the peaks due to blank. Measure the system suitability criteria. The resolution between DAB and DAB Impurity-J observed in the chromatogram of system suitability solution should be not less than 2.5. Above method was finalized after lots of trial and this method would be validated on different parameters as per the ICH guideline.
Validation procedure and result are described under the result and discussion section.
Solution stability
Prepared blank, (as diluents) system suitability solution as per the method and spiked all the impurities which are mentioned in Table 1 as per the specification label. Sample solution was preparing freshly and injected. This study was repeated at the interval of 6 hours till 24 hours to measure the solution stability at 5°C temperature.
Specificity
Specificity is the ability to assess unequivocally of analytic in the presence of components which may be expected to be present. In this study Specificity has been performed as interference study and forced degradation study using HPLC system with PDA detector. For the interference study of DAB drug substance Prepared and injected blank, system suitability solution and spiked all the Impurities as per specification label. Checked the system suitability criteria and recorded the observations.
Force degradation
It is a measurement of specificity and it’s also help to proper selection of stability-indicating analytical procedures. A literature revel the Stress studies should be done in different pH solutions, in the presence of oxygen and light, and at elevated temperatures and humidity levels to determine the stability of the drug substance. These stress studies are conducted on a single batch. This information will in turn help improve the formulation manufacturing process and determine the storage conditions. As no specific set of conditions is applicable to all drug products and drug substances and the regulatory guidance does not specify about the conditions to be used, this study requires the experimenter to use common sense [13]. In our study, stress conditions were performed in presence of Acid, Alkali, Oxygen and light (Photolytic), temperature/humidity and thermal conditions.
Limit of detection
The detection limit of an individual analytical procedure is the lowest amount of analyte in a sample which can be detected but not necessarily quantitated as an exact value. The detection limit is determined by the analysis of samples with known concentrations of analyte and by establishing the minimum level at which the analyte can be reliably detected. The detection limit (DL) may be expressed as [19-21]:
DL = 3.3 σ
----------------------
S
Where σ = the standard deviation of the response
S = the slope of the calibration curve
The slope S may be estimated from the calibration curve of the analyte. The estimate of σ may be carried out in a variety of ways.
Limit of quantization
The quantitation limit of an individual analytical procedure is the lowest amount of analyte in a sample which can be quantitatively determined with suitable precision and accuracy. LOQ determined by several methods [22,23].
The detection limit (DL) may be expressed as:
QL = 10 σ
---------------------
S
Where σ = the standard deviation of the response
S = the slope of the calibration curve
The slope S may be estimated from the calibration curve of the analyte. The estimate of σ may be carried out in a variety of ways.
In presented study author Determined the limit of quantification (LOQ) of DAB (un-known impurity) by the analysis of samples with known concentrations of analyte by establishing the concentration which will give a concentration of about 3.0 times of LOD with an RSD of 10% for peak area of DAB peak. The % RSD of 6 replicate injection of spiked sample is less than 4%.
Linearity
A linear relationship should be evaluated across the range (see section 3) of the analytical procedure. It may be demonstrated directly on the drug substance (by dilution of a standard stock solution) and/or separate weighing of synthetic mixtures of the drug product components, using the proposed procedure. The latter aspect can be studied during investigation of the range. As per the ICH guideline Linearity established for all the Impurities and for DAB form different concentration levels that are start form LOQ to 50%, 80%, 100%, 120%, 150% of Impurities as per their shelf specification level [24,25].
Accuracy
The accuracy of an analytical procedure expresses the closeness of agreement between the value which is accepted either as a conventional true value or an accepted reference value and the value found. In the present study author check the accuracy for all the Impurities as well as DAB on different specification level that are LOQ, 50%, 100% and 150%. All the preparation of test solution were prepared in triplicate (n=3).
Precision
It was performed by carrying out the analysis of the six homogenous solutions of same test sample and content of impurities was calculated. The determinations were carried out one after the other under conditions as similar as possible.
Intermediate precision
The intermediate precision of the method was checked by determining precision on a different instrument, analysis being performed in on a different day. The % content of all DAB impurities and total impurities was found to be below quantification level even when it is performed on a different instrument. The method is said to be precise with respect to the criteria of the intermediate precision.
Robustness
According to ICH, the robustness of an analytical procedure is a measure of its capacity to remain unaffected by small but deliberate variations in method parameters and provides an indication of its reliability during normal use. To establish the robustness of method here, make the changes in HPLC method as per the ICH guidelines. These changes are listed below. Compare the resolution of all Impurities in each condition and data are listed under Table 10
Condition (1): Altered the mobile phase flow by ± 0.1 mL/ minute
a. Altered the mobile phase flow to 0.5 mL instead of 0.6 mL.
b. Altered the mobile phase flow to 0.7 mL instead of 0.6 mL.
Condition (2): Altered the column oven temperature by ± 2°C
a. Altered the column oven temperature to 28°C instead of 30°C.
b. Alter the column oven temperature to 32°C instead of 30°C.
Condition (3): Altered the column with different lot number.
Condition (4): Altered the pH of the buffer solution by ± 0.2
c. Altered the pH of the buffer solution to 6.30 instead of 6.50.
d. Altered the pH of the buffer solution to 6.70 instead of 6.50
The present investigation optimum result was obtained under the prescribed chromatographic condition. Retention time of DAB was obtained around at 26.97 min that is well separated form eluting peak of DAB Impurity J. Obtained resolution between DAB and DAB impurity J is 10.02 that are more than required system suitability criteria under the procedure (Figure 2).
The Solution stability results indicate that system suitability solution, sample solution is stable at 5°C up to 18 hours from the time of preparation. All obtained result summarize in Table 2. Specificity result indicate no interference observed at the retention times of known impurities due to blank. Observed purity threshold is more than purity angle for all known impurities and DAB peak in the spiked sample solution All the Result of peak purity shown under (Table 2, Figure 3). So it is concluded the method is specific and selective.
| Name of component | Initial | After 6 hours | After 12 hours | After 18 hours | After 24 hours |
|---|---|---|---|---|---|
| DAB Impurity-A | - | -0.72 | -1.24 | -0.68 | 4.42 |
| DAB-2B | - | 0.95 | -1.70 | -0.45 | -0.90 |
| DAB Impurity-C | - | 0.00 | 0.98 | -0.24 | -1.14 |
| DAB Impurity-H | - | -0.51 | -0.53 | -1.05 | -0.41 |
| DAB Impurity-D | - | 0.44 | -1.36 | 0.66 | -0.27 |
| DAB Impurity-E | - | -0.91 | -0.43 | -0.97 | -1.30 |
| DAB Impurity-K | - | 0.18 | -0.60 | -0.66 | -0.01 |
| DAB Impurity-J | - | -2.34 | -7.19 | -8.60 | -15.89 |
| DAB Impurity-G | - | 1.75 | 1.88 | -1.24 | -2.61 |
| DAB | - | 0.01 | 0.01 | 0.03 | 0.03 |
Table 2: Summarize the result study of Solution stability of impurities in sample solution.
The selection of stress study for DAB is given in (Tables 3 and 3.1). The acceptation criteria is, it should meet the system suitability requirement as per the method as well as percent degradation should be between 5 to 30% and Peak purity of main compound and known impurity peaks should pass. The peak purities of all known impurity peaks and DAB peak in each degradation condition are meeting the criteria. It indicates that there is no co-elution at the retention times of any of the known impurities and DAB peak. Dabigatran Etexilate Mesylate drug substance shows significant degradation in basic, oxidative conditions and slight degradation shown in acid degradation.
| S. No. | Name of impurity | Conditions for degradation | |||
|---|---|---|---|---|---|
| Control sample (%) | Acid degradation (1N HCl / at RT / 1Hour) | Base degradation (1N NaOH / at RT/ 2 hours) | Oxidative degradation (3%v/v H2O2 / at RT / 12 Hours ) | ||
| 1 | DAB Impurity-A | ND | ND | 0.31 | |
| 2 | DAB-2B | ND | 0.01 | 0.01 | 1.93 |
| 3 | DAB Impurity-C | 0.08 | 0.08 | 0.06 | 0.08 |
| 4 | DAB Impurity-H | ND | 0.04 | 0.04 | 0.25 |
| 5 | DAB Impurity-D | ND | 4.55 | 9.37 | 0.04 |
| 6 | DAB Impurity-E | 0.09 | 0.11 | 0.09 | 0.77 |
| 7 | DAB Impurity-K | 0.01 | 0.01 | 0.01 | 0.01 |
| 8 | DAB Impurity-J | ND | 0.03 | 0.01 | 0.27 |
| 9 | DAB Impurity-G | 0.04 | 0.05 | 0.03 | 0.71 |
| 10 | Total unknown impurities | 0.08 | 0.12 | 0.14 | 1.30 |
| 11 | Total impurities | 0.30 | 4.99 | 10.07 | 5.36 |
| 12 | % of Degradation | NA | 4.70 | 9.80 | 5.07 |
Table 3: Result of Force Degradation study in Dabigatran etexilate mesylate
| S. No. | Name of impurities | Photolytic degradation (%) (1.2Million lux hours & 200 WH/m2) | Temperature/ Humidity degradation (%) (60°C ± 2 and 80%RH ± 5% for 48 hours) | Thermal degradation (%) (105°C±2 for 24 hours ) |
|---|---|---|---|---|
| 1 | DAB Impurity-A | ND | ND | ND |
| 2 | DAB-2B | ND | 0.04 | 0.21 |
| 3 | DAB Impurity-C | 0.09 | 0.08 | 0.10 |
| 4 | DAB Impurity-H | ND | ND | ND |
| 5 | DAB Impurity-D | 0.02 | ND | ND |
| 6 | DAB Impurity-E | ND | 0.09 | 0.11 |
| 7 | DAB Impurity-K | 0.01 | 0.01 | ND |
| 8 | DAB Impurity-J | 0.02 | 1.32 | 0.02 |
| 9 | DAB Impurity-G | 0.06 | 0.04 | 0.71 |
| 10 | Total unknown impurities | 0.39 | 0.12 | 0.10 |
| 11 | Total impurities | 0.59 | 1.71 | 1.24 |
| 12 | % of Degradation | 0.29 | 1.41 | 0.94 |
Table 3.1: Result of Force Degradation study in Dabigatran etexilate mesylate
In the study of limit of detection injected spiked solution of impurities, we observed the chromatograms and conclude the System suitability criteria of DAB peak is pass. The result of LOD is given in Table 4.
| Name of impurity | LOD (%w/w) | Area of injection-1 | Area of injection-2 | Area of injection-3 |
|---|---|---|---|---|
| DAB Impurity-A | 0.01 | 2069 | 1930 | 1906 |
| DAB-2B | 0.01 | 1380 | 1359 | 1270 |
| DAB Impurity-C | 0.01 | 1362 | 1188 | 1067 |
| DAB Impurity-H | 0.01 | 1531 | 1460 | 1513 |
| DAB Impurity-D | 0.01 | 1208 | 1129 | 1147 |
| DAB Impurity-E | 0.01 | 1100 | 1336 | 1305 |
| DAB Impurity-K | 0.01 | 1190 | 1124 | 1169 |
| DAB Impurity-J | 0.01 | 1938 | 1766 | 1948 |
| DabigatranEtexilateMesylate | 0.01 | 2914 | 2286 | 3114 |
| DAB Impurity-G | 0.01 | 1656 | 1273 | 1334 |
Table 4: Result of the study of Limit of detection
In presented study author Determined the limit of quantification (LOQ) of DAB (un-known impurity) by the analysis of samples with known concentrations of analyte by establishing the concentration which will give a concentration of about 3.0 times of LOD with a RSD of 10% for peak area of DAB peak. The %RSD of 6 replicate injection of spiked sample is less than 4% , all the results of LOD is tabulated in Table 4. The results of LOQ (LOQ for all known impurities and DAB peak is 0.03%) determination indicate that the method is capable of quantitatively determining analytic in a sample with suitable precision and accuracy.
The correlation coefficient obtained was greater than 0.999 for all the impurities and for DAB. This shows that an excellent correlation existed between the peak area and the concentration of impurity A, impurity B, impurity C, impurity D, impurity E, Impurity G, Impurity H, Impurity J, Impurity K and DAB. Calculate the relative response factor form the linearity curve that is shown in Table 5.
| Name of impurity | LOQ (%w/w) | Area of inj. -1 | Area of inj. -2 | Area of inj. -3 | Area of inj. -4 | Area of inj. -5 | Area of inj. -6 | % RSD |
|---|---|---|---|---|---|---|---|---|
| DAB Impurity-A | 0.03 | 5432 | 5435 | 5448 | 5420 | 5541 | 5547 | 1.05 |
| DAB-2B | 0.03 | 3759 | 3720 | 3670 | 3626 | 3653 | 3633 | 1.43 |
| DAB Impurity-C | 0.03 | 3760 | 3750 | 3716 | 3843 | 3750 | 3656 | 1.64 |
| DAB Impurity-H | 0.03 | 4608 | 4635 | 4669 | 4451 | 4563 | 4514 | 1.77 |
| DAB Impurity-D | 0.03 | 3388 | 3488 | 3349 | 3327 | 3373 | 3428 | 1.71 |
| DAB Impurity-E | 0.03 | 4002 | 3873 | 3767 | 3896 | 3821 | 3893 | 2.04 |
| DAB Impurity-K | 0.03 | 3953 | 3892 | 3824 | 3949 | 4069 | 4035 | 2.28 |
| DAB Impurity-J | 0.03 | 3403 | 3358 | 3504 | 3331 | 3443 | 3478 | 1.99 |
| DabigatranEtexilateMesylate | 0.03 | 2910 | 2883 | 2805 | 3031 | 2907 | 3032 | 3.03 |
| DAB Impurity-G | 0.03 | 6703 | 6792 | 6804 | 6789 | 6989 | 6899 | 1.46 |
Table 5: Result of the study of Limit of Quantization
Linearity result shows in Table 6 that indicate Correlation co-efficient is not be less than 0.99 for all known impurities and Dabigatran Etexilate Mesylate peak .The % y-intercept as obtained from the linearity data in range of ± 3 for all impurities as well as for the Dabigatran Etexilate Mesylate . So results indicate that the method has ability to generate responses which are directly proportional to the concentration of analytes present in the sample (Figure 4). The Accuracy result is shown in Table 7. All the results indicate that the method has expressed the closeness of agreement between observed value and true value. Hence, Accuracy has been established across the specified range (LOQ to 150%) of analytical method.
| Name | Limit of detection (%w/w) | Limit of quantitation (%w/w) | Retention time (minutes) | Relative retention time | Relative response factor | Co-relation coefficient (R2) |
|---|---|---|---|---|---|---|
| DAB Impurity-A | 0.01 | 0.03 | 2.88 | 0.09 | 1.30 | 1.0000 |
| DAB-2B | 0.01 | 0.03 | 10.34 | 0.34 | 0.91 | 0.9962 |
| DAB Impurity-C | 0.01 | 0.03 | 14.83 | 0.48 | 0.93 | 1.0000 |
| DAB Impurity-H | 0.01 | 0.03 | 15.84 | 0.52 | 1.42 | 1.0000 |
| DAB Impurity-D | 0.01 | 0.03 | 16.53 | 0.54 | 0.93 | 0.9999 |
| DAB Impurity-E | 0.01 | 0.03 | 22.20 | 0.73 | 0.95 | 1.0000 |
| DAB Impurity-K | 0.01 | 0.03 | 25.91 | 0.85 | 0.96 | 0.9979 |
| DAB Impurity-J | 0.01 | 0.03 | 26.97 | 0.88 | 0.86 | 0.9958 |
| DabigatranEtexilateMesylate | 0.01 | 0.03 | 30.62 | 1.00 | 1.0 | 0.9832 |
| DAB Impurity-G | 0.01 | 0.03 | 36.97 | 1.21 | 1.70 | 0.9895 |
Table 6: Result of Linearity and relative response factor for all impurities
| S no. | Name of Impurity/ Analyte | Accuracy @ % LOD Level | Accuracy @ 50% Level | Accuracy @100% Level | Accuracy @150% Level |
|---|---|---|---|---|---|
| 1. | DAB Impurity-A | 109.52 | 115.23 | 91.85 | 115.55 |
| 2. | DAB Impurity-B | 114.94 | 110.96 | 113.56 | 111.62 |
| 3. | DAB Impurity-C | 103.57 | 110.33 | 111.50 | 114.55 |
| 4. | DAB Impurity-D | 109.88 | 110.78 | 115.93 | 110.05 |
| 5. | DAB Impurity-E | 95.44 | 113.51 | 113.15 | 111.59 |
| 6. | DAB Impurity-H | 101.45 | 112.87 | 113.57 | 115.88 |
| 7. | DAB Impurity-K | 113.10 | 109.52 | 114.09 | 116.19 |
| 8. | DAB Impurity-J | 113.79 | 115.74 | 116.43 | 112.29 |
| 9. | DAB Impurity-G | 110.34 | 112.33 | 115.63 | 115.75 |
Table 7: Mean (n=3) Result of Accuracy @ different level with respect to specification level
The relative standard deviation was calculated during the study of precision and all the obtained observations given under the Table 8 that concludes that method is precise.
| S no. | Name of Impurity/ Analyte | % Mean (n=6) of each Impurity | %RSD (n=6) of total Impurity |
|---|---|---|---|
| 1. | DAB Impurity-A | 0.128 | 1.618 n=6 Preparation |
| 2. | DAB Impurity-B | 0.164 | |
| 3. | DAB Impurity-C | 0.225 | |
| 4. | DAB Impurity-D | 0.128 | |
| 5. | DAB Impurity-E | 0.265 | |
| 6. | DAB Impurity-H | 0.132 | |
| 7. | DAB Impurity-K | 0.160 | |
| 8. | DAB Impurity-J | 0.166 | |
| 9. | DAB Impurity-G | 0.194 |
Table 8: Mean (n=6) Result of precision of six different preparations
Under the intermediate precision calculate the % content of all DAB impurities and total impurities was found to be below quantification level even when it is performed on a different instrument. The method is said to be precise with respect to the criteria of the intermediate precision. Obtained result shown in Table 9.
| Preparation | Total impurities (%) | |
|---|---|---|
| Analyst-1 | Analyst-2 | |
| Preparation-01 | 1.625 | 1.664 |
| Preparation-02 | 1.611 | 1.668 |
| Preparation-03 | 1.614 | 1.666 |
| Preparation-04 | 1.612 | 1.664 |
| Preparation-05 | 1.622 | 1.664 |
| Preparation-06 | 1.625 | 1.664 |
| Mean | 1.618 | 1.665 |
| % RSD | 0.41 | 0.10 |
| Cumulative mean | 1.642 | |
| Cumulative %RSD | 0.40 | |
| Acceptance criteria for %RSD | Not more than 10.0% | |
Table 9: Result of Intermediate precision
The results of robustness study indicate that the method is capable of demonstrating its capacity to remain unaffected by small variations in method parameters and provided an indication of its reliability during normal usage. All the result of robustness study summarized under the Table 10.
| S. No. | Name of component | Resolution | |||||
|---|---|---|---|---|---|---|---|
| Idea condition | Flow decrease | Flow increase | Temp. decrease | Temp. increase | Column change | ||
| 1 | DAB Impurity-A | - | - | - | - | - | - |
| 2 | DAB-2B | 38.83 | 36.91 | 37.87 | 39.15 | 37.40 | 34.00 |
| 3 | DAB Impurity-C | 21.34 | 20.13 | 21.80 | 21.47 | 21.97 | 21.54 |
| 4 | DAB Impurity-H | 4.15 | 4.04 | 3.31 | 4.58 | 3.91 | 3.83 |
| 5 | DAB Impurity-D | 3.13 | 2.73 | 3.41 | 2.97 | 3.11 | 3.21 |
| 6 | DAB Impurity-E | 26.79 | 24.38 | 26.67 | 26.48 | 25.89 | 27.29 |
| 7 | DAB Impurity-K | 16.62 | 15.24 | 16.97 | 15.93 | 16.00 | 16.92 |
| 8 | DAB Impurity-J | 4.59 | 4.23 | 4.41 | 4.48 | 4.37 | 4.66 |
| 9 | DabigatranEtexilateMesylate | 4.43 | 4.15 | 4.24 | 4.46 | 4.18 | 4.59 |
| 10 | DAB Impurity-G | 18.76 | 17.22 | 17.87 | 19.32 | 18.17 | 19.35 |
| S. No. | Name of component | Resolution | |||||
| Idea condition | Flow decrease | Flow increase | Temp. decrease | Temp. increase | Column change | ||
| 1 | DAB Impurity-A | - | - | - | - | - | - |
| 2 | DAB-2B | 38.83 | 36.91 | 37.87 | 39.15 | 37.40 | 34.00 |
| 3 | DAB Impurity-C | 21.34 | 20.13 | 21.80 | 21.47 | 21.97 | 21.54 |
| 4 | DAB Impurity-H | 4.15 | 4.04 | 3.31 | 4.58 | 3.91 | 3.83 |
| 5 | DAB Impurity-D | 3.13 | 2.73 | 3.41 | 2.97 | 3.11 | 3.21 |
| 6 | DAB Impurity-E | 26.79 | 24.38 | 26.67 | 26.48 | 25.89 | 27.29 |
| 7 | DAB Impurity-K | 16.62 | 15.24 | 16.97 | 15.93 | 16.00 | 16.92 |
| 8 | DAB Impurity-J | 4.59 | 4.23 | 4.41 | 4.48 | 4.37 | 4.66 |
| 9 | DabigatranEtexilateMesylate | 4.43 | 4.15 | 4.24 | 4.46 | 4.18 | 4.59 |
| 10 | DAB Impurity-G | 18.76 | 17.22 | 17.87 | 19.32 | 18.17 | 19.35 |
Table 10: Robustness result in each condition
The analytical method used for determination of related substances in Dabigatran Etexilate Mesylate complies with the acceptance criteria of the analytical parameters such as System suitability, Specificity, Precision, Linearity, Accuracy, Range, Intermediate precision (Ruggedness), Robustness, Solution Stability and Mobile Phase Stability. As the carryover of Dabigatran Extexilate Mesylate peak has been observed and it is not impacting the analytical results, so Dabigatran Extexilate Mesylate peak area in the blank chromatogram has to be disregarded. Thus the method stands validated and can be used for routine analysis to determine the related substances of Dabigatran Etexilate Mesylate.
I am Thankful to the management of Micro Labs for providing the opportunity to all the facility and a part of this project.