Journal of Chromatography & Separation Techniques
Open Access
ISSN: 2157-7064
ISSN: 2157-7064
Research Article - (2013) Volume 4, Issue 9
Four sensitive and selective stability indicating methods for the determination of rivaroxaban (RIV) were developed. Method a was an isocratic RP-HPLC, good resolution between peaks corresponding to the degradates from analyte was achieved on C18 column. The mobile phase is 1.2% w/v potassium dihydrogen phosphate pH 3.5 ± 0.2 and acetonitrile (70:30, v/v). The detection was carried out at 280 nm. Method B depends on quantitative densitometric determination of thin layer chromatography TLC of rivaroxaban in the presence of it’s degradates without any interference. The developing system was chloroform-isobutyl alcohol (50:50 v/v).The chromatogram was scanned at 280 nm. Method C was based on the first derivative (D1) measurement of the drug at 237.4 nm; zero contribution point of its alkaline degradates. Method D was based on the resolution of the drug and its alkaline degradates by first derivative ratio spectra (DD1 successfully applied for the determination of rivaroxaban in bulk powder, pharmaceutical formulation and in presence of its alkaline degradates. The obtained results were statistically analyzed and compared with those obtained by the reported method
Keywords: Rivaroxaban; Alkaline degradates; RP-HPLC; TLC; First derivative; First derivative ratio spectra
RIVis5-chloro-N-({(5S)-2-oxo-3-[4-(3-oxomorpholin-4-yl) phenyl]-1,3-oxazolidin-5yl}methyl)thiophene-2-carbinoxamide [1], as shown below
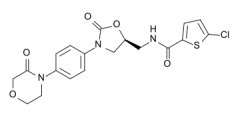
Molecular formula: C19H18ClN3O5S
Molecular weight: 435.9 g/mol
RIV is an oral anticoagulant inventedand manufactured by Bayer; it is marketed as Xarelto [2]. It is an oxazolidinone derivative anticoagulant that inhibits both free Factor Xa and Factor Xa bound in the prothrombinase complex [3]. It is a highly selective direct Factor Xa inhibitor with oral bioavailability and rapid onset of action. Inhibition of Factor Xa interrupts the intrinsic and extrinsic pathway of the blood coagulation cascade, inhibition both thrombin formation and development of thrombi.
RIV does not inhibit thrombin (activated Factor II), and no effect on platelets have been demonstrated [2]. Few methods have been reported for the determination of RIV in human plasma, including HPLC-tandem mass spectrometry (HPLC-MS/MS) [4,5], and HPLC in pharmaceutical formulation [6].
The novelty of research work was to develop a stability-indicating methods for the determination of RIV in presence of its alkaline degradates, and the developed methods were validated with respect to specificity, LOD, LOQ [7], linearity, precision, accuracy and forced degradation study was performed on the drug substance to show the stability-indicating nature of the methods, and also to ensure the compliance in accordance with Inter-national Conference of Harmonization (ICH) guidelines [8].
Reagents and standards
-All reagents and chemicals used were of analytical grade, and the solvents were of HPLC and spectroscopic grade.
- Acetonitrile HPLC grade & Methanol (SDFCL).
- Isobutyl alcohol, chloroform (Fisher Scientific).
- Orthophosphoric acid, sodium hydroxide (Adwic).
- Hydrochloric acid (Riedel–de Häen).
- Potassium dihydrogen orthophosphate (Winlab).
-The water for HPLC was prepared by double glass distillation and
filteration through a 0.45 μm member filter.
Rivaroxaban was kindly supplied by BAYER, Cairo Egypt; its purity was 99.08% ± 1.1 according to the re-ported HPLC method [6].
Xarelto tablets® are labeled to contain 10 mg of rivaroxaban per tablet and manufactured by Bayer, Cairo, Egypt. Batch No. BXFT1R1.
Instruments
-HPLC Agilant 1200 series was equipped with a model series ED4567677LC quaternary pump, Rheodyne injector Lot ID 7725 with a 20 μL loop and UV detector DE71360313. Separation and quantitation were made on column phenomenex-C18, 4.6×150 mm, 5 μm particle size serial number: USK367776-4(Germany).
- The detector was set at λ=280 nm. The instrument was connected to an IBM compatible PC and HP disk jet printer.
-Densitometer-dual wave length SHIMADZU flying CS-9301.
The instrumental parameters were: λ at 280 nm, photo mode: reflection, scan mode: zigzag and swing width: 16.C
-A double beam UV-visible spectrophotometer (Shimadzu, Japan) model UV-1601 PC with quartz cell of 1 cm path length, connected to IBM Compatible computer and a HP 600 inject printer was used. The spectral band width was 2 nm and the wave-length scanning speed was 280 nm. The absorbance spectra of the test and reference solution were recorded over the range of 200-400 nm. The first derivative and derivative ratio were obtained using the accompanying software with Δλ=4 and scaling factor=10.
-TLC plates Pre-coated with silica Gel GF254, 0.25 mm thickness, (E.Merck Darmstadat, Germany).
-UV lamp-short wave length 254 nm.
-Mass spectrometer Jeol JMS–A×500 Shimatzu, Japan.
-FTIR spectrometer analytical, Nicolet 6700 (Thermo fisher scientific).
-pH meter HANAA 8417 (Portugal).
-Sonicator, Bandelin-Sonorex TK (Germany).
- Centrifuge Hettich (Germany).
Chromatographic condition
For HPLC method: Analysis was carried out on Agilent 1200 series instrument. The elution was monitored at 280 nm. Separation was achieved by using column phenomenex (4.6×150 mm, 5 μm) with mobile phase of (70:30, v/v) mixture of 1.2% w/v potassium dihydrogenorthophosphate; pH 3.5 ± 0.2 adjusted with orthophosphoric acid if necessary and acetonitrile. The mobile phase was filtered using 0.45 μm disposable filter (Millipore, Milford, MA), and degassed by ultrasonic vibration prior to use. The flow rate of the mobile phase was 1.5 ml/min. 20 μl of sample solution was injected.
For TLC method: The TLC plates were developed in chloroform: isobutyl alcohol (50:50 v/v) as a developing system. For detection and quantitation, 5 μl of different concentration of standard solutions within the quantitation range were applied as separate compact spots 15 mm. apart and 20 mm, from the bottom of the plate using 25 μl Hamilton analytical syringe. The plate was developed 16 cm in usual ascending way. The chromatographic jar was saturated with the developing system for 1 hour. After elution, the plate was air dried and scanned at 280 nm, as under the described instrumental parameters.
Preparation of alkaline degradates: The degradates were laboratory prepared according to the following method. In 100 ml stopper conical flask, 25 ml of 2 M aqueous sodium hydroxide solution was added to 50 mg of RIV and refluxed for 10 hours .The solution was cooled at room temperature, then neutralized with 2 M hydrochloric acid filtered if necessary, concentrated to 2 ml, transferred to 10 ml volumetric flask and diluted to the volume with acetonitrile. The solution was tested for complete degradation by TLC using the chromato-graphic condition described above. The band corresponding to the degradation products were visualized under UV light at 254 nm, scratched and extracted with acetonitrile. The extracts were filtered and evaporated to dryness on a boiling water bath. The residue left after evaporation was used to prepare (1.0 mg) in acetonitrile stock degradation solution. Further dilutions were carried out with the same solvent for the laboratory prepared mixtures solutions, and as in the proposed methods for HPLC, TLC, D1 and DD1. The structure of the degradates was elucidated using IR and mass spectroscopy methods.
Stock standard solutions: -1.00 mg/ml in acetonitrile for HPLC and TLC methods.
-400.00 μg/ml in acetonitrile for D1 and DD1.
Working standard solutions: -200.00 μg/ml in mobile phase for HPLC methods.
-64.0 μg/ml in acetonitrile for D1 and DD1 methods.
Laboratory prepared mixtures: From both standard solutions, aliquots of RIV and its alkaline degradates were accurately transferred into series of 10 ml volumetric flasks, to prepare different mixtures containing 10-90% of the alkaline degradates, and the volume of each flask was completed with the same solvent used in the proposed methods.
Construction of calibration curve
HPLC method: Aliquotes of RIV working standard solution (200.0 μg/ml), in the mobile phase equiva-lent to (100.0-1200.0 μg) accurately transferred into a series of 10 ml volumetric flaskes, the volume was com-pleted to the mark with the mobile phase. Triplicate 20 μl injection of each concentration was chromatographed under the condition described above. The peak area of each concentration was plotted against the corresponding concentration to construct the calibration curve, and then the regression equation was computed.
TLC method: Aliquotes of RIV stock standard solution (1.0 mg/ml) in acetonitrile equivalent to (0.5-4.5 mg), were accurately transferred into a series of 5 μl volumetric flask and the volume was completed to the mark with acetonitrile. 5 μl of each solution was applied to TLC plate (20 cm×20 cm), as separated spots. Triplicate applications were made for each solution and the plate was chromatographed as mentioned above. The spots were scanned with the spectrodensitometer at 280 nm. The peak area of each concentration was plotted against the corresponding concentration to construct the calibration curve, and then the regression equation was computed.
Spectrophotometric method: For (D1) Aliquotes of RIV working standard solution (64.0 μg/ml) in acetonitrile equivalent to (16.0-224.0 μg) were accurately transferred into a series of 10 ml volumetric flasks, and the volume was completed to the mark with acetonitrile. The amplitude of (D1) values using acetonitrile as a blank were measured at 237.4 nm. The calibration curve was constructed then the regression equation was computed.
For (DD1) Aliquotes of RIV working standard solution (64.0 μg/ ml) in acetonitrile equivalent to (16-224 μg) were accurately transferred into a series of 10 ml volumetric flasks, the volume was completed to the mark with acetonitrile. Spectra of these solutions were divided by the spectrum of (20.0 μg/ml) in acetonitrilee as a divisor of alkaline degradates. The (DD1) values were calculated at 236 nm for the obtained spectra with Δλ=4 and a scaling factor=10. The calibration curve was constructed then the regression equation was computed.
Pharmaceutical formulation preparation
Ten tablets of Xarelto® tablets were accurately weighed and finely powdered. A portion of the powder equivalent to 50.0 mg of RIV was transferred into 50 ml volumetric flask, dissolved in 30 ml acetonitrile with the aid of ultrasonic bath for 20 minutes. A sufficient quantity of acetonitrile was added to produce 50 ml. The solution was centrifuged for 20 minutes at 3500 rpm and then filtered; the final concentration (1.0 mg/ml). Further dilutions of the sample solution were carried out with the same solvent as in the proposed methods for HPLC and (D1, DD1) methods. The general procedures were completed as mentioned above. The concentrations of RIV were calculated from the corresponding regression equations.
Analysis of laboratory prepared mixtures
Each solution was analyzed as under the proposed methods and the concentration of the intact RIV was calcu-lated from the corresponding regression equations.
The proposed methods are stability-indicating methods. The complete degradation and separation of the degradates was confirmed with IR and Mass spectra. The International Conference of Harmonization (ICH) guideline entitled “stability testing of new drug substances and products" requires the stress testing to be carried out to elucidate the inherent stability characteristics of the active substance [8]. An ideal stability indicating method is one that quantifies the standard drug alone and also resolves its degradation products. RIV was subjected to alkaline hydrolysis with 2 M sodium hydroxide, complete degradation was observed, and this is confirmed by TLC using (20 cm×20 cm) aluminium plates GF254 and chloroform–isobutyl alcohol (50:50 v/v) was used as a developing system. The retardation factor, RF is defined as the ratio of the distance traveled by the center of a spot to the distance traveled by the solvent front. The values of the intact RIV and its degradates (A,B) were found to be 0.60 ± 0.02,0.86 ± 0.05 and 0.35 ± 0.01, respectively. The band of each degradates was scratched and extracted with acetonitrile. The extracts were filtered and evaporated to dryness on a boiling water bath. The residue left after evaporation was used for illucidation by IR and mass spectroscopy. The structure assigned for one of the degradates (A) was confirmed through the formation of violet color with ninhydrin reagent, where a violet color was produced, indicating the presence of a free amino group. The IR spectrum of the degradate (A) (KBr) showed the appearance of broad band at 3453 cm-1, corresponding to the primary amino group and the degradate (B)showed the appearance of a band at 1735 cm-1 corresponding to the carbonyl group (Figure 1). Also the structures of the degradates were confirmed by mass spectroscopy (with up to n=3). In degradate (A) the m/z value was 251, and in degradate (B), the m/z value was 144 (Figure 2). Therefore, one conclude that the alkaline hydrolysis of RIV may proceed as shown below

Figure 1a: IR spectra of RIV.

Figure 1b: IR spectra of degradation A.

Figure 1c: IR spectra of degradation B.

Figure 2a: Mass spectra of RIV.

Figure 2b: Mass spectra of degradation A.

Figure 2c: Mass spectra of degradation B.
HPLC method
Several trials had been carried out to obtain a good resolution of the drug and its alkaline degradates. These trials involved the use of different mobile phases with different ratios, different pH and flow rates. The best resolution with sharp and symmetric peaks were obtained upon using orthophosphate pH 3.5 ± 0.2 adjusted with orthophosphoric acid and acetonitrile. The flow rate was 1.5 mL min-1. The retension time of RIV, degradates A and B were found to be 8.5 ± 0.01, 5.3 ± 0.01, 4.2 ± 0.02, respectively, as shown in Figure 3.

Figure 3: HPLC chromatogram of mixture of rivaroxaban (C) and its alkaline degradates (A&B), 10.00 μg/ml of each, and showing complete degradation.
System suitability of the procedure was shown in Table 1. Characteristic parameters for regression equation and correlation coefficient obtained by least square treatment of the results were given in Table 2, and the corresponding concentration in the range 10-120 μg mL-1, from which the regression equation was computed as shown in Table 2.
| Parameters | Timolol maleate | Bimatoprost | Timolol maleate degradate | Bimatoprost degradate | Reference values | |
|---|---|---|---|---|---|---|
| Resolution | 5.70 | 4.90 | >1.5 | |||
| Tailing factor (T) | 1.20 | 1.40 | 1.10 | 1.00 | <1.5 | |
| Capacity factor (K) | 1.83 | 6.22 | 8.26 | 8.25 | >1 | |
| Selectivity (α) | 3.40 | 1.33 | 1.30 | 1-10 | ||
| Theoretical plates(N) | 12641 | 11315 | 14532 | 10248 | >3000 | |
| Retension time (min.) | 2.539 ± 0.01 | 7.224 ± 0.01 | 9.269 ± 0.01 | 13.892 ± 0.02 | _ | |
| HETP | 0.0019 | 0.0022 | 0.0017 | 0.0024 | Smaller the no., higher the efficiency | |
Table 1: System suitability parameters for determination of bimatoprost, timolol maleate and their alkaline degradates by HPLC proposed method.
| Method validation parameters | Bimatoprost | Timolol maleate | |
|---|---|---|---|
| D1 | HPLC | HPLC | |
| Linearity Slope Intercept Correlation coefficient(r) |
0.0004 0.0007 0.9999 |
34.59 0.7521 0.9999 |
77.669 7.5157 0.9999 |
| Linearity range (µg/ml) | 100.00-900.00 | 3.00-3.00 | 10.00-70.00 |
| Working range (µg/ml) Ringbom | 105.00-850.00 | 5.00-25.00 | 15.00-65.00 |
| Accuracy | 99.52 ± 1.329 | 100.84 ± 0.639 | 99.67 ± 0.915 |
| Standard error of slope | 0.001 | 196.98 | 12.47 |
| Confidence limit of slope | 0.336-0.289 | 335-302 | 78.385-77.688 |
| Precision Intraday Interday |
99.99 ± 0.242 100.44 ± 0.301 |
101.69 ± 0.247 98.94 ± 0.214 |
98.08 ± 0.712 100.76 ± 1.060 |
| L.O.D L.O.Q |
0.52 1.85 |
0.62 0.65 |
1.03 3.15 |
Intraday (n=3) average of three different concentration repeated three times within a day
Interday (n=3) average of three different concentration repeated three times in successive days
Ringbom % absorbence against logarithim of concentration
L.O.D limit of detection, L.O.Q limit of quantitation
Table 2: Validation results of the proposed method for bimatoprost alone and in presence of timolol maleate.
TLC method
The experimental conditions for TLC method as developing system, scan mode and wavelength of the detection were optimized to provide accurate and precise results for the determination of RIV in the presence of its degradates. The chosen scan mode with zigzag and the wavelength of scanning was 280 nm. The best separation of the studied drug and its degradates were obtained by using chloroformisobutyl alcohol (50:50 v/v) as a developing system. The RF values for intact RIV and its degradates (A,B), were found to be 0.60 ± 0.02, 0.86 ± 0.05 and 0.35 ± 0.01, respectively. A linear correlation was obtained between the area under the peak and the concentration (0.50-4.50 μg/ spot), as shown in Figure 4, and the regression equation was computed as shown in Table 2.

Figure 4: Scanning profile of thin layer chromatogram of RIV (0.50-4.50 μg/spot) at λ 280 nm chloroform-isobutyl alcohol (50:50 v/v) as mobile phase.
Spectrophotometric methods
First derivative (D1): The zero-order absorption spectra of RIV and its degradates showed severe over-lapping (Figure 5a). For this reason, the conventional UV spectrophotometry cannot be used in this case. However, zero-crossing first-order spectrophotometry is more selective and permits identification and determination of RIV in the presence of its degradates. Figure 5b shows the (D1) of RIV zerocrossing of its degradates. The selection of the optimum wavelength is based on the fact that the absolute value of the total derivatives spectrum at the selected wavelength has the best linear response to the analyte concentration. It is not affected by the concentration of any other components, and gives a near zero-intercept on the ordinate axis of the calibration curve. Therefore, determination of RIV at 236 nm (zero-crossing of its degradates) was chosen. Beers law was obeyed in concentration range (1.6-22.4 μg/ml), from which the linear regression equation was computed, as shown in Table 2.

Figure 5a: Zero order absorption spectra of 12.80 μg/ml RIV ( _____) and its alkaline degradates 12.80 μg/ml (…........), each in acetonitrile.

Figure 5b: First derivative of absorption spectra of 12.80 μg /ml RIV ( _____ ) and its alkaline degradates, 12.80 μg/ml (….........), each in acetonitrile.
First derivative ratio spectra (DD1): Mixtures of compounds with highly overlapped spectra have been resolved by the use of the ratio spectra with high accuracy [9-11]. The absorption spectra of RIV with different concentration were recorded in the range of 200-400 nm and stored in IBMPC. The stored spectra were divided by a spectrum of degradates 20.0 μg/ml. The ratio spectra were smoothed with Δλ=4 intervals (Figure 6a), and their first derivatives were traced with the same Δλ (Figure 6b). The concentration of RIV was determined by measuring the amplitude at λmax 234 nm. Some divisor concentrations were tested, which is very important factor in practice. The influence of the Δλ for first derivative ratio was tested and found very appropriate to use the values at Δλ=4. In this method, the concentration range (1.6-22.4 μg/ml) was used, from which the regression equation was computed as shown in Table 2.

Figure 6a: Ratio spectra of RIV (1.60-22.40 μg/ml) using alkaline degradates, 20.00 μg/ml as divisor in acetonitrile.

Figure 6b: First derivative ratio spectra of RIV (1.60-22.40 μg/ml), using alkaline degradates 20.00 μg/ml as divisor inacetonitrile.
The specificity of the proposed methods was assessed by the analysis of laboratory prepared mixtures, the results in Table 3, indicating that the proposed methods were not affected by the presence of degradates up to 90% of the degradates. Methods validation was performed according to the ICH guidelines [8], for all the proposed methods. Table 2 shows the results of linearity, accuracy, repeatability, precision and robustness of the proposed methods. The robustness of the method was evaluated by observing the influence of small variations of experimental variables, for example, the change of the pH of potassium dihydrogen orthophosphate pH 3.5 ± 0.2. This minor change that may take place during the experimental operation did not affect the absorption intensity, indicating the excellent robustness of the proposed method. The proposed methods were applied to determine of RIV in the commercial tablets. Five replicate determinations were done and satisfactory results were obtained in a good agreement with the tablets, which labeled to contain 10 mg/tablet, as shown in Table 4. The validity of the proposed methods was assessed by applying the standard addition technique, which showed accurate results, and there is no interference from excipients, as shown in Table 4. Statistical comparison of the sults of bulk powder obtained by the proposed methods and the reported HPLC method [6], was also done using student's t-test and F-ratio at 95% confidence level. It is clear that there is no significant difference between the proposed methods and the reported one with regard to accuracy and precision.
| Mixture number | BIM | TIM | BIM | TIM | ||||
|---|---|---|---|---|---|---|---|---|
| Taken (μg/ml) | Taken (μg/ml) | Found* (µg/ml) | Recovery% | Found* (μg/ml) |
Recovery% | |||
| Degradate | Intact drug | Degradate | Intact drug | |||||
| 1 | 3 | 30 | 10 | 70 | 29.95 | 99.83 | 70.70 | 101.00 |
| 2 | 5 | 20 | 10 | 60 | 19.68 | 98.40 | 59.75 | 99.58 |
| 3 | 10 | 10 | 20 | 40 | 10.01 | 100.01 | 39.20 | 98.01 |
| 4 | 20 | 10 | 50 | 20 | 10.12 | 101.24 | 19.97 | 99.87 |
| Mean±RSD% | 99.87 ± 1.015 | 99.52 ± 1.093 | ||||||
Average of three determination
Table 3: Determination of bimatoprost and timolol maleate in presence of their alkaline degradates in laboratory proposed mixture by proposed HPLC method.
| Parameter | Bimatoprost | Manufacturer’s HPLC Method | Timolol maleate | Official HPLC Method |
|---|---|---|---|---|
| Mean | 100.84 | 100.04 | 99.67 | 100.19 |
| SD | 0.644 | 0.776 | 0.912 | 1.074 |
| RSD% | 0.639 | 0.776 | 0.915 | 1.072 |
| n | 7 | 5 | 7 | 5 |
| Variance | 0.41 | 0.60 | 0.83 | 1.15 |
| Student’s test (2.22) | 0.11 | 0.69 | ||
| F Value (5.43) | 1.46 | 1.39 |
HPLC method using C18 column, mobile phase water: acetonitrile: methanol (72:18:10, by volume), flow rate 1.5 ml/min and detection was at λ210 nm. BIM
Table 4: Statistical comparison between the proposed HPLC, manufacturer’s and official methods for determination of bimatoprost and timolol maleate in drug substance.
In this paper, a sensitive, specific, accurate, precise validated and well defined stability, indicating HPLC, TLC, (D1) and (DD1) methods were investigated. The HPLC and TLC methods were found to be more sensitive than the spectrophotometric method. The HPLC was found to be more sensitive than the TLC method, while the later has the advantages of short run time, large sample capacity, and the use of minimal volume of solvent. The proposed methods were suitable for quality control laboratories, where economy and time are essential.