Journal of Chromatography & Separation Techniques
Open Access
ISSN: 2157-7064
ISSN: 2157-7064
Research Article - (2018) Volume 9, Issue 1
A new approach to the determination of the isotopic composition of nickel by the GC-MS method is proposed. This method has been used to investigation of four Ni-containing samples. The obtained data are generally consistent with the literature, but its accuracy is lower than in the traditional techniques.
Keywords: GC-MS determination; Nickel; Isotopic ratio; Thio carbamate complexes
The GC-MS determination of heavy metals and their compounds is limited in analytical chemistry due to the difficulty of conversion the metal to a volatile form. The most popular approaches are atomic adsorption, emission and ICP-MS techniques [1]. However, gas chromatography has the strong advantage because the mixture is separated before the measuring the analytical signal in this mode. Taking into account the increase in selectivity as a result of derivatization, GC-MS would be preferable technique for certain analysis. In this work we will discuss the determination of the isotopic composition of nickel in minerals and alloys. Most of these objects contain iron and copper. The masses of the isotopes of these elements partially coincide with the masses of nickel ones, so, the direct injection of solution to mass-analyzer does not allow to determine the nickel isotopic composition. This problem could be solved using high-resolution mass spectroscopy or tandem mass spectrometry, but these techniques are pretty expensive [2]. Analysis of a volatile nickel compound allows to use an ordinary quadrupole mass analyzer with an accuracy of determining the ion mass no more than 0.05 amu. We propose to use nickel diethyl dithio carbamate (C10H20N2S4Ni, Ni(DEDTC)2) as such compound. It is included in the NISTMS database (CAS No. 52610- 81-8) and its retention index is 3007 [3,4]. To prepare Ni(DEDTC)2, an aqueous solution of sodium diethyl dithiocarbamate (NaDEDTC) should be added to the slightly acidic solution of the nickel (II) salt. The precipitate of Ni(DEDTC)2 is easily extracted with chloroform. Similar compounds of the most other transitional metals are non-volatile, that allows to inject the extract directly into the chromatograph. Here we represent the results of this approach.
Although diethyl dithiocarbamates of most metals are nonvolatile, it is still worthwhile to separate these compounds. This reduces the contamination of the liner, eliminates excess peaks on the chromatogram and reduces the background and wear of the column. Usually an acidic solution obtained after the decomposition of the rock or alloy contains ions of aluminum, iron and copper. Iron and aluminum can be eliminated by the addition of excess ammonium hydroxide. Hydroxides of these metals form well-separated precipitates at pH 12-13. Then the filtrate is made up with a solution of acetic acid to pH=5 and a 10% solution of NH2OH*HCl as a reducing agent. This is a necessary step, since nitric acid is often used to decomposition of alloys, that leads to the formation of Ni (III), whereas we need Ni (II). To resulting filtrate (5-100 mL, pH=5), are added 5-10 mL of an aqueous 10-15% solution of NaDEDTC and 3-5 mL of chloroform.
The mixture is shaken in a separatory funnel until the aqueous layer become completely discolored. Then, the Ni(DEDTC)2 solution in chloroform is separated and analyzed. If the copper content in the initial solution is high, it can be preliminarily separated by metallic iron. In this case, we must use iron without nickel impurity. The NaDEDTC aqueous solution should be prepared before use and should be filtered through the "blue tape" filter to remove the elemental sulfur particles from the extract and avoid their excess chromatographic peaks. The chromatographic separation conditions are typical for the analysis of high-boiling compounds. The injector temperature is 230- 240°C, the interface is 240-260°C, the ion source one is 200°C. The separation is carried out in the temperature programming mode: the initial isothermal section is 50°C for 2-4 minutes, the top temperature is 250°C, rate is 10°C /min and the final isothermal section-10-15 min. The carrier gas is helium, the gas velocity in the column is 1 mL/min for a conventional HP-5MS column (30 m × 0.25 mm × 0.25 mkm). Split ratio can be set in the range of 10-20. The mass spectra are recorded under standard conditions: electron impact ionization 70 eV, the mass analyzer and the detector are tuned over the PFTBA vapor spectrum.
The injected volume of extract in split mode was usually 1 μL, when we used "splitless mode", the sample volume was set at 3 μL with a valve closing time of 1 min. GC-MS analyzes were performed on devices QP 2010 (Ultra and SE) (Shimadzu). Deconvolution of the mass spectrum was carried out according to standard algorithm in GC-MS solution program. Figure 1 shows two typical chromatograms for the total ion current of the same sample of Ni(DEDTC)2 extract. A sample with a large number of extraneous peaks was obtained without preliminary separation of nickel. We agree with the authors [3] who noted the decomposition of Ni(DEDTC)2 on the glass components of the chromatographic system. Serial mass spectrometers are usually equipped with glass liners, which leads to a sporadic disappearance of the Ni(DEDTC)2 peak at its low concentrations in the extract. The mass spectrum of this compound is presented in Table 1. It is very similar to that presented by the authors [3]. The only serious difference is the overestimated intensity of the fragment with M/z=355 in the NISTMS spectrum. The isotope base calculator in NIST [4] (like our measurements) gives its intensity 15% with respect to the intensity of the fragment M/z=354, whereas in the database this value is 20%. This is due to the saturation of the detector and the inevitable underestimation of the intensities of the strongest lines.

Figure 1:Typical chromatograms of Ni(DEDTC)2 extract in chloroform: 1-with preliminary separation of nickel from other metals, 2-without preliminary separation of nickel.
| M/z | I A.U. | M/z | I A.U. | M/z | I A.U. |
|---|---|---|---|---|---|
| 43 | 52 | 116 | 999 | 207 | 141 |
| 44 | 128 | 117 | 119 | 209 | 62 |
| 57 | 86 | 118 | 63 | 354 | 593 |
| 60 | 386 | 145 | 58 | 355 | 86 |
| 70 | 63 | 146 | 72 | 356 | 322 |
| 71 | 68 | 173 | 121 | 357 | 63 |
| 72 | 446 | 174 | 75 | 358 | 85 |
| 85 | 72 | 175 | 60 | -- | |
| 88 | 771 | 177 | 60 | -- | |
| 113 | 87 | 206 | 59 | -- |
Table 1: The intensities of the 27 major ions in the mass spectrum of the laboratory sample Ni(DEDTC)2.
The intensities of the molecular ions for the Ni(DEDTC)2 laboratory sample are as follows: 354 (100.00%), 355 (15.23%), 356 (56.84%), 357 (9.84%), 358 (14.10%), 359 (2.29%), 360 (2.98%).
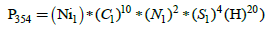
In nature, nickel is represented by five isotopes: 58Ni (68.27%), 60Ni (26.10%), 61Ni (1.13%), 62Ni (3.59%) and 64Ni (0.91%) [3]. Usually, the isotope ratios of the isotope with mass M to the content of the main isotope 58Ni are used in the calculations. For the standard sample: 60Ni/58Ni=0.382, 61Ni/58Ni=0.0166, 62Ni/58Ni=0.0526 and 64Ni/58Ni=0.0133. If the atomic percentages are divided by 100, we get the probability that a random nickel atom will have certain mass. In the absence of isotopic heavy atoms of other elements, the mass spectrum of the molecular ion Ni(DEDTC)2 + would be represented by the five peaks with masses: 354, 356, 357, 358 and 360, respectively, and the ratio of their intensities would be equal to the ratio of nickel isotopes. However, due to the presence of 13C (1.12%), 15N (0.365%), 33S (0.75%) and 34S (4.2%), the intensity distribution becomes more complicated. Thus, due to 13C, 15N and 33S, an ion with a mass of 355 appears, with intensity about 15% relative to the molecular ion, and the intensity of the 356 ion increases sharply due to the 34S contribution. The contribution from deuterium 2H (0.01%) to the intensity of all the ions except an ion with a mass 355 can be neglected. Calculation of the contributions of the individual isotope combinations to the total intensity of the low-resolution mass-spectrum line was carried out by an additive scheme. According to it, the intensity of the peak with the corresponding mass is directly proportional to the sum of the probabilities of formation of an ion with a given mass from any possible set of isotopes [5]. Let us introduce some notation: probabilities of nickel isotopes with the masses 58, 60, 61, 63, and 64 symbols designate as Ni1, Ni2, Ni3, Ni4 and Ni5, isotopes of carbon with masses of 12 and 13 mark as C1 and C2, hydrogen isotopes with masses of 1 and 2 mark as symbols H and D, isotopes of nitrogen with masses 14 and 15 as N1 and N2, and sulfur isotopes with masses 32, 33 and 34 mark as S1, S2 and S3. Then the probability of formation of a molecule with mass 354 is given by expression:
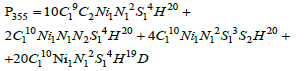
Mass 355 can result from any of four combinations: at first, all isotopes are light and only one carbon atom is 13C; at second, one atom of nitrogen is 15N; at third one atom of sulfur is 33S, and at least one atom of hydrogen is deuterium. Total probability is determined by the sum:
For subsequent calculations, we do not need the probabilities themselves, but their ratios to the probability of a basic molecular ion (M=354):
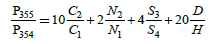
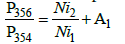
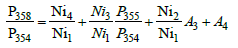
This equation is constructed by the terms, each of which is the product of the number of atoms of an element in the molecule by the ratio of the quantity of the corresponding heavy isotope to the light one. For mass 356, the number of possible variants increases. So, the gain of mass on 2 a.m.u. can be caused by the presence in the molecule not only 60Ni or 34S, but also of any two atoms from the set 13C, 15N, 33S, D. The corresponding formulae for P356/P354 takes the form:
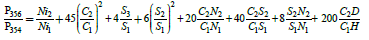 (1)
(1)
It is not a complete expression for the probability of an ion with a mass of 356, but the remaining terms are negligible. Indeed, the last term of 13C and D is 2.2 × 10⁻⁴. It corresponds to a difference in the content of the isotope 60Ni of only 0.2%. This value roughly corresponds to the current level of accuracy of measurement of isotope ratios. The numerical factors in formula (1) are equal to the number of independent combinations of heavy isotopes in a molecule with a given mass.
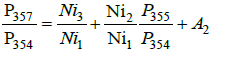
For the ratio P357/P354, the formula becomes more complex:
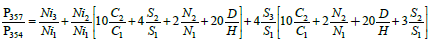
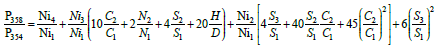
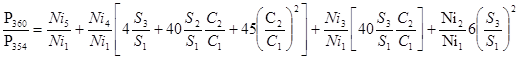
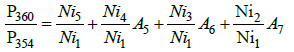
Here, terms from two nickel isotopes appear at first time. For subsequent relationships, such contributions become larger:
These four expressions can be presented in a simpler form:
 (2)
(2)
 (3)
(3)
 (4)
(4)
 (5)
(5)
If we assume that the ratios of the probabilities are equal to the ratios of the intensities of the corresponding peaks in the mass spectrum (for example  ) , then the system of linear equations (2-5) can be solved starting with equation (2). Coefficients Ai, like the ratio P355/ P354, can be found from the assumption that isotopic distributions of carbon, nitrogen, sulfur and hydrogen are standard.
Then we get:
P355/P354=0.15392, A1=0.18728, A2=0.02565, A3=A1, A4=0.01172, A5=A1, A6=0.02512, A7=A4.
The method discussed can be recommended to determination of nickel in rocks and alloys. Indeed, when 1 μL of 0.5 mg/mL solution is injected, the area of peak Ni(DEDTC)2 is 1500,000 a.u. The average area of "noise" peak is 1000. Thus, when we analyze sample in the split mode, we can record peaks of 10000 a.u. It is corresponding to a concentration of 3.3 μg/mL. If a mass of the initial sample is 1 g, then nickel content is being 3.3 ppm. The using of extract evaporation procedures, the transition "splitless" mode and registration of the chromatogram in the single ion monitoring regime, can reduce the detection limit at least 10,000 times. However, the destruction of the substance in the chromatographic system and the erosion of the Ni(DEDTC)2 peak must be taken into account. Thus, we propose to use this method for Ni concentrations more than 30 ppb.
We had taken areas under peaks with the corresponding masses as ion intensities in formulas (2-5). This approach is common in MSmeasurements in chromatographic systems.
The system of equations (2-5) makes possible to find the isotope ratios of the type (mNi/58Ni), where m is 60, 61, 62 or 64. In Table 2 the results of six determinations for a sample of nickel from our laboratory are presented. It can be seen that the average values of all ratios are close to the standard ones. The mean square deviation (dispersion, Ds) increases when the content of the corresponding isotope decreases. So, for 60Ni/58Ni Ds is about 0.5%, and for 62Ni/58Ni it is already 1.5%. For 61Ni/58Ni, Ds is 5%, and for 64Ni/58Ni it is 14%. For this reason, we excluded the group of 61Ni/58Ni and 64Ni/58Ni from further consideration. Moreover, the total content of the corresponding isotopes is 2%.
| N | 60/58 | 61/58 | 62/58 | 64/58 |
| 1 | 0.384 | 0.0184 | 0.0526 | 0.016 |
| 2 | 0.386 | 0.0196 | 0.0521 | 0.013 |
| 3 | 0.375 | 0.0193 | 0.0511 | 0.015 |
| 4 | 0.383 | 0.0195 | 0.0533 | 0.013 |
| 5 | 0.375 | 0.0214 | 0.0532 | 0.012 |
| 6 | 0.379 | 0.0157 | 0.0532 | 0.015 |
| Mean value | 0.380 | 0.019 | 0.0526 | 0.014 |
| NISTMS 2008 [4] | 0.382 | 0.0166 | 0.0526 | 0.0133 |
| J. Res. Nist [5] | 0.38518 ± 4 × 10⁻⁵ | 0.016740 ± 5 × 10⁻⁶ | 0.05338 ± 10-5 | 0.01361 ± 10-5 |
| Ds | 0.002 | 0.001 | 0.0004 | 0.002 |
Table 2: Isotopic ratios of nickel for 6 determinations of the laboratory sample Ni(DEDTK)2.
An important criterion of the precision of measurement is the ratio of the 355 and 354 mass intensities. This ratio is independent from the isotopic composition of nickel and is determined by the isotopic composition of other atoms only. When the detector is overloaded, this ratio can increase up to 0.2, and at low Ni(DEDTC)2 concentrations in the sample it falls to 0.12. Measurements should be carried out in the range of ratios 0.145-0.158. The table value is 0.153.
It can be noted that our data are much more scattered than those presented in Gramlich et al. [5]. Attempts to reduce the spread by using a different type of mass-spectrometers did not give a positive result. It was found that the quality of measurements is strongly influenced by the degree of wear and the history of the column. For reliable works, the column should be new and conditioned for at least 1 hour at temperatures of 250-280°C.
Figure 2 shows the average isotopic ratios for the four Nicontaining samples under our consideration. For a laboratory sample and a meteorite, deviations from the NistMs 2008 are close to the error of determination. However, pentlandite and millerite samples differs from the standard quite significant.

Figure 2: Isotopic ratios of the four Ni-containing samples: 1-J. Res. Nist [5], 2-laboratory sample, 3- pentlandite, Monchetundra, (Kola pen., Russia) 4- meteorit(kamacite), 5- millerite Saranovskoe (Russia), 6- NISTMS 2008 data for Ni [4]. Rectangle in the left upper corner of diagram shows Ds of our measurements. Samples 3-5 were provided by the St. Petersburg mining University museum.
Of course, the accuracy of our measurements is lower than ones in work [5]. But we believe that this method can be used for the fast and cheap control of isotope fractionation processes.