Journal of Chromatography & Separation Techniques
Open Access
ISSN: 2157-7064
ISSN: 2157-7064
Research Article - (2025)Volume 16, Issue 3
Anthocyanin has attracted much attention for exhibiting phytochemical activities such as anti-inflammatory, antioxidant and anticancer properties and has blood pressure lowering and liver protective effects. Hibiscus rosa-sinensis contains phytochemical compound anthocyanin which has therapeutic uses and can be used for medicinal purpose the objective of this study is to utilize this waste flower and extract phytochemical compounds from it using acidified water followed by its isolation using column chromatography and its characterization by TLC and paper chromatography technique.
Waste Hibiscus rosa-sinensis; Anthocyanin; Column chromatography; Phytochemical activities; TLC
Flowers have played a vital role in religious and cultural ceremonies for centuries and they hold a special place in the lives of people. In many cultures, flowers are used for decoration and religious purposes. However, after the ceremonies are over, the flowers are often thrown away which results in a lot of wastage. A report by UNFCCC (United Nation Framework Convention on Climate Change) says over 8 million tons of flowers are discarded in the river every year [1]. This project aims to highlight the potential benefits of utilizing these thrown away flowers such as Hibiscus rosa-sinensis flower constituent of phytochemical compound anthocyanin that can be extracted using various extraction method. This project aims to highlight the potential benefits of utilizing the flowers that are used in religious place for their medicinal properties.
Hibiscus flower contain anthocyanin, flavonoids, polyphenols that can lower blood pressure and reduce the risk of heart disease. Once the religious ceremonies are over, the flowers are thrown away which leads to waste, so instead of throwing them this flowers can be collected and dried. After drying, the flowers can be used to extract the bioactive and phytochemical compounds present in them. These compounds can be used to make herbal medicines, cosmetics and for other products. The utilization of these flowers can help reduce wastage and also provide a source of income for people involve in the extraction.
This can have positive impact on the society and also help in promoting the use of natural products.
In this paper we are going to extract one of these bioactive and phytochemical compounds such as anthocyanin from Hibiscus flowers (Figure 1).

Figure 1: Hibiscus rosa-sinensis.
Therapeutic uses of anthocyanin and flavonoids extract of Hibiscus flower
Anthocyanin is class of pigments found in many plants, including Hibiscus. They are responsible for the bright red, purple and blue color of flowers, fruits and vegetables. Anthocyanin’s have been found to have a range of potential health benefits including antioxidant, anti-inflammatory and anti-cancer properties [2].
Here are some therapeutic uses of anthocyanin extracts of Hibiscus:
Blood pressure regulation: Hibiscus anthocyanin has been found to have blood pressure lowering effects. Several studies have shown that drinking Hibiscus tea or taking Hibiscus extract supplements can help reduce blood pressure levels in the people with hypertension.
Cholesterol management: Hibiscus anthocyanin’s have been found to have cholesterol lowering effects. Studies have shown that Hibiscus extract supplements can help reduce total cholesterol and triglycerides level in the blood.
Anti-inflammatory properties: Hibiscus anthocyanin has been found to have anti-inflammatory effects. They may help reduce inflammation in the body, which is believed to play a role in many chronic diseases, including heart diseases, diabetes and cancer.
Anti-cancer properties: Some studies have suggested that Hibiscus anthocyanin may have anti-cancer properties. They may help inhibit the growth of cancer and reduce cancer cell death.
Liver health: Hibiscus anthocyanin’s have been found to have liver protective effects. They prevent liver damage caused by alcohol and other toxins.
Importance of Rf value
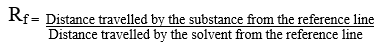
On the basis of Rf values we can identify and determine the different characteristics of a compounds. The Rf stands for retention factor value it is a unit less quantity it is a measure used in Thin Layer Chromatography (TLC) and paper chromatography to characterize and identify the compounds.
Here’s how the Rf value helps in the characterization of a compound:
Identification: Each compound has a characteristic Rf value under specific experimental conditions (such as the choice of stationary phase and solvent system). By comparing the Rf values of an unknown compound with those of known compounds, we can make a preliminary identification. If the Rf value of the unknown compound matches that of a known compound, it suggests that they may be the same substance.
Purity: The Rf can also indicate the purity of a compound. If a single compound is present in a sample, it should produce a single spot on the TLC plate or chromatographic paper. If impurities or more components are present in a compound, additional spots may appear. By comparing the Rf values of the main spot and impurity spots, we can assess the purity of compound.
Column chromatography
Principle: Column chromatography is used to separate the substances based on their different affinities. The principle of column chromatography is based on the partitioning of the substances between stationary phase and a mobile phase. In this technique a chemical compound is separated from a mixture. The lower affinity components travel faster and the higher affinity components moves slowly with respect to the stationary phase [3]. It consists of a glass tube. The rate at which the components move can be expressed as:
Stationary phase: A column is packed with a stationary phase material, stationary phase have good adsorption property and no hindrance is caused by the stationary phase in the flow of mobile phase. Stationary phase such as silica gel, alumina are used in column chromatography. Packing of column: Wool/ cotton or asbestos is used for the packing of the column. It is put inside the column glass tube and the bottom end is packed with it.
Two types of techniques are used to pack the column.
Mobile phase: The solvent also known as mobile phase or eluting agent. It can be a mixture of solvents of a definite ratio.
Applications
Methodology
Materials and equipment:
Chemicals
All the chemicals used are of AR grade.
Experimental procedure
For the extraction and isolation of anthrocynanins.
Extraction: Collect the Hibiscus flower and dry them. Weigh a suitable amount of dried Hibiscus flower and grind them to a fine powder. Take 20 gram of powdered flower, place it in a flask and fill with an extractant (acidified water). The flask is placed in a water bath at a temperature of 50°C kept for the optimum temperature [4].
Filtration: Filter the extract using a Whatman filter paper.
Column chromatography: The aqueous extract was passed through a column. The silica gel slurry was used for the wet packing of the column and cotton is used as a stationary phase with the elution solvent.
Elute the column with a mixture of water, methanol and acetic acid in the ratio of 50:50:1. Collect the elute in fractions (Figure 2).

Figure 2: Isolation of anthocyanin by column chromatography technique.
Thin Layer Chromatography (TLC)
Prepare TLC plate by applying stationary phase silica gel on the plates. The silica gel (stationary phase has fine particle size. Prepare a mobile phase (solvent system) consists of mixture of solvent BAW (n-butanol, acetic acid, water) in the ratio 4:1:2. Now spot the compound on TLC plate and put it into the TLC chamber containing mobile phase BAW.
Paper chromatography
Procure a Whatmann filter paper and mark a line at a distance of 3 cm from one of its end. Using a capillary mark, the spot of anthocyanin extract on to the chromatography paper.
Hang the chromatography paper in a jar containing 25 ml BAW solvent in the ratio 4:2:1. Remove the chromatography paper when the mobile phase (solvent) rises up the 2/3 of the length of the paper. Calculate the Rf value.
pH indicator test
Anthocyanin also works as a pH. Indicator as it shows red color in acidic medium and green color in basic medium. Add the anthocyanin extract in different pH solution in test tubes. Observe the different color of anthocyanin at different pH values.
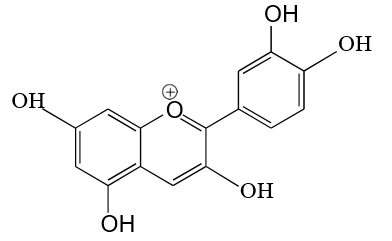
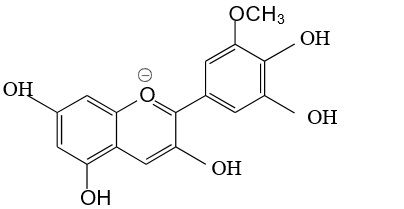
When two benzene rings are present along with the 2H-pyran ring then this structure is called Anthocyanidin (Figures 3 and 4).

Figure 3: Anthocyanidin basic structure.

Figure 4: Anthocyanin.
Anthocyanidin structure+another molecule such as sugar this combined structure is called anthocyanin.
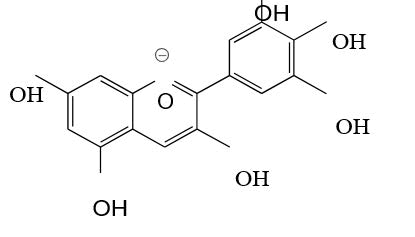
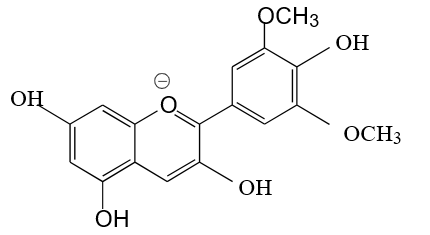
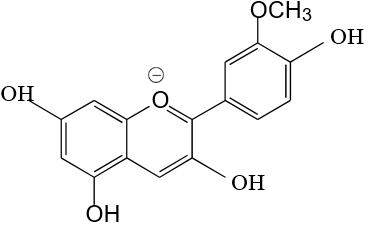
The R1 and R2 groups changes they can be OH, OCH3 any group. According to the variation in the R1 and R2 groups anthocyanidin can be of various types which are listed below in the Table 1.
| Anthocyanidin | R1 | R2 | Structure |
| Cyaniding | -OH | -H |
|
| Delphinine | -OH | -OH |
|
| Pelargonidin | -H | -H |
|
| Malvinidin | -OCH3 | -OCH3 |
|
| Peonidin | -OCH3 | -H |
|
| Petunidin | -OH | -OCH3 |
|
Table 1: Variation in the structure of anthocyanin.
Characterization of anthocyanin
Paper chromatography
Principle: Paper chromatography is a technique used for the separation of low molecular mass compounds. Due to its low cost and availability it is used for the separation of compounds, paper chromatography is considered a powerful analytical tool (Table 2). In the pores of the filter paper, water molecules are present which act as a stationary phase and the solvent act as a mobile phase. Depending upon the solubility the components dissolve less or more radially as the mobile phase passes through the sample spot and carries them along with it. Measure the distance travelled by the solvent front and the center of the different spots w.r.t the reference line. The Rf value can be calculated by using the formula (Figure 5) [5].
Calculations
From the Rf value for spot 3:
=9.3/10.1
=0.92
Rf value for spot 2:
=6.3/10.1
=0.62
Rf value for spot 1:
=2.2/10.1
=0.21

Figure 5: Paper chromatography.
|
S. no. |
Name of the extract anthocyanins |
Color of the spot |
Distance travelled by the components of the extract (cm) |
Distance travelled by the solvent |
Rf value |
|
1 |
Cyanidin-3-glucosyl-xyloside |
Orange |
2.2 |
10.1 |
0.21 |
|
2 |
Delphinidin-3-glucosyl-xyloside |
Magenta |
6.3 |
10.1 |
0.62 |
|
3 |
Carotenoid |
Peach |
9.3 |
10.1 |
0.92 |
Table 2: Chromatographic data of paper chromatography with BAW as a solvent system.
Thin layer chromatography
Principle: Thin layer chromatography depends on the principle of separation. It depends upon the relative affinity of the compounds. Mobile phase (solvent) moves over the stationary phase. The higher affinity compounds moves slowly while the other lower affinity compounds moves faster to the stationary phase (Table 3). After separation the components can be observed as spot on the TLC plate and the Rf value can be calculated by using the formula (Figures 6 and 7).

Figure 6: Thin layer chromatography plates prepared in laboratory.

Figure 7: Characterization of anthocyanin’s using TLC with BAW as a solvent system.
| Name of the extract anthocyanins | Color of the spot | Distance travelled by the components of the extract (cm) | Distance travelled by the solvent (mobile phase) (cm) |
Rf value |
| Carotenoids | Magenta | 5.2 | 7 | 0.74 |
| Delphinidin-3-glucosyl- xyloside | Pink | 4 | 7 | 0.57 |
Table 3: Chromatographic data of TLC with BAW as a solvent system.
pH test: Anthocyanin also works as a pH indicator as it changes its color in the different pH solutions. Anthocyanin shows red color in acidic medium and green color in basic medium (Table 4). On adding anthocyanin extract in different pH solutions in test tubes then change color has been observed (Figures 8 and 9) [6].

Figure 8: Color shift of anthocyanin.

Figure 9: pH data of anthocyanins.
| Serial no | pH | Color |
| 1 | 0.29 | Yellow |
| 2 | 0.78 | Orange |
| 3 | 1.07 | Coffee brown |
| 4 | 2.01 | Light pink |
| 5 | 4 | Red |
| 6 | 7 | Magenta |
| 7 | 9.77 | Smoke grey |
| 8 | 10.39 | Olive |
| 9 | 11.56 | Moss green |
Table 4: Anthocyanins pH.
Paper chromatography and thin layer chromatography
On the basis of Rf value through tells following characteristics of the compounds such as the chromatogram spots of TLC had magenta (A-with 0.72 Rf value) and pink (B-with 0.57 Rf value) shades. On the comparison with standard data, from TLC chromatogram it is predicted that the magenta color of the hibiscus extract corresponds to the presence of carotenoids and pink color of the hibiscus extract corresponds to the presence of the delphinidin as the major anthocyanin.
The chromatogram spots of paper chromatography had orange (A-with 0.21 Rf value), magenta (B-with 0.62 Rf value) and peach (C-with 0.92 Rf value) shades. On the comparison with standard data, from paper chromatogram it is predicted that the orange and magenta color of the hibiscus extract corresponds to the presence of cyaniding and delphinidin as the major anthocyanin. Also the peach color of the hibiscus extract indicates to the presence of carotenoids [7].
Color shift on different pH conditions
The color shift of a compound in different pH conditions can be used as a characteristic property to identify and characterize the compound. The color change observed in different pH. Conditions can provide initial clues about the compounds identity. By comparing the observed color shift with known pH. Dependent color changes of various compounds, we can make preliminary identifications. The color shift of anthocyanin in different pH conditions provide information about its structural and chemical properties [8].
Anthocyanin are natural pigments responsible for the vibrant red, purple and blue colors found in many plants in acidic conditions anthocyanin appear in red color, while in neutral conditions they exhibit pink or purple color and in basic conditions they appear in green or blue color [9].
The color shift of anthocyanin is directly linked to changes in their structure. In acidic conditions, anthocyanin is present in their flavylium cation form, which is responsible for the red color. At higher pH values, they undergo structural transformations to form various colored compounds. The color shift arises from changes in the number of hydroxyl groups and the presence of conjugated double bonds [10].
In conclusion, the extraction of anthocyanin in acidified water followed by their isolation using column chromatography and characterization using TLC, paper chromatography and chemical shift analysis in different pH conditions has provided valuable insights into the nature and properties of these pigments.
The extraction process in acidified water proved to be effective in efficiently extracting anthocyanin’s from the desired source material. Acidification helped in stabilizing the anthocyanin molecules, preventing degradation and preserving their structural integrity. This method allowed for the isolation of a concentrated extract containing a diverse range of anthocyanin’s. The isolation of anthocyanin’s using column chromatography was successful in separating the individual compounds present in the extract. To assess the purity and composition of the isolated anthocyanin’s, TLC and paper chromatography were employed. These techniques allowed for the visualization of individual components and determination of their relative migration distances. By comparing the obtained results with known standards or reference compounds, the identity and purity of the isolated anthocyanin’s could be confirmed. Moreover, the chemical shift analysis of the anthocyanin’s in different pH conditions provided valuable information regarding their structural characteristics and behavior in different environments. By subjecting the anthocyanin’s to varying pH levels, their protonation and deprotonation patterns could be investigated, shedding light on their acid-base properties and potential applications.
Overall, the combination of extraction in acidified water, column chromatography, TLC, paper chromatography and chemical shift analysis has proven to be a comprehensive approach for the extraction, isolation and characterization of anthocyanin’s. These methods contribute to our understanding of the chemical nature, composition and behavior of these pigments, opening up avenues for further research and applications in various fields such as food science, pharmaceuticals and natural products chemistry.
This research received no external funding.
No new data were created or analyzed in this study. Data sharing is not applicable to this article.
The authors declare no conflicts of interest.
[Crossref] [Google Scholar] [PubMed]
Citation: Saini R, Rastogi A, Jangir M (2025) Extraction and Isolation of Anthocyanin from Waste Hibiscus Flower Using Column Chromatography and its Characterization. J Chromatogr Sep Tech. 16:619.
Received: 30-May-2024, Manuscript No. jcgst-24-31764; Editor assigned: 04-Jun-2024, Pre QC No. jcgst-24-31764 (PQ); Reviewed: 18-Jun-2024, QC No. jcgst-24-31764; Revised: 13-May-2025, Manuscript No. jcgst-24-31764 (R); Published: 20-May-2025 , DOI: 10.35248/2157-7064.25.16.619
Copyright: © 2025 Saini R, et al. This is an open-access article distributed under the terms of the Creative Commons Attribution License, which permits unrestricted use, distribution, and reproduction in any medium, provided the original author and source are credited.