Journal of Hotel and Business Management
Open Access
ISSN: 2169-0286
ISSN: 2169-0286
Research Article - (2022)Volume 11, Issue 1
This research aims to apply an Internet of Things (IoT) technology to create an instrument which can be used to measure and display electric energy consumption, called Smart meter. As well as, to assess a technology and economic impact of solar cell installation system from designed system which was a smart meter that can measure and record electric energy consumption. For user who wants to reduce energy costs, smart meter can evaluate a payback period of solar cell installation system which detect electric energy consumption by non-contact sensor then connect the Wi-Fi and 3G network to display the consumption results on web browser and Line notify at a specified time. The display as real-time graph consists of current, voltage, frequency, power, and the results of electric energy consumption. The system was settled in six residences (Scenario I to VI) as case studies. The peak load of Scenario I to VI shown as 71.72, 51.42, 60.94, 49.01, 37.07, and 33.35 kWh/day respectively. The results from designed smart meter were derived to calculate installed power generation capacity of solar cell which appropriate for six scenarios. The maximum power of scenario I to VI are indicated as 13 kW, 9 kW, 11 kW, 7 kW, and 6 kW respectively. The economic impact assessment which represented by payback period are shown as 11.02, 10.83, 11.58, 12.84, 16.52, and 14.04 years, respectively. Consequently, the study is beneficial for user to decide the installation of solar call by payback period consideration.
Solar cell installation for power generation is still lack of an equipment to measure electric energy consumption. An electrical load has an effect on maximum power capacity calculation which required to meet daily energy consumption. Photovoltaic power generation installation systems are critical because it takes the electrical load of each household into account. Providing installed power exceeds demand, it has an effect on the system's investment cost. Thus, installing electrical parameter measuring tools to precisely record electricity consumption at various intervals will help in the computation and design of the solar power generation system for domestic use. When combined with the usage of an IoT system to store and transmit real-time data for information to entrepreneurs presenting solar power generating systems to customers, this enables entrepreneurs to be more transparent and connect more effectively with customers.
The smart meter is a new type of electric energy meter that was intended to replace conventional energy meters (turntable type) by reading the energy consumed by electronic circuits and transferring data in an electronic format. By connecting digitally to the control system, the smart meter can communicate directly with the control system as frequently as necessary. Power consumers will be able to read or calculate their energy consumption at any time. Communication channels can be picked from a variety of formats, including those that utilize a mobile phone network or those that utilize Radio Frequency (RF) communication. The authors selected to communicate over the Internet system via Wi-Fi and 3G networks for ease and a simple approach that works well today; users may read information from anywhere they have an Internet connection.
The purpose of this study is to determine the feasibility of using appropriate technology to measure and display electricity consumption data by utilizing an Internet of Things (IoT) system. As well as, to assist in reporting data via the internet and sending the value via the line notify application) by developing a system to detect electricity consumption without contact (Non-contact sensor) and to connect the display and a power supply (HEMs).
Design of the structural framework and connectivity system
All the system connectivity ranges from sensors, processors, internet connectivity, and line notify API connectivity, and web-based display designs by using a non-connected current metering module (non- invasive current sensor) and uses Esp 8266 as the main processor. This gadget includes a Wi-Fi module, which makes it simple to connect to the internet and to the server. By selecting efficient equipment, the system's circuit is kept basic and easy. As illustrated in Figure 1, this is a schematic representation of the system. The system's circuit diagram, as shown in Figure 2.

Figure 1: Schematic diagram of the system.

Figure 2: Electric energy metering device installation.
Installation of smart meter via the Internet of Things
Testing the system's operation by installing a smart meter via IoT to verify the system's ability and to display graph images and data through the application line throughout time. As depicted in Figure 3, the installation technique is quick and uncomplicated, and it includes;
1. Cover the sensor at the location of the to-be-measured wire with a single pole or wire (line).
2. Turn on the system's switch to enable it to connect to the Internet via the house's Wi-Fi network or via a 3G module.

Figure 3: Graph of energy consumption against time.
Electricity load calculation
The purpose of this research is to test the hypothesis regarding the electric power consumption of residences with varying electrical loads by examining the electric power consumption behavior of six residences that will serve as case studies. As illustrated in Table 1, each residence has distinct purposes and electrical loads [1,2].
| Type of Scenario | Electrical consumption activity/behavior | Duration of usage |
|---|---|---|
| Scenario-I | No one stays in the house during the day. The electrical load is capable of a maximum total power output of 15.91 kW and a maximum electrical power consumption of 71.72 kWh/day. | 05:00–08:30 น. |
| 10:00–15:30 น. | ||
| 17:00–21:30 น. | ||
| Scenario-II | Residential houses have permanent residents and large families and have a maximum power load of 13.92 kW and a maximum electrical power consumption of 51.42 kWh/day. | 05:00–08:30 น. |
| 10:00–15:30 น. | ||
| 17:00–21:30 น. | ||
| Scenario-III | Regular residents, small families with a maximum total power load of 15.32 kW and a maximum electrical power consumption of 60.94 kWh/day, reside in residential dwellings. | 05:00–08:30 น. |
| 10:00–15:30 น. | ||
| 17:00–21:30 น. | ||
| Scenario-IV | Regular residents, small families with a maximum total power load of 13.98 kW and a maximum electrical power consumption of 49.01 kWh/day, reside in residential dwellings. | 05:00–08:30 น. |
| 10:00–15:30 น. | ||
| 17:00–21:30 น. | ||
| Scenario-V | Regular residents, small families with a maximum total power load of 14.47 kW and a maximum electrical power consumption of 37.07 kWh/day, reside in residential dwellings. | 05:00–08:30 น. |
| 10:00–15:30 น. | ||
| 17:00–21:30 น. | ||
| Scenario-VI | Regular residents, small families with a maximum total power load of 13.03 kW and a maximum electrical power consumption of 33.35 kWh/day, reside in residential dwellings. | 05:00–08:30 น. |
| 10:00–15:30 น. | ||
| 17:00–21:30 น. |
Table 1: Household energy usage characteristics.
According to Table 1, power usage can be classified into three distinct periods: The first period runs from 5:00 am. until 8:00 am. It is the time of day when residents awaken and ready to depart for work. Some families must send their children to school while also getting up to perform various activities such as washing, cooking, and so on. From 10:00 a.m. to 3:30 pm., the second period is held. During this particular period, some residents choose to remain at home. The majority of activities are watching movies, listening to music, cleaning the house, and having relatives visit, while the final period between 17:00 and 21:30 is when residents return from work and children leave school. Everyone came home to unwind and enjoy time with their family.
Solar cell-based power generating system design
Using software to assist in the design of solar photovoltaic power generating systems has aided in making the design more accessible and easier to use for operators and consumers when making the decision to purchase a solar cell system. Thus, the following design procedures apply to the calculation and designation of a solar cell system:
1. Calculate the quantity of electrical energy required each day, the amount of electrical energy consumed by electrical equipment (Wh), and then add it to the energy lost through wires and batteries to get the required daily energy. as defined by equation-1 [2];

When Pday is the amount of energy that the system must generate on a daily basis (Wh/day)
PLoad is the required power by all electrical appliances per day (Wh/day)
Loss is the drained energy from the system (1000 watts appliances and 300 watts of power lost in the system).
2. Determine the maximum daily power output of the district's whole solar panel system. Thailand is characterized by a tropical climate. As defined by equation (2,3) [2];
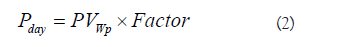
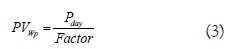
When Pday is the amount of energy that the system must generate on a daily basis (Wh/day).
PVWp is the maximum power of the entire panel (Wp)
Factor is panel generation factor (Thailand area is 4.5 kWh/day)
3. Calculation of the required number of solar panels
To assemble the system using the relationship defined in equation-4 [2];
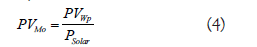
When PVMo is the number of solar panel
PVWp is the maximum electricity of the whole system (Wp)
PSolar is the solar energy (Thailand area is 4.5 kWh/day)
4. Calculation of the size of the inverter (Inverter)
The inverter's size should be sufficient to supply electricity to all electrical equipment, as shown by the relationship in equation-5 [2];

Electricity consumption measurement in residential buildings
Installing smart meter devices via an IoT system to monitor the amount of electricity utilized in six residential buildings in order to determine each house's electrical load. The amount of power consumed each day, separately for each residential, is presented in Table 2 under the provided circumstance.
| No. | House | Energy consumption (kWh/day) |
|---|---|---|
| 1 | Scenario-I | 71.72 |
| 2 | Scenario-II | 51.42 |
| 3 | Scenario-III | 60.94 |
| 4 | Scenario-VI | 49.01 |
| 5 | Scenario-VI | 37.07 |
| 6 | Scenario-VI | 33.35 |
Table 2: The electrical load (Energy consumption) of each house.
Calculation of electricity generated by a solar cell system
Maximum demand data was collected in each household and transmitted to the user via a line notify for analysis and solar cell system design. Additionally, it can predict the amount of energy that could be created by renewable energy. The electricity generation from solar cells can be calculated by the maximum electrical load in each house. According to the results, scenarios I through VI have a maximum power output of 13 kW, 9 kW, 11 kW, 7 kW, and 6 kW, respectively, as shown in Table 3.
| No. | House | Energy (kWh/day) | PV (kW) | PV approximate (kW) |
|---|---|---|---|---|
| 1 | Scenario-I | 71.72 | 12.26 | 13 |
| 2 | Scenario-II | 51.42 | 8.79 | 9 |
| 3 | Scenario-III | 60.94 | 10.42 | 11 |
| 4 | Scenario-VI | 49.01 | 8.38 | 9 |
| 5 | Scenario-VI | 37.07 | 6.34 | 7 |
| 6 | Scenario-VI | 33.35 | 5.7 | 6 |
Table 3: Electrical power and maximum electricity generation from solar cell system.
Assessment of solar cell-based energy generation
Solar radiation data from Thailand's solar radiation map in 2017 indicated that the maximum solar radiation levels occurred in April, at 18-20 MJ/m2-day or 4-5 kWh/day [3]. It can predict the solar cell system's electricity generation from Scenario I through scenario VI using this data. Six residences consumed 52 kWh/day, 36 kWh/ day, 44 kWh/day, 36 kWh/day, 28 kWh/day, and 24 kWh/day, respectively. The electricity generation data from solar cell system are provided shown in Table 4.
| No. | House | PV Power (kW) | PV Energy pro (kWh/day) | PV Energy pro(kWh/month) |
|---|---|---|---|---|
| 1 | Scenario-I | 13 | 52 | 1560 |
| 2 | Scenario-II | 9 | 36 | 1080 |
| 3 | Scenario-III | 11 | 44 | 1320 |
| 4 | Scenario-VI | 9 | 36 | 1080 |
| 5 | Scenario-VI | 7 | 28 | 840 |
| 6 | Scenario-VI | 6 | 24 | 720 |
Table 4: The electricity generation from solar cell system.
According to Table 4, power usage was calculated for each household at full load (100 percent). If each house has a maximum demand, the power capacity and monthly power cost will be estimated. The electricity cost was determined using a flat rate or a unit price of 4 baht. Table 5 shows the estimated electricity use and cost of electricity for six households.
| No. | House | Energy (kWh/day) | Energy consume (kWh/month) | Grid electricity cost (Baht/month) |
|---|---|---|---|---|
| 1 | Scenario-I | 71.72 | 2,151.62 | 8,606.49 |
| 2 | Scenario- II | 51.42 | 1,542.68 | 6,170.71 |
| 3 | Scenario-III | 60.94 | 1,828.15 | 7,312.61 |
| 4 | Scenario-VI | 49.01 | 1,470.18 | 5,880.73 |
| 5 | Scenario-VI | 37.07 | 1,112.20 | 4,448.80 |
| 6 | Scenario-VI | 33.35 | 1,000.65 | 4,002.59 |
Table 5: The electricity consumption in case of full loads (100%) in each household.
Table 5 summarized the electricity consumption and cost of power in six households. If each house installs a solar cell system for electricity generation, it can estimate electrical power and save money on monthly electricity bills, as seen in Table 6.
| No. | House | PV Power (kW) | PV Energy pro (kWh/day) | PV Supply to grid (baht/month) |
|---|---|---|---|---|
| 1 | Scenario-I | 13 | 52 | 6,240.00 |
| 2 | Scenario-II | 9 | 36 | 4,320.00 |
| 3 | Scenario-III | 11 | 44 | 5,280.00 |
| 4 | Scenario-VI | 9 | 36 | 4,320.00 |
| 5 | Scenario-VI | 7 | 28 | 3,360.00 |
| 6 | Scenario-VI | 6 | 24 | 2,880.00 |
Table 6: Electrical power and electricity cost saving.
In Table 6, it was shown how much electricity was saved in each household following the installation of a solar cell system. The results indicate that the quantity of electricity saved varies according on the type of energy generated by each system. A house that installs a large solar cell system can generate more energy than a house that installs a small solar cell system. However, the size of a solar cell system is determined by the area of solar panels installed. Thus, solar cell system design and installation must take a variety of factors into account in order to locate a system that is suited for each area, including homes, buildings, and department stores interested in generating all of their own electricity.
Energy-savings assessment
He energy savings in a solar cell system and electricity from the power grid are calculated based on the electricity loads in each household. As indicated in Table 7, the difference in the cost of energy savings in each residence (Scenarios I to VI) in the case of full load revealed cost savings of 2,366.49, 1,850.71, 2,032.61, 1,560.73, 1,088.80, and 1,122.59 baht/month, respectively.
| House | Energy (kWh/day) | Energy (kWh/month) | Grid electricity cost (Baht/month) | PV Supply to grid (baht/month) | Energy saving (Baht/month) |
|---|---|---|---|---|---|
| Scenario-I | 71.721 | 2151.623 | 8,606.49 | 6,240.00 | 2,366.49 |
| Scenario-II | 51.423 | 1542.677 | 6,170.71 | 4,320.00 | 1,850.71 |
| Scenario-III | 60.938 | 1828.152 | 7,312.61 | 5,280.00 | 2,032.61 |
| Scenario-VI | 49.006 | 1470.182 | 5,880.73 | 4,320.00 | 1,560.73 |
| Scenario-VI | 37.073 | 1112.199 | 4,448.80 | 3,360.00 | 1,088.80 |
| Scenario-VI | 33.355 | 1000.648 | 4,002.59 | 2,880.00 | 1,122.59 |
Table 7: Energy saving in the case of full loads in each house.
Economic analysis
Solar cell systems were discovered to provide a beneficial indirect effect on energy conservation by lowering electricity costs as a result of energy conservation. However, a critical aspect in solar cell system installation is the economic evaluation of the house, which includes scenarios I through VI. Payback periods for six residences were determined to be 11.02, 10.83, 11.58, 12.84, 16.52, and 14.04 years, respectively, as shown in Table 8.
| House | PV system (kW) | Overall system cost (Baht) | Energy saving (Baht/month) | Energy saving (Baht/year) | Pay back (Years) |
|---|---|---|---|---|---|
| Scenario-I | 13 | 312,867.65 | 2,366.49 | 28,397.90 | 11.02 |
| Scenario-II | 9 | 240,485.29 | 1,850.71 | 22,208.47 | 10.83 |
| Scenario-III | 11 | 282,426.47 | 2,032.61 | 24,391.30 | 11.58 |
| Scenario-IV | 9 | 240,485.29 | 1,560.73 | 18,728.71 | 12.84 |
| Scenario-V | 7 | 215,794.12 | 1,088.80 | 13,065.55 | 16.52 |
| Scenario-VI | 6 | 189,073.53 | 1,122.59 | 13,471.10 | 14.04 |
Table 8: House economic evaluation.
From the results in Table 8, the trend indicates that the payback period is system-dependent. Considering the investment cost, it was determined that the cost of electricity generation system is about 24-30 Baht/W which includes the cost of the equipment and installation. Thus, according to the department of alternative energy development and efficiency's 2012-2013 Thailand PV status report, monocrystalline silicon solar cell prices range between 50 and 80 Baht/W, while solar cell power generation system prices range between 60 and 100 Baht/W. The cost of the system, on the other hand, is dependent on the quantity of equipment required [4]. Additionally, international research indicates that the cost of investment in a solar cell system is approximately 7.5 cents per kWh [5], while the report of independent statistics & analysis provided a cost of solar cell installation about 0.34 dollars per peak watt in 2021 [6-11].
Displaying on web-based of energy consumption and notification via line notify
The energy consumption data is displayed on ThingSpeak.com in specific time. The graph displays voltage (V), current (A), frequency (Hz), power (kW), and energy (kWh) (Figure 4).

Figure 4: Data of energy consumption in time of day through line notify.
In Figure 4 shows the amount of energy consumption which notified the user via line notifies. It displayed voltage (V), current (A), frequency (Hz), power (kW), and energy (kWh) which indicated the data in a numerical format with a specific time that beneficial for use in advance proposes.
The results of performance testing on smart meter indicated that it can display features in the form of a graph versus time. The data consists of voltage (V), current (A), frequency (Hz), power (kW), and energy consumption (kWh) which easily transmitted via line notify on the specific time period. The smart meter are installed in six residences to measure electric energy consumption then derived the data as support information for choosing the appropriate solar cell system in order to help the user to save their money. From the results of six scenarios, the maximum loads for scenarios I to VI was determined as 71.72, 51.42, 60.94, 49.01, 37.07, and 33.35 kWh/day, respectively.
• The appropriate power generation capacity of solar cell for scenarios I to VI were 13, 9, 11, 9, 7, and 6 kW, respectively.
• The maximum daily electricity generation by solar cell systems were 52, 36, 44, 36, 28, and 24 kWh/day, respectively.
• The maximum monthly electricity generation were 1,560, 1,080, 1,320, 1,080, 840, and 720 kWh, respectively.
• The cost savings per month regarding the six residences after appropriate solar cell installed were 6,240, 4,320, 5,280, 4,320, 3,360, and 2,880 baths per month, respectively.
Payback periods of solar cell systems in scenarios I to VI are presented as 11.02 years (about 11 years), 10.83 years (about 10 years 10 months), 11.58 years (about 11 years 8 months), 12.84 years (about 12 years 10 months), 16.52 years about 16 years 7 months), and 14.04 years (about 14 years), respectively.
The authors would like to express their gratitude to School of Energy and Environment, University of Phayao for funding this research and assisting residences in collecting data.
[Crossref], [Google Scholar]
Citation: Wongpanyo W, Ploynoy K (2022) Electrical Load Assessment Using Smart Meter via Internet of Things (IoT) System in Solar Cell Design and Installation for Residences. J Hotel Bus Manage. 11:001.
Received: 03-Jan-2022, Manuscript No. JHBM-22-47759; Editor assigned: 05-Jan-2022, Pre QC No. JHBM-22-47759 (PQ); Reviewed: 19-Jan-2022, QC No. JHBM-22-47759; Revised: 27-Jan-2022, Manuscript No. JHBM-22-47759 (R); Published: 04-Feb-2022 , DOI: DOI: 10.35248/2169-0286.22.11.001
Copyright: © 2022 Wongpanyo W, et al. This is an open-access article distributed under the terms of the Creative Commons Attribution License, which permits unrestricted use, distribution, and reproduction in any medium, provided the original author and source are credited.