Journal of Hotel and Business Management
Open Access
ISSN: 2169-0286
ISSN: 2169-0286
Research Article - (2025)Volume 14, Issue 1
India is one of the leading countries for economic growth worldwide and external trade recovered strongly in 2021-2022 after the post-COVID-19 pandemic. According to the ministry of economy and finance 2021 annual report, there has been a strong augmentation in capital flow into India, leading to the rapid accumulation of FOREX reserves as compared with Asian countries. It is the fourth-largest forex reserve holder in the world as of December 2022. India’s merchandise exports and imports rebounded strongly and were suppressed during the COVID-19 pandemic due to the financial burden, low parity of purchasing power, unemployment, production decline in manufacturing companies, higher debt, improper management of the service sector, etc. Despite the control measures of SARS-CoV-2, financial movement decreased at a marginal rate of 50-60%. According to RBI statistics, foreign exchange reserves hovered at US$63.10 billion in the first half of last year, despite a low GDP rate compared with China. In this paradigm, appropriate measures are necessary to control financial inflation. As such, practical innovation is necessary for guiding financial experts and policymakers in the implementation of newer policies and accurate measures of GDP and forex reserves to build a financially empowered country. With an overall pragmatic research gap, the present study will attempt to address the trend of forex and GDP by applying advanced statistical modelling techniques and revisiting financial principles to cope with real data sets for predicting economic feasibility by 2030. This study will help economists and financial analysts initiate operational research on an empirical basis and also greatly assist in drafting financial policy at the national and global level.
Forex resrves; GDP; Financial growth; Model; ARIMA; SARS-CoV-2.
In June 95, a blueprint was laid out in the report of an expert group on the foreign exchange market in order to develop the Forex market in India. Later in August 97, the Committee on Capital Account Convertibility (CCAC) gave some recommendations regarding financial markets that were relevant to the forex market. After the collapse of the Bretton Woods agreement in the 70's, market players in forex became active to boost the Indian economy at the global level. Indian currency value has declined for the exchange of currency because of the stringent guidelines that prevailed and all banks are required to undertake only cover options and the square’ position at all times. Since the beginning of the forex market in 78, the Reserve Bank of India has allowed the banks to undertake intraday trading in the forex market and as a result, the Indian economy has improved. The stipulated maintenance of a square’ position with close business hours each day to know the INR trend in the global market as per the past annual reports (70 to date), the main banks started quoting two-way rates against the rupee (INR) as well as cross-currency rates to make profit. In the interest of maximization of economy, the daily announcement of INR and forex interaction was notified by the RBI on its buying and selling rates through Authorized Dealers (ADs) with exchange rate regimes between 70 and 92. The RBI quotes for buying and selling effectively became the centre around which he market was managed because of the current RBI financial transaction policy (buying and selling are unlimited amounts for the intervention currency, resulting from the banks' merchant purchases) [1]. Daily market clearing activities carried out by the RBI naturally result in some kind of variation in the quantity of reserves. In addition, a few types of capital and current account transactions made on behalf of the government were sent directly to the reserve account. In this regard on the reviewing of financial transaction modalities, Prof. Rangarajan committee was constituted by the government of India for reviewing the perspective of economy boosting. In addition to one more committee, Sodhani and Tarapore also addressed this issue and contributed significantly, along with the Rangarajan committee, to reviewing the foreign exchange market in India. However, the foreign exchange market (Forex) is one of the most important international markets that helps countries improve their economies and well-being. In most cases, capital flows from developed countries to resource-poor countries. The foreign exchange market affects employment through real exchange rates in mid- and lower-income countries and also affects the commodity price index, inflation through the cost of imports, etc. They affect international capital flow through returns and risks from capital to low-abundant countries. Due to the SARSCoV-2 during 2020, the economy and forex had a dropdown and asymptotically reached the axis. The following variations are noticed in the SARS-CoV-2 pandemic in the global market
Effect of SARS-CoV-2 on foreign exchange stock market
Lockdown 1.0 (March 25-April 14): With the increase in SARSCoV-2 cases, the Indian currency depreciated and the stock exchange index fell. As per the statistics report, there was a negative correlation between the sensex and exchange rate, 1-2 years’ steepest ascent of economic growth was observed.
Lockdown 2.0 (April 15-May 03): With the increase in SARSCoV-2 cases, Indian currency depreciated and stock exchange index fell. There was strong negative correlation between sensex rate and exchange rate. We do no find significant dependence between the growth rates on applying VAR. Sensex rate and exchange rate would have taken about 6-8 days to return to their long run growth trend [2].
Lockdown 3.0 (May 04-May 17): With the increase in SARSCOV-2 cases, the Indian currency depreciated and the stock exchange index fell. There was a strong negative correlation between the senex rate and the exchange rate. The sensex rate and exchange rate would have taken about 10 days to return to their long run growth trend.
Lockdown 4.0 (June 1-June 30): With the increase in SARSCoV-2 cases, the Indian currency depreciated and the stock exchange index experienced a small upward effect. There was a positive correlation between the senex rate and the exchange rate. We find no significant dependence between the growth rates when applying VAR. The sensex rate and exchange rate would have taken about 5 and 6 days, respectively, to return to their long-run growth trends.
Unlock 1.0 (June 1-June 30): With the increase in SARS-CoV-2 cases, the Indian currency has improved and the stock exchange index has performed better in first-order growth. There was a negative correlation between the senex rate and the exchange rate. We do find significant dependence between the sensex rate and a four-period lagged difference in exchange rate when applying VAR.
Pre-lockdown to lockdown 1.0 (Mar 11-April 14): With the increase in SARS-COV-2 cases, the Indian currency depreciated and the stock exchange index fell. There was a negative correlation between the sensex rate and the exchange rate. The sensex rate and exchange rate would have taken about 3 days.
Pre-lockdown to unlock 1.0 (Mar 11-June 30): With the increase in SARS-CoV-2 cases, the Indian currency depreciated and the stock exchange index fell. There was a negative correlation between the senex rate and the exchange rate. We do find significant dependence between the sensex rate and a fourperiod lagged difference in exchange rate when applying VAR.
Global market constraints
The global economy has faced inflation too many issues during SARS-CoV-2. Many countries around the world have restricted travel, shut borders and locked themselves out to avoid the spread of the pandemic. These measures have had severe impacts on economic activity. The International Monetary Fund (IMF) predicted that the global economy might contract by 3 percent in 2020. The Foreign Exchange (Forex) market, which is the largest financial market, has seen unprecedented movements and is now closely watched by policymakers and others to bring it back to normal. The impact of SARS-CoV-2 may vary among currencies according to their governments policy responses, risk sensitivities and market standing. The evidence shows that there was a significant change in the strength of multi-fractality, which points to a general decline in the forex market. There was no single policy response that was successful in the short term during SARS-CoV-2. SARS-CoV-2 has caused a sharp squeeze in liquidity across the financial markets. Emerging and developing financial markets suffered the most destruction when compared to developed markets. There was a disconnection between the state of the real economy and financial market performance in many countries, while unconventional monetary and fiscal plans were made in Western Europe and the United States in order to reduce the pandemic's impact on their populations and economies [3].
Morocco and Tunisia
These countries faced social and economic burdens due to lockdown. The central banks decreased their interest rates in powerful ways. The foreign exchange rate band was wide and varied from (2.5%-5%) by Moroccan monetary authorities.
Russia, India, Brazil and Kuwait
These countries' monetary policies reduced the key interest rates, relaxed macroprudential banking rules and eased flow controls in order to reduce the pandemic's social and economic impact. Their currencies external value was supported by the central banks managed float regions, which triggered large swings in the Forex volatilities in contrast to countries like South Africa, South Korea, Switzerland and Turkey.
They preserved employment and business and supported households. This last interest rate provided massive liquidity to the financial markets and also relaxed temporary prudential rules for banks. We find a robust dynamic correlation between the exchange rate volatility and the contamination of coconuts in the pandemic. Policies like lockdowns, strict migration policies, travel bans and fiscal stimulus during SARS-CoV-2 have created uncertainty for both policymakers and investors. The uncertainty of macroeconomics and policy negatively affects economic growth. Exchange rate response is insensitive to any shock in the system; This insensitivity could have contributed to the active intervention of the central bank, the RBI, during the pandemic by selling US dollars from international reserves in the foreign exchange market. Disease outbreak-induced uncertainty did not diminish the foreign exchange market but diminished the oil stock markets and this is because of the Reserve Bank of India's intervention. With a one percent increase in confirmed cases, there is depreciation in the local currency by 0.01% in emerging markets, while the impact on advanced countries' exchange rates is weak. Fiscal policy appreciated the local currency, while monetary policy appreciated initially, followed by significant depreciation. Policies had a stronger impact on the exchange rate in emerging markets. Unconventional monetary policy appreciated the local currency, which indicates that the signal effect may dominate. SARS-CoV-2 depreciated local currency values in emerging markets but not in advanced countries. Unconventional monetary policy or expansionary fiscal policy reduced the downward pressure of the pandemic on the exchange rate.It might have the opposite effect of conventional expansionary monetary policy. A disease outbreak does not have better prediction power over returns than volatility for a oneday forecast horizon. price and volatility have impacts on the behaviour of the exchange market. There were shocks and asymmetric spillovers from the exchange to the stock market. Due to contagious risk, there was a decrease in domestic stock returns and subsequent capital outflows, which weakened the exchange rates. There was a contemporaneous relationship between exchange rate changes and stock returns. Investors in South Africa who wanted to hedge their investments might have made use of the information in order to manage their currency risk strategies and international portfolio risk. According to the proponents of the intervention, it can avoid a swift price decline in the stock market and restore confidence in the investor, while opponents claim that any form of intervention can seriously compromise the integrity of the market because the stock market stands as a leading financial indicator of the economy. As South Africa's financial markets are vulnerable to global events, we can consider the 'meteor shower' effect of global financial markets on stock and exchange rate markets. Brazil, Russia, India, China and South Africa the BRICS countries have emerged as emerging economies during the last two decades. The dependency between INR and Cny is less persistent when compared to the rest (Brl, Rub and Zar). During the first and second stages of the pandemic, the dependency between Brl-Cny and Rub-Cny decreased. Dependency between INR-Cny was fluctuating and Zar-Cny was quite stable. There were no changes in the third stage. During the fourth stage, dependency of Cny with Brl and Zar increased and dependency between Cny and Rub decreased, which is due to SARS-CoV-2 breakout in other countries. $ flow became an important driver of BRICS exchange rates. $ tends to appreciate during pandemics and a similar trend was observed in the BRICS. The $X returns have no effect on dependencies between Cny and the other four countries' currencies during the first and fourth stages. INR was positively affected by $X returns during stage two and Brl and Rub were positively affected by $X returns during stage three. The US is the most important export market for BRICS and with appreciation in the $, it helped BRICS export more. We find positive effects of $X returns on dependencies between Cny and Zar for the second, third and fourth stages. During the second stage, the $ exerted positive effects on the co-movements between the main importing partners' currencies. Fluctuations in $ and CNY were transferred to INR. Pair dependencies between China and other BRICS countries declined due to the pandemic and the depreciation of the $, which weakened the linkages between the currencies. During the pre-pandemic period, the $ and yen exchange rate was non-stationary and when the pandemic hit, the yen became stationary. Shocks to the yen had a transitory effect. The behaviour of yen is due to SARS-Cov-2. Due to the pandemic, many currencies like €/ $, £/$, $/CAD, $/AUD, $/CNY, $/CHF, $/SEK and $/¥ suffered along with financial markets like the stock market. Counties faced abnormal returns on major currencies. It was observed one day before WHO announced that SARS-CoV-2 was a pandemic. Average abnormal returns of major currencies were observed before the announcement of the first confirmed case of SARS-CoV-2 in the relevant country. They were estimated to be 0.65%. Short-term returns were observed on the day when the world health organization announced SARS-CoV-2 was a pandemic. It was estimated on the day of the first positive case in the respective countries and on the day of the first death case from the SARS-CoV-2 outbreak. Investors in major currencies earned positive returns during these three different scenarios. India's foreign exchange reserves had a positive performance, but then, in a short while, they declined due to the pandemic. There was a huge outflow of Indian foreign exchange reserves in late March 2020. India saw its highest ever capital outflow of 17.33 billion US dollars since 2008. The performance showed negative growth rates during March 2020 when compared to March 20. The pandemic surged the risk aversion of the FPI, which resulted in a capital outflow. Indian currency value depreciated, which caused the RBI to sell US dollars to defend Indian Rupees (INR). Later, Foreign exchange reserves showed positive growth until July, which were due to the inflow of the foreign development index and lower import bills. Along with this, FPI gained confidence and so people invested in the stock market, which increased the stock of foreign exchange reserves. The threshold limit to hold foreign exchange reserves to cover imports is 25% of annual imports. But India held much more than the threshold limit. It had 94.35%. The threshold limit to hold foreign exchange reserves to cover external debt shouldn't fall below 40% of total external debt. India had exceeded that limit [4]. It was able to cover more than 80%. India had four times more than the proposed limit (100%) of foreign exchange reserves to cover short-term debt. Also, India had a higher level of broad money, which increases the confidence of the currency. Investors adjust their expectations for policies and the economy, which leads to exchange rate volatility because of a high level of economic policy uncertainty. Investors’ confidence will increase, the financial market will stabilise and exchange rate volatility will be curbed with the implementation of powerful government measures that send a strong signal to the market. With an increase in positive cases, exchange rate volatility intensifies. The overall government response index, the economic support index, the containment and health index and the stringency index show a restraining effect on the exchange rate. Measures like public transport closures and school closings also play a role in restraining exchange rate volatility. Fiscal policy, international aid and income support policies play roles in restraining exchange rate fluctuations. Exchange rate volatility can be restrained by government intervention like public information campaigns and restrictions on international movement. This study analyses the current status of the decrease in the foreign exchange markets by comparing it with turbulence. The study examines the foreign exchange markets and their reaction to the pandemic. Chaos in the exchange market is not as bad as it was during the global financial crisis. It indicates that of the six foreign exchange rates, the Japanese yen showed a higher risk during the SARS-CoV-2 pandemic. It also investigates the impact of the GFC and SARS-CoV-2. On six exchange rates ($- €, $-£, $-¥, $-Ncy, $-Brl and $-Try). The epidemic has affected the health of the public and the financial market negatively; it displays risk in all types of indicators. Stability in the currency market is the primary requirement for the health of the global economy. The exchange rate is the most affected asset price due to SARS-CoV-2. These shocks to the exchange rate of the Japanese yen to the US dollar have a permanent or transitory effect. Evaluates the resistance of the exchange rate to the pandemic and the modelling is based on the unit root. A unit root test confirms that the stationary exchange rate implies the existence of Purchase Power Parity (PPP). The above study uses the two-endogenous structural break unit root model to understand the evolution of exchange rates from shock persistency. Yen became highly stationary during SARS-CoV-2, indicating that shocks in Yen are having a transitory effect. These changes in the Yen have caused the largest global shock due to SARS-CoV-2. Almost 45% of households across the country faced an income drop due to SARS-CoV-2. The Indian economy expected a loss of Rs. 32,000 every day during the first 21 days of the pandemic. The Indian equity market entered bear market territory. Investors bid up bond prices, causing the major yield economies to inch lower. Business people faced a lot of issues as their businesses were dependent on money. Firms faced higher currency risk during SARS-CoV-2. The magnitude of the firm's currency risk increased from 0.27 to 2.1. The sensitivity of the tourism industry to exchange rate fluctuations during SARSCoV-2 is large. The firm's asset turnover and liquidity had also reduced. The valuation of firms had decreased due to negative profit margins and a higher debt burden. Larger firms and debt to-asset ratios had higher foreign currency risk, which is due to higher hedging costs or inappropriate hedging. This investigates if the interest rate differentials cause an expected change in the exchange rate during SARS-CoV-2 and also examines if investors in the international asset and exchange rate markets take advantage of the information obtained during the SARS-CoV-2 pandemic. The interest rate differentials granger describes cause the exchange rate to change in all six BRICS economies for a short term. The interest rate differentials improve the predictability of future changes in exchange rates and they also indicate that investors show rational behaviour as the foreign exchange market provides information about the interest rate differentials. The findings can be attributed to an unexpected event like SARS-CoV-2, which contains information that could enhance the exchange rate prediction. $ took on a central role in the foreign exchange network even during SARS-CoV-2. Major currencies like INR and Cny, which were linked to $ through SGD, are now connected directly to $. € And CHF remain closely linked in both networks. All currencies were closer and hence they started fluctuating during the pandemic. Movements in the leading currencies will transfer to the rest of the currencies. From the reader's point of view, the following market structure was described:
Spot market
In the spot market, transactions between the currency pairs happen on the spot or immediately after entering the contract. It happens at the prevailing exchange rate, known as the spot rate. Here, traders are not exposed to exchange rate risk or the uncertainty of the market [5].
Futures market
In the futures market, transactions between currency pairs happen after certain duration of the contract. It happens at an exchange rate known as the future rate. Here, the contract is guaranteed. Also, contracts can be sold to a third party.
Forward market
It is almost like a future market. The exchange rate is known as the forward rate. The terms negotiated can be altered or broken. It is not guaranteed.
Swap market
In the swap market, two types of currencies are borrowed and lent. Investors here borrow in one type of currency and lend in another type of currency. It is to pay off the obligations without taking on foreign exchange risk [6].
Option market
Here, the transaction happens at a future date without any obligation. It has two types: Call and put options. With the call option, one can either buy or break the contract. With the put option, one can either sell or break the contract. In the case of the call option, we have two types. a) American call option; b) European call option (In the American call option, one can buy or break the contract on or before the maturity date; In the European call option, one must break or buy the contract only at the maturity date. The SARS-CoV-2 pandemic that started in March 2020 has impacted almost all sectors. The global economy and the national economy have also been negatively impacted. This is due to huge variations in international cash flow. Countries closed their borders and imposed lockdowns and hence trade stopped for a while, which affected the economy.
In order to arrive at a conclusion using the data, ARIMA with substitution method (lag period) is used. The ARIMA (Auto Regressive Integrated Moving Average) model is used to know the trend and fluctuation in the foreign exchange market at global market before the SARS-CoV-2 pandemic and during the pandemic. The data was collected from foreign exchange data base (spot market turnover, forward market turnover, cancel forward turnover of both merchant and interbank transactions). It was released by the reserve bank of India. The data was extracted on daily and cohort basis from period October 2018 to November 2021. Foreign exchange market structure, players and evolution-different type of foreign exchange enlisted (i) Spot market (ii) Future market (iii) Forward market (iv) Swap market and (v) Options market.
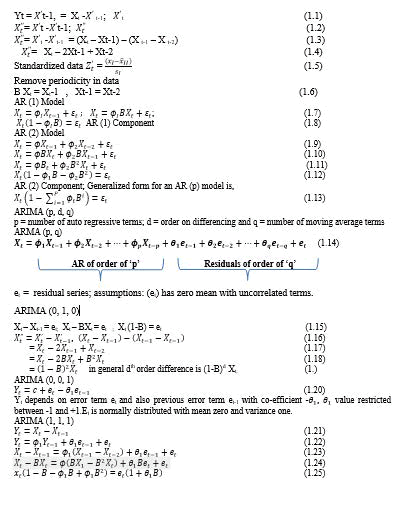
ARIMA model formulation
If the series is non stationary, correlogram decays rather slowly; whereas in stationary time series, correlogram decay is faster. If series is non stationary, convert it to stationary time series by either, standardizing time series described in spectral analysis and differencing the time series. ARIMA Model was formulated based on the parameter estimation and its calibration (Figure 1).

Figure 1: ARIMA model construction flow chart.
Factors considered for ARIMA model
Interest rates: Interest rate of foreign countries should be greater than the interest rate in the domestic country. This will make people invest in foreign countries to gain more profit.
Economic stability: If foreign countries are more stable, people invest their believing that the risk is low.
Trade weighted index: When a country has trade surplus, the economy will be strengthened. The currency value increase as people import goods from that country. Same way, country's currency value decreases if it has trade deficit as people have to sell their currency in order to import goods.
World event: World events affect the stability of the country. Positive events can increase the strength of currency and attract foreign investors. While negative events can decrease the confidence in the currency and do not attract foreign investors [7].
Government debt: Government debts are not always negative. But when the debt is too high it could lead to inflation and so will it devalue the currency. When public that is reduced economy becomes more stable and hence it will attract more investors which will increase the value of the currency.
Recession: If a country is in recession, it's interest rate will fall making the investors not to invest in the country.
Speculation: If the country's currency value is expected to increase, demand for the currency also increases and so will the value increase which will lead to rise in exchange rate as well.
Country's current account/balance of payments: Country with positive current account or low current account deficit will have its currency value decreased leading to few or no investors to invest in such country.
Results were shown in below Table 1.
| Purchase merchant | 1st Quarter | 2nd Quarter | ||||
| 1st month | 2nd month | 3rd month | 4th month | 5th month | 6th month | |
| Purchase merchant spot foreign currency cash deposit service/Indian Rupees (Fcy/INR) | ||||||
| ACF | -0.006 | -0.009 | -0.009 | -0.012 | -0.006 | -0.008 |
| t-value | -0.189 | -0.289 | -0.284 | -0.368 | -0.205 | -0.252 |
| P value | 0.425ns | 0.386ns | 0.388ns | 0.356ns | 0.4ns | 0.400ns |
| Purchase merchant forward (Fcy/INR) | ||||||
| ACF | 0.175 | 0.097 | 0.047 | 0.069 | 0.069 | 0.042 |
| t-value | 5.552 | 3.076 | 1.491 | 2.212 | 2.6 | 1.332 |
| P value | 0.000** | 0.001** | 0.058* | 0.013** | 0.014* | 0.092* |
| Purchase merchant forward cancel (Fcy/INR) | ||||||
| ACF | 0.121 | 0.079 | 0.084 | 0.037 | 0.023 | 0.029 |
| t-value | 3.831 | 2.512 | 2.666 | 1.182 | 0.738 | 0.923 |
| P value | 0.001** | 0.006** | 0.004** | 0.1ns | 0.230ns | 0.178ns |
| Purchase merchant spot (Fcy/FCY) | ||||||
| ACF | 0.437 | 0.414 | 0.357 | 0.354 | 0.355 | 0.3 |
| t-value | 13.831 | 13.093 | 11.291 | 11.189 | 11.2 | 10.093 |
| P value | <0.001** | <0.001** | <0.001** | <0.001** | <0.001** | <0.001** |
| Merchant purchase forward cancel (Fcy/Fcy) | ||||||
| ACF | 0.325 | 0.215 | 0.066 | 0.013 | 0.061 | 0.05 |
| t-value | 10.291 | 6.813 | 2.082 | 0.428 | 1.9 | 1.594 |
| P value | 0.000** | 0.000** | 0.0** | 0.334ns | 0.028 * | 0.056* |
| Purchase interbank spot (Fcy/INR) | ||||||
| ACF | 0.003 | -0.01 | 0.017 | 0.014 | 0.006 | 0.007 |
| t-value | 0.107 | -0.31 | 0.533 | 0.446 | 0.183 | 0.24 |
| P value | 0.457ns | 0.378ns | 0.297ns | 0.328ns | 0.427ns | 0.405ns |
| Purchase interbank swap (Fcy/INR) | ||||||
| ACF | 0.002 | -0.006 | 0.006 | 0.01 | 0.014 | 0.018 |
| t-value | 0.053 | -0.188 | 0.205 | 0.313 | 0.454 | 0.557 |
| P value | 0.479ns | 0.425ns | 0.4ns | 0.377ns | 0.325ns | 0.289ns |
| Purchase interbank forward (Fcy/INR) | ||||||
| ACF | 0.145 | 0.101 | 0.002 | -0.025 | -0.001 | -0.001 |
| t-value | 4.584 | 3.184 | 0.081 | -0.787 | -0.025 | -0.027 |
| P value | 0.001** | 0.001** | 0.468ns | 0.216ns | 0.489ns | 0.489ns |
| Purchase interbank spot (Fcy/Fcy) | ||||||
| ACF | 0.017 | 0.033 | 0 | -0.021 | 0.005 | 0.006 |
| t-value | 0.5258 | 1.0582 | -0.6179 | -0.6794 | 0.151 | 0.2072 |
| P value | 0.299ns | 0.145ns | 0.268ns | 0.248ns | 0.440ns | 0.418ns |
| Purchase interbank swap (Fcy/Fcy) | ||||||
| ACF | 0.179 | 0.163 | 0.09 | 0.049 | 0.077 | -0.001 |
| t-value | 5.679 | 5.167 | 2.847 | 1.5482 | 2.4348 | -0.0234 |
| P value | <0.001** | <0.001** | 0.002** | 0.061** | 0.007** | 0.491ns |
| Purchase interbank forward (Fcy/Fcy) | ||||||
| ACF | 0.146 | 0.078 | 0.004 | 0.052 | 0.112 | 0.105 |
| T stat | 4.632 | 2.484 | 0.124 | 1.657 | 3.532 | 3.318 |
| P value | <0.001** | 0.006** | 0.450ns | 0.049ns | 0.0021** | 0.0047** |
Table 1: Autocorrelation Function (ACF) for the Purchase merchant spot, forward and cancel status of Forex (2021-2022).
Table 2 shows the correlation between the purchase merchant spot, foreign currency cash deposit service and Indian Rupees (Fcy/INR). The purchase merchant forward, forward-cancel, merchant spot and merchant purchase forward-cancel are all found to be significant at the I and II quarters (p<0.05). The ACF value led to significant changes in the unobserved components. The purchase interbank swap and forward (Fcy/ Fcy) are positively associated with the positive movement of forex in India after SARS-CoV-2. There were numerous factors that affected the Forex positive movement during the pandemic crisis, including lockdown and restrictions on traveler checks and receipts. Its magnitude and multifaceted nature require the economic feasibility of the country to consider a broad range of prevention policy interventions. At the same time, the global scale and protracted awesomeness of the shock increase the risk of cross-border spillovers from country-specific policy interventions if similar policies are applied by groups of countries representing a large share of the global economy. This was a serious note on the forex and capital flow management measures from a multilevel perspective of the pandemic hit, recognizing that the international monitory fund has advised considering multilevel national policy implications at the national level. After the COVID-19 lockdown lift, a sharp increasing trend was found in merchant purchase forward and cancel (Fcy/Fcy) with respect to Indian Currency (Fcy/INR; Fcy/ INR). A similar trend was seen in the purchase of Interbank Swap (Fcy/Fcy) and interbank forward (Fcy/Fcy) on the global market as compared with US$. Multilevel cooperation can greatly reduce the burden on Forex and CFMs. According to the statistics of the IMF, the highest estimated reserves holding in US treasuries (US$ billions) were seen in China P.R. Mainland (1970.32 US$ billions), India (255.10 US$ billions) and the Russian federation (162.58 US$ billions), followed by Brazil (274.74 US$ billions) and Turkey (246.48 US$ billions). The total estimated reserves were US$ 2928.14 billion, with total reserves excluding gold worth US$ 5082 billion. This figures are significantly affected the positive association of economic growth in Asian countries (Table 3) [8].
| Country | Total reserves excluding gold billions USD | Central bank, securities nonresidents, securities included in official reserves assets (US$ billions) | Estimated reserves held in US treasuries (US$ billions) |
| China, PR, Mainland | 3127.49 | NA | 1970.32 |
| Russian federation | 443.97 | 258.06 | 162.58 |
| India | 432.38 | NA | 255.1 |
| Brazil | 353.59 | 335.05 | 274.74 |
| Mexico | 177.18 | 0 | 0 |
| Indonesia | 125.34 | 112.38 | 70.8 |
| Philippines | 79.82 | 37.43 | 33.69 |
| Turkey | 78.53 | 33.51 | 246.48 |
| Colombia | 51.97 | 50.07 | 44.06 |
| South Africa | 48.92 | 36.68 | 21.64 |
| Nigeria | 42.84 | 9.59 | 6.04 |
| Egypt. Arab. Rep. of | 40.69 | 34.04 | 21.44 |
| Chile | 40.64 | 38.97 | 27.67 |
| Morocco | 25.33 | 20.42 | 12.87 |
| Pakistan | 13.42 | 1.11 | 0.7 |
| Total | 5082.11 | 967.33 | 2928.14 |
Table 2: Emerging Market and Developing Economies (EMDEs) distribution accumulated large holdings of US treasuries.
| Sales | 1st Quarter | 2nd Quarter | ||||
| 1st month | 2nd month | 3rd month | 4th month | 5th month | 6th month | |
| Merchant spot (Fcy/INR) | ||||||
| ACF | -0.006 | -0.009 | -0.007 | -0.009 | -0.005 | -0.006 |
| t-value | -0.202 | -0.274 | -0.239 | -0.309 | -0.155 | -0.1 |
| P value | 0.420ns | 0.391ns | 0.406ns | 0.379ns | 0.438ns | 0.424ns |
| Sales merchant forward (Fcy/INR) | ||||||
| ACF | 0.304 | 0.279 | 0.237 | 0.2 | 0.2 | 0.179 |
| t-value | 9.586 | 8.779 | 7.465 | 6.907 | 6.066 | 5.638 |
| P value | <0.001** | <0.001** | <0.001** | <0.001** | <0.001** | <0.001** |
| Sales merchant forward cancel (Fcy/INR) | ||||||
| ACF | 0.068 | 0.117 | -0.00018 | -0.033 | 0.041 | -0.05 |
| t-value | 2.153 | 3.686 | -0.006 | -1.04 | 1.3 | -1.583 |
| P value | 0.016** | 0.012** | 0.498ns | 0.149ns | 0.093* | 0.057* |
| Sales merchant spot (Fcy/Fcy) | ||||||
| ACF | 0.429 | 0.41 | 0.349 | 0.33 | 0.332 | 0.291 |
| t-value | 13.517 | 12.943 | 10.997 | 10.41 | 10.469 | 9.172 |
| P value | <0.001** | <0.001** | <0.001** | <0.001** | <0.001** | <0.001** |
| Sales merchant forward (Fcy/Fcy) | ||||||
| ACF | 0.32 | 0.7 | 0.103 | 0.061 | 0 | 0 |
| t-value | 10.075 | 6.202 | 3.238 | 1.924 | 0.599 | 0.609 |
| P value | <0.001** | <0.001** | 0.0062** | 0.027* | 0.274ns | 0.271ns |
| Merchant forward cancel (Fcy/Fcy) | ||||||
| ACF | 0.357 | 0.234 | 0.064 | 0.028 | 0.045 | 0.047 |
| t-value | 11.257 | 7.365 | 2.022 | 0.894 | 1.421 | 1.488 |
| P value | <0.001** | <0.001** | 0.022** | 0.186ns | 0.053* | 0.068* |
| Interbank spot (Fcy/INR) | ||||||
| ACF | 0.016 | -0.005 | 0.02 | 0.025 | 0.01 | 0.024 |
| t-value | 0.496 | -0.156 | 0.631 | 0.779 | 0.332 | 0.758 |
| P value | 0.310ns | 0.438ns | 0.264ns | 0.218ns | 0.370ns | 0.224ns |
| Interbank swap (Fcy/INR) | ||||||
| ACF | 0.001 | -0.007 | 0.005 | 0.013 | 0.017 | 0.024 |
| t-value | 0.038 | -0.226 | 0.147 | 0.402 | 0.525 | 0.747 |
| P value | 0.485ns | 0.411ns | 0.441ns | 0.344ns | 0.299ns | 0.228ns |
| Interbank forward (Fcy/INR) | ||||||
| ACF | 0.124 | 0.12 | 0.092 | 0.033 | 0.032 | 0.09 |
| t-value | 3.908 | 3.789 | 2.91 | 1.051 | 1.006 | 2.823 |
| P value | 0.001** | 0.001** | 0.002** | 0.147ns | 0.157ns | 0.002** |
| Interbank spot (Fcy/FCY) | ||||||
| ACF | 0.018 | 0.034 | 0 | -0.021 | 0.006 | 0.005 |
| T stat | 0.579 | 1.066 | -0.613 | -0.678 | 0.1803 | 0.167 |
| P value | 0.281ns | 0.143ns | 0.270ns | 0.249ns | 0.428ns | 0.434ns |
| Interbank swap (Fcy/Fcy) | ||||||
| ACF | 0.211 | 0.134 | 0.091 | 0.062 | 0.137 | 0.034 |
| t-value | 6.66 | 4.224 | 2.881 | 1.968 | 4.321 | 1.058 |
| P value | <0.001** | <0.001** | 0.002** | <0.001** | <0.001** | 0.145 |
| Interbank forward (Fcy/Fcy) | ||||||
| ACF | 0.154 | 0.088 | 0.017 | 0.053 | 0.108 | 0.101 |
| t-value | 4.86 | 2.788 | 0.551 | 1.68 | 3.39 | 3.2 |
| P value | 0.000** | 0.003** | 0.291ns | 0.047* | 0.0003** | 0.0007** |
Table 3: Autocorrelation Function (ACF) for the sales merchant spot, forward and cancel status of Forex (2021-2022).
Table 3 shows the Autocorrelation Function (ACF) for the sales merchant spot, forward and cancels status of Forex. The driven results revealed that sales forward (Fcy/Fcy) and cancel (Fcy/ Fcy), interbank swap (Fcy/Fcy), interbank forward (Fcy/Fcy), merchant spot (Fcy/Fcy) and merchant forward (Fcy/INR) were found to be statistically significant (p<0.05). Amid the market volatility, there has been some degree of negative skewness in cash flow and investment at the global market and the economic indices have a negative vertex with the merchant sales of forex movement in India as well as at the global level. These were first reflected in stock indices and risk on stock exchanges, at which point traders sell US dollars. This is evidence that reliable data derive these indicators. They are short-term gauges. It is unlikely that current scenario will reflect the long-term impact of mass unemployment, the risk of overleveraged corporate debt, restructuring in markets such as commercial real estate and frequent occurrence of natural calamities at the global level [9] (Figures 2 and 3).

Figure 2: Indian forex reserves after SARS-CoV-2 nonlinear progressions.

Figure 3: Trend of Indian forex reserves from 2012-2022.
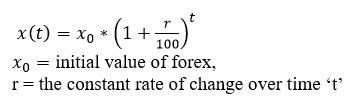
The second order polynomial trend was fitted on forex reserves in different months with US dollars. Ten-year data sets were extracted from the RBI newsletter. Analysis was done by the MS Excel program; the X-axis depicted the month wise breakdown of forex reserves and the Y-axis showed the US$ (million) between January 2022 and February 2023. The results show that, in the month of April to June 2022, forex reserves dropped with observed value (US$ 426482-415893 million) and succeeding months expressed linear growth. Every month (6.19) US$ million was a great burden to the growth of the economy with a suboptimal association (R2=0.451) between the global market. A similar trend line was applied to forex reserves for the last ten years. As compared with the existing scenario, an approximately total of US$ 40354 million was lost from 2012 to 2023 due to foreign debts, lower shares from financial marketing companies and other associated factors (Figures 4-6 and Table 4).
| Autocorrelation function | Partial auto correlation function | |||||
| Time lag k | ACF (k) | t-stat | P-value | PACF (k) | t-stat | P-value |
| 44562 | 0.467 | 1.684 | 0.057 | 0.467 | 1.684 | 0.057 |
| 44593 | -0.037 | -0.136 | 0.446 | -0.327 | -1.181 | 0.129 |
| 44621 | -0.151 | -0.545 | 0.297 | 0.036 | 0.13 | 0.448 |
| 44652 | -0.375 | -1.352 | 0.099 | -0.444 | -1.603 | 0.066 |
| 44682 | -0.294 | -1.063 | 0.153 | 0.163 | 0.59 | 0.282 |
| 44713 | -0.109 | -0.395 | 0.349 | -0.263 | -0.949 | 0.179 |
| 44743 | -0.135 | -0.487 | 0.317 | -0.074 | -0.269 | 0.395 |
| 44774 | -0.066 | -0.24 | 0.406 | -0.162 | -0.584 | 0.284 |
| 44805 | 0.05 | 0.183 | 0.428 | 0.006 | 0.0242 | 0.49 |
| 44835 | 0.061 | 0.22 | 0.414 | -0.1 | -0.363 | 0.361 |
| 44866 | 0.053 | 0.192 | 0.425 | -0.098 | -0.355 | 0.363 |
| 44896 | 0.042 | 0.813 | 0.551 | -0.126 | -0.348 | 0.374 |
Table 4: ACF and PACF of forex reserves.

Figure 4: Partial auto correlation function lags period 3 months (1, 0, 0) model.

Figure 5: Auto correlation function lags period 3 months (1,0,0) model.

Figure 6: Forex reserves predicted by bootstrap techniques with the sampled observations (n=5100), mean 550124.10 SE=17500.07
The autoregressive integrated moving average model (1,0,0) was fitted for the different months (Jan 22 to Feb 23) with lag period of 3 months by R statistical open source software. The ACF and PACF functions show a positive correlation observed in January 22; from February to August, there shows negative movement of forex. Again, a positive move from September to December 22. Sales merchant forward (Fcy/Fcy), Spot (Fcy/Fcy), forward cancel (Fcy/Fcy) and interbank spot (Fcy/INR) yielded positive responses and growth. Other, broader factors of the SARSCoV-2 pandemic hit back on the decline of forex trading and these factors go beyond simply crunching the linear movement or growth. One of the biggest factors is unemployment, which is skyrocketing around the world as a result of the Ukraine-Russia war. The mounting job losses were potentially worse than the last five years (great depression) (Figures 4 and 5). The progressive growth was determined form bootstrap techniques; it is a resampling method used to estimate the sample distribution of a statistics given independent observations. It differs from traditional statistical theory, in that it requires modern computing power. The goal of sampling is to accurately represent a population of inference based on the salient assumption. all the observed values of US$ forex value normally distributed, estimated parameter SE is close to the sampling distribution of the estimated parameters SE and finally estimated parameter has a little bias in estimates. The random variable data series of Forex observed values of
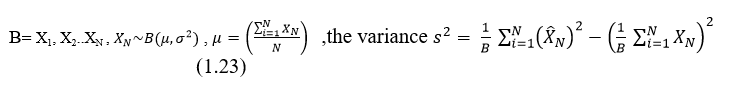
Simulation of data on the parameter concern

Times iteration very small observations. Asper the analysis of Forex (n=5100), mean 550124.10 SE=17500.073. Every lag period 17500 US$ will shows the depression of economy growth in Indian and directly causes inflation in all economic sector (Figure 7). The projection of GDP was projected from the model it was found to be 5.64 with SD was 2.82 co efficient of variation (R2=0.43).

Figure 7: Indian GDP projection from the model µ=E(x)=5.64, SD=2.822, variance=8.30.
| Year | SDR | Gold | Foreign currency assets | RTP | Forex reserves |
| 1960-61 | - | 1.18 | 1.86 | - | 3.04 |
| 1965-66 | - | 1.16 | 1.82 | - | 2.98 |
| 1970-71 | 1.12 | 1.83 | 4.38 | - | 7.33 |
| 1975-76 | 2.11 | 1.83 | 14.92 | - | 18.86 |
| 1980-81 | 4.97 | 2.26 | 48.22 | - | 55.45 |
| 1985-86 | 1.61 | 2.74 | 73.88 | - | 78.19 |
| 1990-91 | 2 | 68.28 | 43.88 | - | 114.16 |
| 1995-96 | 2.8 | 156.58 | 584.46 | - | 743.84 |
| 2000-01 | 0.11 | 127.11 | 1844.82 | - | 1972.04 |
| 2005-06 | 0.12 | 256.74 | 6473.27 | 33.71 | 6763.87 |
| 2010-11 | 204.01 | 1025.72 | 12248.83 | 131.58 | 13610.13 |
| 2017-18 | 100.2 | 1397.4 | 25975.7 | 135.2 | 27608.5 |
| 2018-19 | 100.76 | 1595.85 | 26655.64 | 206.57 | 28558.82 |
| 2019-20 | 108 | 2350.27 | 33338.15 | 27.13 | 36021.55 |
| 2020-21 | 125.57 | ||||
| 2021-22 |
Table 5: Forex reserves trend form 1960 to 2022.
IMF, 2020 report presented in Table 5. The driven facts and figure shows the forex reserves exponentially increasing trend from 1960 to 2020 (Growth).
79.83% cumulative growth. Forex is composed of gold holdings, Special Drawing Rights (SDR) and foreign currency asset. Other than these main components position of forex reserves, reserve tranche position with IMF also plays in important role for financial position of a country [10].
Undoubtedly, the SARS-CoV-2 (COVID-19) pandemic tarred the economies of these countries and affected them worldwide. Severely affected in developing and middle-income countries. The level of impact on the quality and well-being of the people and the level of impact on lives and economic holdings dependent on factors such as awareness and strict implementation of health policies drastically declined during the outbreak of disease in 2020-21. After lifting the lockdown at the global level, all infrastructure, service sectors and production sectors will perform extensively and move with a positive financial trend. The level of impact on various macroeconomic and social indicators varies in the Indian context. The apparent trend was significant as compared with some of the Asian countries. GDP had a great fall, followed by Singapore, Japan and Russia. India's exports and imports suffered a major setback during the pandemic. However, India achieved good success in forex and estimated reserves held in US treasuries at 255.1 billion US dollars. The unemployment rate in India was much higher during the pandemic period and the capital markets became more volatile due to the drastic low correlation in real estate. In a similar study conducted by Vijanath Babshetti, et al., the foreign reserves of Vietnam’s currency have remained stable as compared with those of other Asian countries. Therefore, the study concludes that, compared to the other Asian nations, COVID-19 adversely affected the Indian economy as well as the well-being of the people on all fronts. The COVID-19 pandemic notified by the WHO in January 2020 was the first challenge of the third decade that hit global growth. Two years later, as the global economy was recovering from the pandemic induced output contraction, the Russian-Ukraine conflict broke out in February 2022, triggering a swing in commodity prices and thus accelerating existing inflationary pressure. This posed the second challenge. Soon after, the third challenge emerged when nations undertook monetary tightening to rein in inflation, causing growth to weaken. Monetary tightening also drove capital flows to safe haven US$ markets, contributing to rising sovereign bond yields and the depreciation of most currencies against the US$. The social sector had significantly witnessed increases in government spending, with a marginal increase of INR 21.30 lakh crores in FY 23 from INR 9.1 lakh crores in FY 16. Another limitation was the poverty index, which significantly moved 41.50 crores people between 2019 and 20. The performance of the agriculture and allied sectors has been buoyant over the past several years, much of which is on account of the measures taken by the government to augment crop and livestock productivity, ensure certainty of returns to the farmers through a lack of price supports, not promote crop diversification, promote improper market infrastructure through the impetus provided for the setting up of farmer producer organizations and promote investment in infrastructure facilities through the agriculture infrastructure fund. The present study is in concordance with similar findings by Arunachalam, et al. India’s hugely successful efforts since 1991 to shore up its reserves are mostly in a basket of foreign currencies that are subject to volatility and disruptions. Because the foreign market is uncertain and very dynamic in nature. Any change in a single component affects the foreign exchange reserves of the country. Forex reserves are the external asset used for financing external payments like export bills, debt payments and intervention in exchange markets to affect the currency exchange rate, remittance payments and many other purposes. These foreign exchange reserves are controlled by the RBI. According to the RBI and IMF reports, Indian foreign reserves showed exponential growth during the COVID-19 pandemic due to several reasons, viz., import sharing and the sharp fall in crude oil prices from 60-70 dollars per barrel to 9-20 dollars per barrel. About 20% of India's import bill is received from crude oil, which has driven exponential growth and further foreign portfolio investment inflow. The government's decision in September to impose a lower corporate tax rate has attracted huge foreign portfolio investment in India. The report of the RBI $15.10 billion in foreign portfolio investment jumped between April and December 2019 and May 2020, representing about $29.78 billion in FDI and a fall in the gold price on the international market.
The summing of the results concludes that the Indian foreign exchange reserves at the global level are more impressive and each quarter that shows an exponential trend (marginal growth 50-60%). India stands as the fourth largest country in the world. All policy efforts and the intervention of flexible financial transactions led to an increase in forex reserves during the COVID-19 pandemic. The current forex reserves will greatly support GDP (suboptimal level 5.61) to cross the threshold level on the international market by 2030.
The present study had certain limitations; only secondary data sets were used for model construction with a limited lag period to derive the model output. The imputation method was applied for missing observations and data transformation was done for a limited scope (Less parameters were concerned) because of the COVID-19 pandemic.
We are greatly grateful to the RBI and IMF for spreading the forex data sets for users on the virtual platform.
There is no conflict of interest between the funding agency and the institution; we have not received financial support from any other funding agency.
The present study was conducted on real data sets and secondary information.
Citation: Basavarajaiah DM, Narasimhamurthy B (2025) Economic Analysis of Indian Foreign Exchange Reserves after Post COVID-19 Pandemic. J Hotel Bus Manag. 14:128.
Received: 30-Jul-2024, Manuscript No. jhbm-24-33280; Editor assigned: 02-Aug-2024, Pre QC No. jhbm-24-33280 (PQ); Reviewed: 16-Aug-2024, QC No. jhbm-24-33280; Revised: 15-Jan-2025, Manuscript No. jhbm-24-33280 (R); Published: 22-Jan-2025 , DOI: 10.35248/2169-0286.25.14.128
Copyright: © 2025 Basavarajaiah DM, et al. This is an open-access article distributed under the terms of the Creative Commons Attribution License, which permits unrestricted use, distribution and reproduction in any medium, provided the original author and source are credited.