Journal of Chromatography & Separation Techniques
Open Access
ISSN: 2157-7064
ISSN: 2157-7064
Research Article - (2017) Volume 8, Issue 5
A novel and simple method for detecting eight organic acids (lactic acid, acetic acid, fumaric acid, valeric acid, hexanoic acid, isovaleric acid, butyric acid and propionic acid) in animal feed using high-performance liquid chromatography equipped with a photodiode array (HPLC/PDA) detector was developed. The chromatographic peaks of the eight organic acids were successfully identified by comparing their retention times and UV spectra with reference standards. Method validation was performed in terms of linearity, sensitivity, selectivity, accuracy, and precision. The limits of detection (LODs) for the instrument employed in these experiments ranged from 11 to 8,026 μg/kg, and the limits of quantification (LOQs) ranged from 40 to 26,755 μg/kg. The average recoveries of the eight organic acids ranged from 76.3 to 99.2%. Method replication resulted in intraday and interday peak area variation of <5.3%. The method developed was specific and reliable and is therefore suitable for the routine analysis of organic acids in animal feed.
Keywords: Organic acid; Animal feed; HPLC; Simultaneous
Organic acids used as feed additives include lactic acid, acetic acid, fumaric acid, valeric acid, hexanoic acid, isovaleric acid, butyric acid and propionic acid, which are individually added to feed and drinking water or used in the form of complex organic acids [1]. The addition of organic acids to feed adjusts the pH of the gastrointestinal tract of the livestock to reduce the production of toxins by antibacterial and antifungal action and makes the culture of lactic acid bacteria and yeast favorable, helping promote growth and improve nutrient utilization. The addition of organic acids to feed also helps to improve the digestibility of protein and vegetable feed by lowering the pH of stomach acid and increasing pepsin activation [1-4]; fumaric acid can also have an energy supply effect as intermediate metabolites in the TCA (Tricarboxylic acid) cycle [5]. These functional properties enable organic acids to be recognized as raw materials for the substitution of antibiotics in animal feed worldwide. Researchers have reported that feeding organic acids shows a similar tendency toward nutrient utilization as that found when adding antibiotics for growth promotion [6]. As a result, organic acids are widely used as preservatives for animal feed, silage and grain.
Organic acids of varying types are typically mixed together to be used as complex organic acids when used as feed because the mechanism of action to inhibit harmful bacteria and types of inhibitory bacteria differs depending on the type of organic acid [1]. Although the current feed stuff manual indicates that the standard method to be used for feed analysis is the titration method, this method is not suitable in reality because of the propensity for large errors between different experimenters and the fact that only one component can be analyzed at any one time, which makes the analysis less efficient and timeconsuming due to increased feed inspection work volume. Therefore, it is necessary to understand the physicochemical characteristics of organic acids (lactic acid, acetic acid, fumaric acid, valeric acid, hexanoic acid, isovaleric acid, butyric acid and propionic acid), to secure their resolution in feed, and to develop a simultaneous analytical method using HPLC so that the efficiency of feed inspection work can be improved by utilizing a fast and accurate analytical method.
Various analytical methods for organic acids have been reported such as HPLC-UV (high-performance liquid chromatographyultraviolet detection) [7-11], LC-MS/MS (liquid chromatography-mass spectrometry/mass spectrometry) [12], and GC (gas chromatography) [13,14]. In comparison with the other analytical methods, LC-MS/MS is useful in terms of separation and quantification because it provides information on the molecular weight and structural properties of compounds. However, LC-MS/MS requires expensive equipment that is also difficult to operate and unfamiliar, which makes it difficult to apply. Many studies favor a detection method based on HPLC-UV, which is considered a suitable method for analyzing organic acids because it is cheaper, easier to operate, and more common.
This study used HPLC-UV to analyze eight organic acids (lactic acid, acetic acid, fumaric acid, valeric acid, hexanoic acid, isovaleric acid, butyric acid and propionic acid) simultaneously in feed ingredients, which not only improved the efficiency of the analysis with quick and accurate detection and quantification but also served as an aid in the management of feed standardized goods.
Samples
Experimental work was carried out using the organic acids contained in feed ingredients. Feed ingredients requested and supplied from local governments (Seoul, Gyeonggi, Gangwon, Daejeon, Chungbuk, Chungnam, Jeonbuk, and Jeonnam; 2016) were used as samples. A total of 50 samples were used, with each sample ground into powder (HMF- 100; HANIL Electric Co., Seoul, Korea) before measurement. The speed of the grinder was set to 22,000 rpm, and the samples were ground to a fine powder with particle sizes ranging from 4001,000 μm. All samples were stored at 4°C.
Chemicals and reagents
HCl and H2SO4, which are HPLC grade reagents, were purchased from Merck (Darmstadt, Germany). A Milli-Q RiOsTM/Elix water purification system (Millipore, Bedford, MA, USA) was used to provide distilled water. Lactic acid (98%), acetic acid (99%), fumaric acid (98%), valeric acid (99%), hexanoic acid (98%), isovaleric acid (99%), and butyric acid (99%) standardized goods were purchased from Sigma- Aldrich, and Propionic acid (99.8%) was purchased from Fluka. The physicochemical properties of the organic acids used are shown in Table 1.
| Common name | Chemical structure | Chemical formula | Melting point | Boiling point | Solubility in water |
|---|---|---|---|---|---|
| Valeric acid | 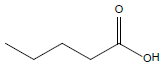 |
C5H10O2 | -34.5°C | 186.1°C | 24,000 mg/L (at 25°C) |
| Lactic acid | 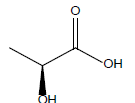 |
C3H6O3 | 53.0°C | 122.0°C | 1,000,000 mg/L |
| Acetic acid |  |
CH3COOH | 16.6°C | 118.1°C | 1,000,000 mg/L (at 25°C) |
| Fumaric acid | 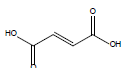 |
C4H4O4 | 287.0°C | 522.0°C | 7,000 mg/L (at 25°C) |
| Butyric acid | 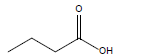 |
C4H8O2 | -7.9°C | 163.7°C | 60,000 mg/L (at 25°C) |
| Propionic acid |  |
C3H6O2 | -20.7°C | 141.1°C | 1000000 mg/L (at 25°C) |
| Isovaleric acid |  |
C5H10O2 | -29.3°C | 176.5°C | 40,700 mg/L (at 20°C) |
| Hexanoic acid |  |
C6H12O2 | -3.0°C | 205.0°C | 10,000 mg/L (at 20°C) |
Table 1: Physicochemical properties of lactic acid, acetic acid, fumaric acid, valeric acid, hexanoic acid, isovaleric acid, butyric acid and propionic acid.
Standard preparation
The working solution was prepared in concentrations of 1.0, 5.0, 10.0, 50.0, and 100.0 mg/L, with the stock solution prepared at a concentration of 1,000 mg/L by dissolving lactic acid, acetic acid, fumaric acid, valeric acid, hexanoic acid, isovaleric acid, butyric acid and propionic acid in 0.4% hydrochloric acid solution. Then, 10 μL of the solution was injected into the apparatus, and a standard calibration curve was created based on the peak area of the chromatogram.
Sample preparation
Next, 1 g of the homogenized sample was weighed in a tube and mixed with 20 mL of 0.4% HCl added by injection. The mixture was extracted using an ultrasonic extractor for 20 minutes and then filtered after centrifugation (3000 rpm, 10 min, 4°C) with a constant volume of 0.4% hydrochloric acid solution.
HPLC condition
The HPLC used in the analysis was carried out in Shiseido Nanospace SI-2 system (Shiseido, Tokyo, Japan) equipped with an auto sampler, photodiode array detector (PDA) and EZ Chrom Elite software (Shiseido). For the column, all separations were carried out using a reversed phase Imtak Unison UK-C18 (100 × 4.6 mm, 3 μm particle size) (Tokyo, Japan) with the temperature set at 40°C. H3PO4 was added to improve the resolution of the organic acid and to lower the pH, with 0.1% H3PO4 set as the mobile phase condition. The mobile phase was composed of A (0.1% H3PO4 in water) and B (Acetonitrile) with the following gradient elution: 0-3 min 0% B, 3-7 min 1% B, 7-13 min 13% B, 13-16 min 30% B, 16-23 min 55% B, and 23-24 min 0% B. Then, 10 μL of the sample was injected, flow rate was set to 0.6 mL/ min, and all peaks were detected using a wavelength of 210 nm. Prior to use, the mobile phase was filtered through a 0.45 μm filter (Millipore, Milford, MA, USA) and degassed under vacuum.
Method validation
The analytical method was verified for linearity, sensitivity, selectivity, accuracy and precision based on the criteria set by the International Conference on Harmonization (ICH, 2005) [15] and the International Union of Pure and Applied Chemistry (IUPAC, 2002) [16].
Method validation
To determine whether the conditions for the analysis of organic acids in feed ingredients were met, the RP-HPLC/UV analytical method was validated for linearity, sensitivity, selectivity, accuracy and precision [17].
The selectivity was determined by the presence or absence of peak interference on the chromatograph, which was measured using an empty chromatogram at a specific quantitative wavelength (210 nm). As shown in Figure 1 and Table 2, all eight compounds were successfully separated, with the retention times of the eight organic acids indicating that all peaks appeared within 20 minutes. In addition, the resolution and symmetry values were found to be in the range of 2.3-30.0 and 0.92-1.33, respectively, showing that the selectivity for the HPLC system is good.
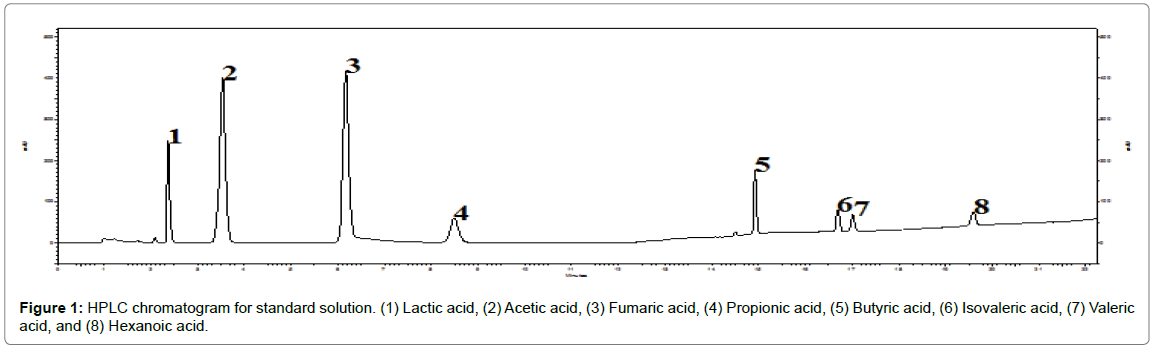
Figure 1: HPLC chromatogram for standard solution. (1) Lactic acid, (2) Acetic acid, (3) Fumaric acid, (4) Propionic acid, (5) Butyric acid, (6) Isovaleric acid, (7) Valeric acid, and (8) Hexanoic acid.
| Compound | Retention time | Resolution | Asymmetry |
|---|---|---|---|
| Valeric acid | 2.37 | 0.00 | 1.33 |
| Lactic acid | 3.54 | 6.95 | 0.92 |
| Acetic acid | 6.17 | 11.38 | 1.12 |
| Fumaric acid | 8.50 | 8.27 | 1.04 |
| Butyric acid | 14.93 | 29.97 | 1.07 |
| Propionic acid | 16.70 | 15.02 | 1.04 |
| Isobutyric acid | 17.02 | 2.30 | 1.04 |
| Hexanoic acid | 19.60 | 15.92 | 1.01 |
Table 2: Retention time, resolution, and asymmetry of eight organic acid compounds.
The linearity was evaluated by creating an external calibration curve for each compound using a working solution. Calibration curves were created from eight different concentrations and analytical peak areas, and each concentration of the mixed standard solution was injected 3 times before the regression parameters were calculated. The results showed that the correlation coefficient (r2) was more than 0.999, indicating high linearity (Table 3); therefore, this method can be used for quantifying the external standard calibration curve.
| Compound | Linear equation | r2 | LOD (µg/kg) |
LOQ (µg/kg) |
|
|---|---|---|---|---|---|
| Slope | Intercept | ||||
| Valeric acid | 1.9847 | -5.4204 × 10⁻¹ | 0.9998 | 160 | 533 |
| Lactic acid | 2.1038 | -2.1314 × 10⁻¹ | 0.9999 | 81 | 270 |
| Acetic acid | 2.9811 | 1.0911 × 10⁻¹ | 0.9997 | 8,026 | 26,755 |
| Fumaric acid | 1.6483 | -4.0911 × 10⁻¹ | 0.9999 | 11 | 40 |
| Butyric acid | 2.3824 | -5.1067 × 10⁻¹ | 0.9999 | 151 | 503 |
| Propionic acid | 2.0989 | 1.2049 × 10⁻¹ | 0.9998 | 133 | 443 |
| Isobutyric acid | 1.9461 | -0.9164 × 10⁻¹ | 0.9997 | 149 | 496 |
| Hexanoic acid | 3.0900 | 1.5019 × 10⁻¹ | 0.9998 | 252 | 839 |
Table 3: Linear equation for the calibration curve of the quantification, limit of detection and limit of quantification of eight organic acid compounds.
The sensitivity was determined by calculation of the limit of detection (LOD) and limit of quantitation (LOQ) values based on the response and slope in each regression equation of signal-to-noise ratio (S/N ratio). The LOD, determined at the peak of the component, was 3:1 of the S/N ratio under the optimum analytical conditions of the analytical instrument. In addition, the LOQ was defined as the lowest concentration at which the presence or absence of the target component can be accurately determined. In this experiment, the S/N ratio is 10:1, which corresponds to 10 times the range and 3 times the LOD. LOD, the range of values was set to 11-8,026 μg/kg and 40-26,755 μg/kg, respectively (Table 3).
The precision was determined by measuring the precision of recordings carried out on an intraday and interday basis. The intraday precision was calculated using data from six iterative analyses of the mixed standard solution conducted over a single day, while the interday precision was calculated by observing the solution for three consecutive days; the final precision values were calculated as a percentage of the relative standard deviation (% RSD). The intraday RSD was less than 4.9%, while interday RSD was found to be less than 5.3% (Table 4).
| Compound | Precision (% RSD) | Recovery | |||
|---|---|---|---|---|---|
| Intraday | Interday | Level 1 (10 mg/kg) |
Level 2 (50 mg/kg) |
Level 3 (100 mg/kg) |
|
| Valeric acid | 4.9 | 3.8 | 89.1 | 82.3 | 89.5 |
| Lactic acid | 4.1 | 3.2 | 90.7 | 92.0 | 81.3 |
| Acetic acid | 3.9 | 4.9 | 92.6 | 89.4 | 86.4 |
| Fumaric acid | 3.1 | 5.3 | 93.1 | 91.2 | 96.3 |
| Butyric acid | 3.8 | 3.1 | 83.3 | 88.9 | 90.1 |
| Propionic acid | 2.9 | 3.6 | 87.5 | 85.5 | 88.7 |
| Isobutyric acid | 2.3 | 2.9 | 88.8 | 81.3 | 79.0 |
| Hexanoic acid | 2.8 | 3.8 | 76.3 | 89.3 | 85.2 |
Table 4: Precision and recovery of eight organic acid compounds.
The accuracy was evaluated by adding a mixed standard solution of different concentrations (10 mg/kg, 50 mg/kg, and 100 mg/kg) to the AAFOCO (Association of American Feed Control Official, 201591-Swine Mineral and Vitamin Supplement) samples, followed by extraction of the mixtures using the HPLC method developed. All measurements were repeated 3 times, and as shown in Table 4, the recovery rate was good, 76.3-96.2%, with the accuracy of this method found to be high. Therefore, the method was verified to provide linearity, sensitivity, selectivity, accuracy and precision for the simultaneous analysis of organic acids.
Application of the method developed
This study analyzed 50 samples of feed ingredients containing organic acids supplied by local governments (Seoul, Gyeonggi, Gangwon, Daejeon, Chungbuk, Chungnam, Jeonbuk, and Jeonnam) (Table 5). Each sample was tested three times, and the eight compounds were identified through the retention time and UV spectra of the standard substance. In feed ingredients, the qualitative and quantitative composition of the eight organic acid compounds vary considerably. In particular, it can be seen that the range and average value of the valeric acid content were 67.27-109.10 mg/kg and 88.93 mg/kg, respectively. In addition, the content (average) of lactic acid, acetic acid, and fumaric acid were found to be 58.09-125.17 mg/ kg (95.61 mg/kg), 47.95-97.18 mg/kg (73.21 mg/kg), and 90.12-369.22 mg/ kg (205.95 mg/kg), respectively. -Butyric acid was found to have a content (average) of 69.01-110.58 mg/kg (86.42 mg/kg), and the content (average) of propionic acid and isobutyric acid were found to be 97.09-131.63 mg/ kg (113.09 mg/kg) and 70.69-120.17 mg/kg (100.54 mg/kg), respectively. The content (average) of hexanoic acid ranged from 112.27 to 150.18 mg/ kg (127.18 mg/kg).
| Compound | Local Governments | Average | |||||||
|---|---|---|---|---|---|---|---|---|---|
| Seoul | Gyeonggi | Gangwon | Daejeon | Chungbuk | Chungnam | Jeonbuk | Jeonnam | ||
| Valeric acid | 67.27 | 90.19 | 109.10 | 102.98 | 69.20 | 100.18 | 82.41 | 90.12 | 88.93 |
| Lactic Acid | 100.14 | 98.14 | 78.71 | 69.30 | 114.20 | 58.09 | 125.17 | 121.09 | 95.61 |
| Acetic acid | 49.95 | 50.10 | 90.36 | 58.24 | 97.18 | 89.30 | 60.33 | 90.18 | 73.21 |
| Fumaric acid | 200.13 | 104.06 | 98.37 | 294.61 | 210.04 | 281.04 | 369.22 | 90.12 | 205.95 |
| Butyric acid | 71.70 | 77.29 | 69.01 | 92.58 | 110.58 | 98.21 | 101.64 | 70.33 | 86.42 |
| Propionic acid | 131.63 | 97.07 | 104.29 | 111.09 | 129.38 | 130.00 | 99.19 | 102.09 | 113.09 |
| Isobutyric acid | 118.20 | 119.39 | 70.69 | 105.12 | 80.38 | 79.13 | 111.20 | 120.17 | 100.54 |
| Hexanoic acid | 113.98 | 115.99 | 130.71 | 112.27 | 132.09 | 150.18 | 142.11 | 120.10 | 127.18 |
Table 5: Determination of the content (mg/kg) of eight compounds in feed using the proposed method.
Therefore, qualitative and quantitative methods for the quantification and simultaneous detection of eight organic acids in samples of feed ingredients were successfully developed using an RPHPLC/ UV detector. In addition, this method showed accuracy and precision and can be used and applied efficiently to other types of feed. The HPLC method described in this study can provide a good alternative for routine analysis due to its specificity and sensitivity and can be used as a stable quality evaluation method for feed ingredients.